Copyright to IJIRSET www.ijirset.com 3437
OPTIMIZATION OF WELD CRACK
EXPANSION DEFECT OF WHEEL RIMS
BY USING TAGUCHI APPROACH: A CASE
STUDY
Dr. D. R. Prajapati
1, Daman Vir Singh Cheema
2Asst. Professor & Corresponding author, Dept. of Mech. Engg.,PEC University of Technology, Chandigarh, India1
P.G. Student, Dept. of Mech. Engg.,PEC University of Technology, Chandigarh, India2
Abstract: For off-line quality control, Taguchi realized that the best opportunity to eliminate variation is during the design of a product and its manufacturing process. Consequently, he developed a strategy for quality engineering that can be used in both contexts. Analysis of variance (ANOVA) is uses to analyze the significant factors of weld crack expansion defect of wheel defects of wheel rim manufacturing. This industry is located in northern part of India and producing the wheel rims. The main components manufactured by this firm are the wheel rims of automobiles. The range of diameter of wheel rims ranges from 10 inches to 30 inches and width may vary from 2.25”– 13” (inches). Through the Taguchi parametric design approach, the optimum levels of process parameters are determined. The percentage of contribution of each process parameter is determined by Analysis of variance. Taguchi’s experimental design yielded optimized control factors, resulting in superior product quality and stability. It is concluded that for weld crack expansion defect, the most significant factor is impact force (factor C) out of three factors.
Keywords: Weld crack expansion defects; wheel rim manufacturing industry; Taguchi approach; ANOVA technique
I. INTRODUCTION
Taguchi methods are statistical methods developed by G. Taguchi (1990) to improve the quality of manufactured goods and more recently also applied to, engineering, biotechnology, marketing and advertising. Profe ssional statisticians have welcomed the goals and improvements brought about by Taguchi methods, particularly by Taguchi's development of designs for studying variation. The process has three stages: (i) System design - This is design at the conceptual level, involving creativity and innovation. (ii) Parameter (measure) design- the nominal values of the various dimensions and design parameters need to be set, the detail design phase of conventional engineering. Taguchi's radical insight was that the exact choice of values required is under-specified by the performance requirements of the system. In many circumstances, this allows the parameters to be chosen so as to minimize the effects on performance arising from variation in manufacture, environment and cumulative damage. (iii) Tolerance design- with a successfully completed parameter design and an understanding of the effect that the various parameters have on performance, resources can be focused on reducing and controlling variation in the critical few dimensions
In statistics, analysis of variance (ANOVA) is a collection of statistical models, and their associated procedures, in which the observed variance in a particular variable is partitioned into components attributable to different sources of variation. In its simplest form ANOVA provides a statistical test of whether or not the means of several groups are all equal, and therefore generalizes t-test to more than two groups. Doing multiple two-sample t-tests would result in an increased chance of committing a Type I error. For this reason, ANOVAs are useful in comparing two, three or more means.
Copyright to IJIRSET www.ijirset.com 3438 technique useful where many possible courses of action are competing for attention. This technique helps to identify the top 20% of causes that need to be addressed to resolve the 80% of the problems. Once the top 20% of the causes are identified, then tools like the Ishikawa diagram or Fish-bone Analysis can be used to identify the root causes of the problems.
II. LITERATURE REVIEW
Deming [1] developed a new quality-improving concept, which extended quality inspection to statistical process control (SPC). The activities of off-line quality control are promoted by Design of Experiments (DOE).Various related research papers are summarized here in this section.
Jang et al. [2] studied the Taguchi method, a robust experimental design and used it to optimize manufacturing parameters of a brake lining. In their work, a brake lining containing 15 ingredients is employed to find the best manufacturing parameters for wear resistance and friction stability of a brake lining. Results of their work show no apparent relationship between the physical properties and tribological performance of a brake lining. Casalino et al. [3] studied Ti6Al4V which presently is one of the most widely used titanium alloys, accounting for more than 50% of all titanium tonnage in the world, and to date no other titanium alloy has been a threat to its dominant position. Laser welding of Ti6Al4V is a major issue in the automotive and aerospace industries. In their study, both CO2 and diode laser welding processes were investigated for Ti6Al4V alloy sheet joining using either lap or butt configurations. Hong et al. [4] studied to optimize Nd:YAG laser welding parameters to seal an iodine-125 radioisotope seed into a titanium capsule. If the end of a small titanium tube is irradiated to a Nd:YAG laser beam and melted down to the adequate length, it will be coalesced and sealed. The accurate control of the melted length of the tube end was the most important to obtain a sound sealed state. The effects of the laser welding parameters on the melted length were analyzed and optimized by the Taguchi and regression analysis method. Anawa and Olabi [5] studied the most common problem of welding dissimilar metals (DMWs) with respect to residual stresses due to the differences in the coefficient of thermal expansion and heat conductivity of the two welded metals. In the work, a CO2 continuous laser welding process was successfully applied and optimized for joining a dissimilar AISI 316 stainless steel and low carbon steel plates. The Taguchi approach with three factors (selected welding parameters) at five levels each (L3-25) was applied to find out the optimum levels of welding speed, laser power and focal position for CO2 keyhole laser welding of dissimilar butt weld. The responses outputs were the residual stresses at different depth in the heat affected zone (HAZ).
Esme [6] investigated the effect and optimization of welding parameters on the tensile shear strength in the resistance spot welding (RSW) process. The experimental studies were conducted under varying electrode forces, welding currents, electrode diameters, and welding times. The settings of welding parameters were determined by using the Taguchi experimental design method. The level of importance of the welding parameters on the tensile shear strength is determined by using analysis of variance (ANOVA). The optimum welding parameter combination was obtained by using the analysis of signal-to-noise (S/N) ratio. Al-Refaie et al. [7] proposed a simple, yet very effective, approach for solving the multi-response problem in the Taguchi method. Each quality response was transformed into signal-to-noise (S/N) ratio. The average S/N ratio is calculated for each factor level, and then weighted with respect to the level of the largest average S/N ratio for this factor. The average weight of each factor level, or level weight, is obtained from all responses. The factor level with the largest level weight is selected as the optimal level for that factor.
Arora et al. [8] studied Taguchi methodology for designing the experiments to investigate how different parameters affect the mean and variance of process performance characteristics. In this paper, the Taguchi methodology is implemented in the casting industry located in north India. Various Experiments are carried out to validate the results, obtained after implementation of Taguchi methodology in automotive process industry and the most important parameters affecting the product life are also determined. The results indicate that the selected process parameters affect the quality of products significantly.
Copyright to IJIRSET www.ijirset.com 3439 predicted optimal value of joint strength was found to be 83.26 MPa. The results were confirmed by further experiments.
Bilici [11] presented experimental and numerical results of friction stir spot welding of high density polypropylene. The determination of the welding parameters plays an important role for the weld strength. The experimental tests, conducted according to combinations of process factors such as tool rotation speed, plunge depth and dwell time at beginning welding were carried out according the Taguchi orthogonal table L9 in randomized way. Finally, the improvement in the weld strength from the initial welding parameters to the optimal welding parameters was about 47.7%. Luming et al. [12] studied Titanium having high strength-to-weight ratio, corrosion resistance, excellent weldability and well biocompatibility. It is applied in various fields, such as medical and aerospace industry. The key point or welding quality is the combination of laser welding parameters. In this paper, the effects of the Nd: YAG laser welding parameters is discussed and analyzed at first, and then a novel application of Taguchi’s matrix method is proposed to optimize the selection of laser seal welding thin titanium shell, including the main parameters such as laser power, welding speed, defocusing amount and shield gas, finally the manufacture process for sealing neuro-stimulator is confirmed.
III. INTRODUCTION OF INDUSTRY
This industry was established in 1985 and its commercial production started in 1991, with a vision to innovate – to continually reinvent the wheel into the driving force behind comfortable motion. The plant is situated in northern part of India with a capacity of 5 lakhs wheel rims per month. The company has technical collaboration with one company of Japan. This company is ISO-9000, QS-9000, TS-16949 9000 and ISO 14001 certified company.
A. Products Manufactured By The Company
The main components manufactured by this firm are the wheel rims of automobiles. The range of diameter of wheel rims ranges from 10 inches to 30 inches and width may vary from 2.25”– 13” (inches). The wheel rim of 10” is mainly being used in scooters, three wheelers etc. The wheel rims of diameter range of 13”-16” are mainly used in cars. The wheels of larger diameters are mainly used for tractors, harvesting combines & HCVs etc.
B. Customers Of The Company
1. Maruti Suzuki, India 2. Tata Motors 3. Honda Siel Cars India 4. Mahindra & Mahindra 5. General Motors India 6. Punjab Tractors Ltd. 7. New Holland Tractors 8. Escort Ltd. 9. Eicher Tractors
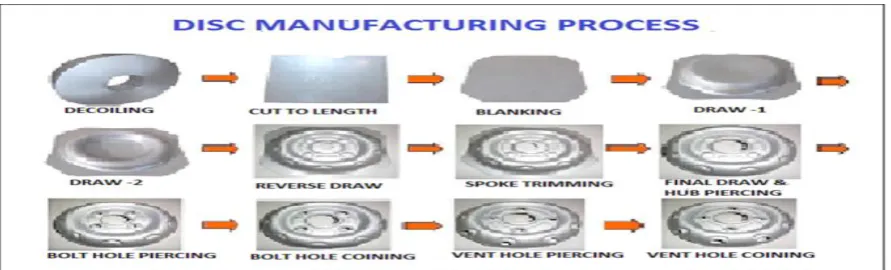
C. Manufacturing Process
A brief manufacturing process is shown with the help of flow diagram, as shown in Fig. 1.
Copyright to IJIRSET www.ijirset.com 3440 D. Output And Rejection Details
The average percentage of rejection of defectives along with their causes in assembly line of the wheel rim industry for the year 2011-12 for all the four quarters is shown in Table I.
Table I Percentage of defects and their causes for all the quarters
S No
Name of defects Average Percentag e of defectives
Causes
1 Weld crack expansion
33.48 Material composition may not be correct.
Burrs remain during cutting of length operation
Spiral Problem: In this faces which are to be joined during welding are not properly aligned to each other so welding doesn’t properly take place. Faces remain unaligned to each other.
Fusion problem due to improper current.
Clamping Force – It is the force with which both the faces to be joined are held together. Cylinder pressure & leakage in cylinder account for it. 2 Trim line 16.445 Improper coiling.
Spiral problem- Faces are not properly aligned Flattening may not be properly done.
Wear out of trimmer tool.
Electrode height might not be adjusted. Improper setting of trimmer angle.
Improper gap between tool & slag to be removed. 3 Bad fusion 8.9875 Improper material composition.
Burrs on faces, to be welded.
Spiral Problem: misalignment of faces to be welded is not aligned to each other.
Improper fusion due to insufficient supply of current. Improper clamping pressure and improper voltage. 4 Dimensioning
problem
6.6775 Improper setting of side spacer guides.
5 Bad rolling 5.46 Improper setting of loader
6 Bad coiling 4.5125 Incoming material not properly checked. 7 Material crack
expansion
3.825
Grain size of not proper grade.
8 Material scratch 3.4475 Improper setting of loader. Improper setting of side spacer guides. 9 Stamp problem due
to CTL 3.2075
Stamp offset due to less hydraulic pressure.
10 Wrong expansion 2.9 Improper expansion force 11 Stamp opposite on
ref-1 2.5225
Unskilled labor.
12 Material pitting 2.1725 Slag not properly removed before upsetting. 13 Bad flaring 2.065 Due to unskilled labor as manual machines are used. 14 Tilted welding on
B/W 1.4975
Clamping pressure not proper.
15 Air leakage machine 0.8875 Improper butt welding of joint
Copyright to IJIRSET www.ijirset.com 3441 17 Over bead 0.47 Improper welding speed
18 Undercut
0.3275 Improper settings of depth of cutting tool.
19 Scuffing problem 0.2675 Excessive usage of die and Coolant not properly cleaned.
20 Bead seat diameter
more 0.059
Due to increase in outer diameter after flaring.
21 Vent hole opposite
mark 0.0575
Due to improper indexing in vent hole die
Table 1 shows the percentage rejection of products for all the quarters (year 2011-12) manufactured in the Korea assembly line. Study has been performed on the assembly line to reduce the rejection of products by applying Taguchi and ANOVA method. The various types of defects are responsible for rejection of product but weld crack expansion defect plays major role in rejection, as its percentage occurrence is 33.48. So Taguchi methodology is applied for weld crack expansion, which has been further studied for their reduction by controlling the parameters affecting it.
E. Weld Crack Expansion Defect
It is a defect which occurs in rim after getting its final touch from rim assembly line, used for the sizing (expansion) in order to get proper fitting with disc. This operation is performed on Hydraulic press machine of 160 Tons. The wheel rim is fitted in a die which is fixed and another die hits it vertically with force and due to impact of vertical die the rim gets expanded to required dimensions. The problem sometimes arises when vertical die hits the rim at the place, where rim is butt welded, and it wears out or cracks starts getting appeared and this wearing is known as weld crack expansion.
F. Factors Responsible For Weld Crack Expansion
As a result of brainstorming session, following important factors are responsible for the weld crack expansion defect:
Improper current for welding (in ampere) causes fusion problem
Clamping pressure – It is the force with which is required to join both the faces. Cylinder pressure & leakage in cylinder accounts for it.
Impact force or force for expansion
G. Application Of Taguchi Approach
The Taguchi approach is implemented in the above industry to find the optimal solution regarding causes for rejection due to weld crack expansion defect. Table II shows the important process parameters and their levels.
Table II Process designations and process parameters
.
H. Selection Of Orthogonal Array (Oa)
An orthogonal array is a type of experiment where the columns for the independent variables are “orthogonal” to one another. For this case study, the Orthogonal Array of (OA)8 (2)3 has been selected. Where
8 = number of trials are used.
(2) = number of levels of each factor and ( )3 = number of factors
Process designation Process parameters Level 1 Level 2
A Current for welding (in ampere) 420 460
B Clamping Pressure (in bar) 70 90
Copyright to IJIRSET www.ijirset.com 3442
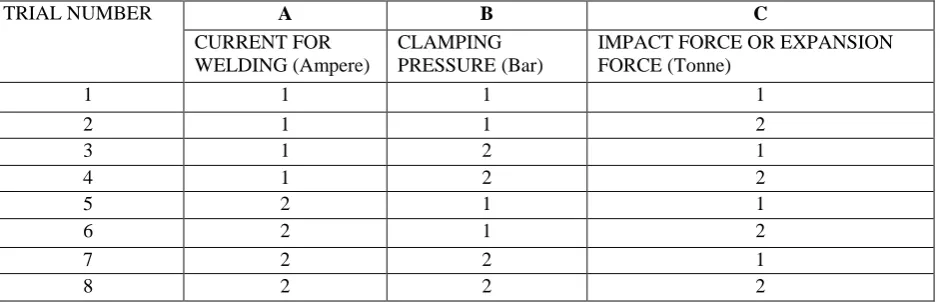
I. Taguchi’s Orthogonal Array, (2)3 For Weld Crack Expansion Defect
Table III shows the orthogonal array design for experimental run recommended by Taguchi. The first column shows trial numbers while second, third and fourth columns show factors responsible for the weld crack expansion defect.
Table III Taguchi’s orthogonal array design
TRIAL NUMBER A B C
CURRENT FOR WELDING (Ampere)
CLAMPING PRESSURE (Bar)
IMPACT FORCE OR EXPANSION FORCE (Tonne)
1 1 1 1
2 1 1 2
3 1 2 1
4 1 2 2
5 2 1 1
6 2 1 2
7 2 2 1
8 2 2 2
J. Experimental Orthogonal Array- Oa8 (2)3 For Weld Crack Expansion Defect
Table IV shows experimental orthogonal array design for the experiments of the case study. The first column shows trial number whereas second column shows the values of factor A i.e. current (420 and 460 amperes) for welding. Third column shows factor B i.e. clamping pressure (70 and 90 bar) whereas fourth column shows factor C i.e. impact force or expansion force (100 and 140 tons).
Table IV Experimental orthogonal array
K. Signal To Noise Ratio (S/N Ratio) For The Case Study
Taguchi's emphasis on minimizing deviation from target led him to develop measures of the process output that incorporate both the location of the output as well as the variation. These measures are called signal to noise ratios.
The signal to noise ratio provides a measure of the impact of noise factors on performance. The larger the S/N, the more robust the product is against noise. Calculation of the S/N ratio depends on the experimental objective:
TRIAL NUMBER
A B C
Current for welding (in ampere) Clamping pressure (in bar) Impact force (in tons)
1 420 70 100
2 420 70 140
3 420 90 100
4 420 90 140
5 460 70 100
6 460 70 140
7 460 90 100
Copyright to IJIRSET www.ijirset.com 3443
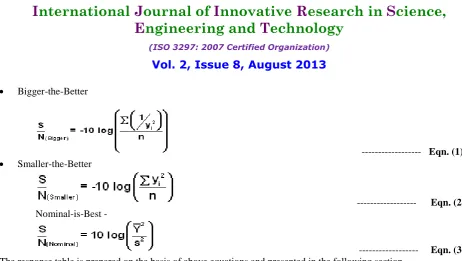
Bigger-the-Better
--- Eqn. (1)
Smaller-the-Better
--- Eqn. (2) Nominal-is-Best -
--- Eqn. (3)
The response table is prepared on the basis of above equations and presented in the following section.
L. Response Table For Orthogonal Array- Oa8 (2)3 For Weld Crack Expansion Defect
Table V shows response table and calculated S/N ratios for experimental orthogonal array.
Table V Response (R1, R2, R3) and S/N Ratio Table
TRIAL NUMBER
A B C R1 R2 R3 S/N
RATIO
1 1 1 1 17 17 17 -24.6
2 1 1 2 16 16 16 -24.08
3 1 2 1 17 16 16 -24.26
4 1 2 2 17 17 16 -24.44
5 2 1 1 16 16 16 -24.08
6 2 1 2 17 16 16 -24.26
7 2 2 1 15 14 14 -23.13
8 2 2 2 18 19 18 -25.26
S/N ratio (lower is better) = -10log10 (1/n ∑y2)
Where R1, R2 and R3 are rejected parts from our sample size of 1000.
M. Sample Calculations Of S/N Ratio S/N ratio (lower is better) = -10log10 {1/n ∑y2)
For trial number 1, S/N ratio= -10 log10 {1/3(17+17+17)2} = -24.6
Similarly, S/N ratios for other trials may be calculated as shown in the last column of the Table 5.
N. Analysis Of Variance (Anova)
ANOVA analysis has been done for Table V.
Correction factor (CF) = (sum total of all observations)2 /total number of all observations Where, Total sum of squares (SStotal) = ∑ yj2 – CF
Degree of freedom= number of levels – 1
Total degree of freedom= total number of observations – 1
O. Anova Formulae For Main Effects
Copyright to IJIRSET www.ijirset.com 3444 m- Number of observation for each level
Mean Sum of Squares for each factor A (MSSA) = ratio SSA/dof A
Correction factor (CF) can be calculated as
(CF) = (51+48+49+50+48+49+43+55)2 = 6435.375
24 Total sum of square (SStotal) = ( 17
2
+ 172 + 172 + 162 + 162 + 162 + 172 + 162 + 162 + 172 + 172 + 162 + 162 + 162 + 162 + 172 + 162 + 162 + 152 + 142 + 142 + 182 + 192 + 182 ) -6435.375
= 29.625
Total Degree of freedom= 24-1= 23
Sum of square of Factor A (SSa) = (A1)2 + (A2)2 – C.F. m
Where Ai = sum of total of the observations in level A(i), i= 1,2,…….,k and m is number of observations Sum of square for factor A (SSa) =
(17+17+17+16+16+16+17+16+16+17+17+16)2+ (16+16+16+17+16+16+15+14+14+18+19+18)2 12
- 6435.375
SSa = (198)2 + (195)2 - 6435.375 SSa= 6435.75 – 6435.375 = 0 .375
12
Similarly, Sum of square for factor B and C are: SSb= 0.45 and SSc = 5.04
Residual sum of square by subtraction (SSe) = SStotal – SSa – SSb - SSc
SSe= 29.625 - .375- .45 – 5.04 = 23.76
Residual degree of freedom= total degree of freedom – (sum of degree of freedom of each factor) = 23 – (1+1+1) = 20
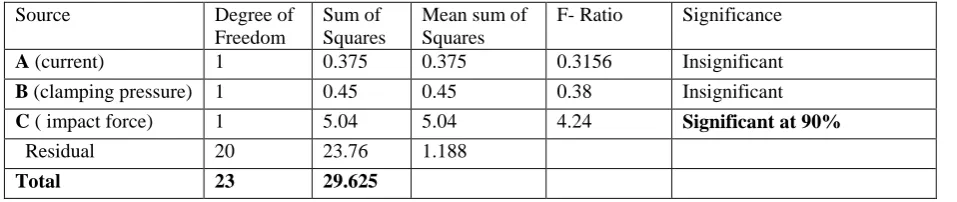
P. Anova Table For Weld Crack Expansion Defect
Table VI shows the ANOVA table for Mean sum of squares and F-Ratio for weld crack expansion defect.
Table VI ANOVA for weld crack expansion defect
Source Degree of
Freedom
Sum of Squares
Mean sum of Squares
F- Ratio Significance
A (current) 1 0.375 0.375 0.3156 Insignificant
B (clamping pressure) 1 0.45 0.45 0.38 Insignificant
C ( impact force) 1 5.04 5.04 4.24 Significant at 90%
Residual 20 23.76 1.188
Total 23 29.625
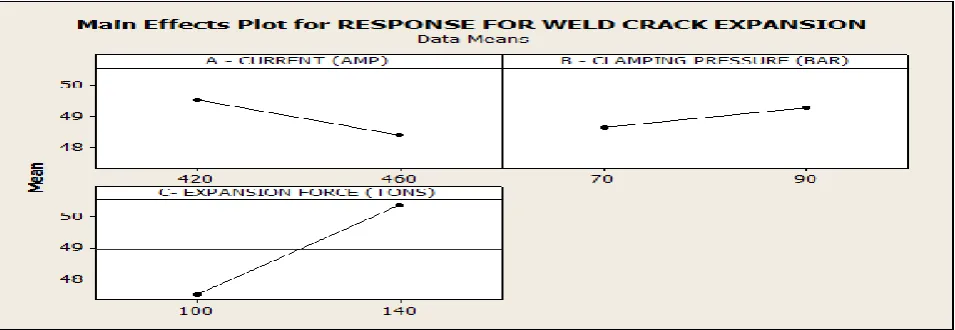
Q. Anova Graph For Weld Crack Expansion Defect By Using Minitab Software
ANOVA graphs for weld crack expansion show the variation in number of defects for various changes in factor’s values. For Current (factor A) the numbers of rejected pieces keep on decreasing on increasing the value of current from 420 to 260 amperes.
Copyright to IJIRSET www.ijirset.com 3445 Fig. 2 ANOVA graphs for weld defect
IV. CONCLUSIONS
Taguchi method is statistical method developed by G. Taguchi to improve the quality of manufactured goods. It is concluded that the application of Taguchi’s experimental design to the manufacturing of wheel rims improves the productivity by identifying and rectifying the causes of defects. Taguchi’s experimental design yielded optimized control factors, resulting in superior product quality and stability. It is concluded that for weld crack expansion defect, the most significant factor is impact force (factor C) out of three factors.
Taguchi method yielded optimized control factors which will result in superior product quality and stability. From the analysis, it is concluded that the Taguchi method of parameter design at the lowest possible cost will be useful to identify the optimum levels of signal factors, due to which the noise factors effect on the response parameters is less. The outcome of this work is the optimized process parameters of the manufacturing process of wheel.
The limitation of the Taguchi method is that it cannot judge and determine the effect of individual parameters on entire process while percentage contribution of individual parameters can be determined using (ANOVA) technique. ANOVA can be useful for determining influence of any given input parameter from a series of experimental results using design of experiment.
REFERENCES
[1] Deming, W. E., “Out of the Crisis”, Unlimited Learning Resource, LLC, Winston-Salem, North Carolina, 1982.
[2] Jang, H., Kim, S.J. and Kim, K.S., “Optimization of manufacturing parameters for a brake lining using Taguchi method”, Original Research Article Journal of Materials Processing Technology, Volume 136, Issues 1–3, pages 202-208, 2003.
[3] Casalino, G., Curcio, F. and Minutolo, F.M.C., “Investigation on Ti6Al4V laser welding using statistical and Taguchi approaches.” Journal of Materials Processing Technology, Volume 167, Issues 2–3, pages 422-428, 2005.
[4] Hong, S.B., Lee, H.K., Han, H.S. and Son, K.J., “Optimization of Nd:YAG laser welding parameters for sealing small titanium tube ends.” Materials Science and Engineering: A, Volume 415, Issues 1–2, pages 149-155, 2006.
[5] Anawa, E.M. and Olabi, A.G. “Using Taguchi method to optimize welding pool of dissimilar laser-welded components” Original Research Article Optics & Laser Technology, Volume 40, Issue 2, March 2008, Pages 379-388, 2008.
[6] Esme, U., “Application of Taguchi method for the optimization of resistance spot welding process” The Arabian Journal for Science and Engineering, Volume 34, Number 2B, pp. 519-528, 2009.
[7] Al-Refaie, A. Tai-Hsi Wu and Li, M.S., “An effective approach for solving the Multi-Response problems in Taguchi Method”. Jordan journal of Mechanical and industrial engineering. Volume 4, Number 2, Pages 314 – 323, 2010.
[8] Arora, R. K., Prajapati, D.R., and Singh, S., “Implementation of Taguchi Methodology in Automotive Process Industry” Proceedings of 2nd
International Conference on Production and Industrial Engineering (CPIE 2010), 3rd – 5th December, NIT Jalandhar, pp. 1428-1434, 2010.
[9] Vinodh, S., Kumaran, S.S., and Muthukumaran, S., “Optimization of friction welding of tube-to-tube plate using an external tool by Taguchi method and genetic algorithm.” The International Journal of Advanced Manufacturing Technology, 2011, Volume 57, Numbers 1-4, pages 167-182, 2011.
[10] Balaji, G.K., Muthukumaran, S., Senthilkumaran, S. and Pradeep, A., “Optimization of Friction welding of Tube-to-Tube Plate Using an External Tool with Filler Plate.” Journal of Materials Engineering and Performance, Volume 21, Issue 7, pp. 1199-1204, 2011.
[11] Bilici, M. K., “Application of Taguchi approach to optimize friction stirs spot welding parameters of polypropylene.” Materials & Design, Volume 35, pages 113-119, 2012.
Copyright to IJIRSET www.ijirset.com 3446 BIOGRAPHY
Dr. D. R. Prajapati is having the teaching and research experience of more than 17 years and published more than 65 research papers in international and national journals of repute and in the proceedings of the conferences. He is also reviewer of 6 international journals. He also guided 2 Ph.D. and more than 14 post graduate theses and guiding 4 research scholars at present. He has also chaired international and national conference in India and abroad. He also organized two short term courses and one All India Conference for the faculty of technical institutions and industries. He is also recipient of first D. N. Trikha research award for excellent research publications in international journal for the year 2009 in PEC University of Technology.
Mr. Damanvir Singh Cheema (Co-author)