IJIRT 145288
INTERNATIONAL JO URNAL OF INNOVATIVE RESEARCH IN TECHNOLOGY356
Optimization of Cutting Parameters for Surface
Roughness in CNC Turning Using Taguchi and
Regression Approach
Md. Zuber Khan
1, Gourav Purohit
2, Indresh Kumar Jain
3 1Department of Mechanical Engineering, Aravali Institute of Technical Studies, Udaipur
2Assistant Professor, Department of Mechanical Engineering Aravali Institute of Technical Studies,
Udaipur
3
Assistant Professor, Department of Mechanical Engineering, Geetanjali Institute of Technical Studies,
Udaipur
Abstract- Prediction of surface roughness and
dimensional inaccuracies is an essential prerequisite for any unmanned computer numeric controlled (CNC) machinery. This prediction technique is also important for optimization of machining process. In the present work, it is observed that, using Taguchi approach, the quality of surface finish can be predicted within a reasonable degree of accuracy by taking the triaxial cutting forces into account. S urface roughness and cutting forces are the critical factors which influence the quality of the machined parts.
In this research paper, an attempt has been made to optimize the cutting conditions to get predicted surface roughness in turning of Mild S teel. The experiment was designed using Taguchi full factorial approach and 27 experimental runs were conducted for various combinations of cutting parameters. The signal to noise ratio and analysis of variance (ANOVA) were employed to study the performance characteristics at different conditions. In order to analyze the response of the system, experiments were carried out at various spindle speeds, depth of cut and feed rate. The results obtained by this research will be useful for various industries and researchers working in this field.
Index Terms- CNC; S urface roughness; Taguchi
method; ANOVA.
1. INTRODUCTION
In the last three decades, there have been immense technical revolutions in the manufacturing segment, namely computer integrated manufacturing industries [1]. In today‟s global manufacturing environment, all the companies are competing to produce high quality
product at lowest cost. In order to achieve this goal, there is a trend of companies towards technical revolution or modernization. The companies are tending towards automated unmanned CNC cells for increasing the production rate and decreasing labor cost. However, due to lack of continuous operator monitoring it can cause defects in the machined parts. Turning is the most common machining operation which is specially being used for the finishing of machined parts. In a typical turning operation, certain machine parts may require specified surface roughness .It is an important parameter in mechanical applications that influence widely the performance of the parts and it is one of the major quality attribute of the machined parts. Such parts may be bearing surfaces, sealing surfaces etc. which need continuous operator monitoring else that may lead defects. In turning operation, it is crucial task to select cutting parameters for achieving better performance. Usually, these parameters are determined on the basis of experience or by the use of machinery‟s handbook. Tool wear is a major factor which affects the surface roughness but the operator can hear the chattering sound of the worn out tool and see the tool condition or can use tool condition monitoring system to measure the tool wear. Researchers and engineers are already trying to evolve a highly reliable cutting tool condition monitoring system [2].
Numerous surface roughness prediction systems have been designed using variety of sensors including
dynamometers for force and torque [3],
IJIRT 145288
INTERNATIONAL JO URNAL OF INNOVATIVE RESEARCH IN TECHNOLOGY357
current probes for measuring power of the spindle [5], acoustic emission sensors [6] etc. The applications of these sensors are to predict the surface roughness according to the collected data from the sensors. A more detailed discussion was presented on surface roughness prediction which was presented by Benardos & Vosniakos[7].
Robust design for the engineering is a better methodology for obtaining best set of results which are minimally sensitive to the numerous causes of variation to produce best quality products at least cost. Taguchi and ANOVA parameter is important tool for such kind of robust design which offers simple and systematic approach to optimize the design data [8-13]. These techniques can be employed for optimizing the desired results by controlling the design parameters in several experimental runs. Taguchi design can optimize the results through setting of design parameters as per requirement [14]. On the other hand, ANOVA is employed to recognize the most significant variables and their interaction effects along with their percentage contribution [15].
A good trade-off between quality, cost and performance with maximum reliability and minimum time will be proposed from in process optimization of machining parameters during turning using cutting force sensing.
There were three objectives of this research. The first was to conduct systematic experimental runs and in process as well as post process data collection. The second was to reveal a systematic procedure of using Taguchi parameter design for identification of optimum parameters. The third was to analyze the results to obtain desired surface roughness with a particular combination of cutting parameters in turning operation.
Thus, the paper is organized in the following manner. Firstly, an overview and previous studies to the
relevant work has been discussed. Then,
experimental setup and data collection systems along with their technical specifications have been discussed. In the next section, procedure for experimental data collection and the data tables to the relevant work is included. After that, the analysis of the collected data is discussed using Taguchi approach, ANOVA approach and their prediction runs are performed to check the accuracy of the
experimental setup. Finally, the paper concludes with a summary and discussions of this study.
2. MATERIAL & METHOD
This section presents a meticulous description of the material which involves chemical composition and mechanical properties of the material and the experimental procedure being used for this experimentation.
2.1 Material & its specifications
The work piece material for this experiment was Mild Steel. It is the commonly used wrought alloy in all the industries for manufacturing of durable, light weight and corrosion resistive parts. Mechanical properties and chemical composition of Mild Steel is as shown in Table 1 & 2 respectively. The work pieces were cut from 30mm (0.03 m) diameter rod. Each work piece was roughly cut prior to the final finish cut in order to maintain dimensional inaccuracies and proper measurement of vibrations at varying cutting parameters
2.2 Experimental Design and Setup
This experiment involves a basic Taguchi design in which an orthogonal array design is used to perform experimental runs at various cutting parameters. The experiment involves three controlled factors and two response variables. The controlled factors are spindle speed, depth of cut and feed rate while the response variables are surface roughness and cutting forces along three axes.
As shown in Table-3, all the three controlled factors i.e. spindle speed (SS), depth of cut (DC) and feed rate (FR) has three levels. This results in total of 27 runs to be conducted to test all the combinations of the parameter level according to Taguchi L27 orthogonal array design as shown in Table-4 according to full factorial design. In full factorial design each parameter combination is used for experimental run i.e. 3^3 runs, which results in a larger number of experiments in comparison to the randomized schedule of runs but provide accurate results.
IJIRT 145288
INTERNATIONAL JO URNAL OF INNOVATIVE RESEARCH IN TECHNOLOGY358
The experiment was performed using CNC turning on HMT CNC technologies Series slant bed CNC lathe. This is a bi-directional turner lathe which incorporates a 30° slant bed setup and some other special features that help in better machining and surface finish. The major technical specifications of the CNC Turning centre are given in Table-5. In order to maintain constant machining and vibration condition, this experiment was performed with dry cutting i.e. without use of coolant.
Table 1: Mechanical Properties of Mild Steel Alloy
[52]
Table 2: Chemical Composition of Mild Steel Alloy, % Weight [53]
Table 3: Experimental Levels of Cutting Parameter
Cutting Parameters
Units No. of
Levels
Values For Each Level Level 1
SS rpm 3 1500
DC mm 3 0.20
FR mm per rev. 3 0.075
SS: Spindle speed; DC: Depth of cut; FR: Feed rate The selected parameters values were set using the NC program and data were stored in CNC‟s control unit.
The machining process was conducted using a new diamond shaped carbide tool insert.
The in process cutting force data collection system was used which measures the triaxial cutting forces at various cutting parameters. The system was comprised of a tri-axial digital dynamometer which measures and amplifies the cutting force signals in the three axes of the lathe i.e. X, Y and Z axes. The tri-axial cutting force sensor was used which amplifies the signal. All the signal data were recorded and digitized for analysis purpose.
2.3 Experimental Procedure
A schedule of runs was created at various combinations according to Taguchi design of experiments as shown in Table-4.The work pieces from the bar were cut and turned with specified cutting conditions. The dry turning was performed for each run in order to get accurate cutting force signals. During the finish turning cutting force data were collected on each axes using data collection system. After completion of all the runs, the surface roughness of all the work pieces was measured. Surface roughness was measured at each 90° increment around the circumference i.e. four times for each work piece and finally their average value is stored in the data table. Data processing and its analysis were performed through MINITAB-17 statistical software. The parameters and results of each individual run which includes corresponding SN ratio as shown in Table-6.
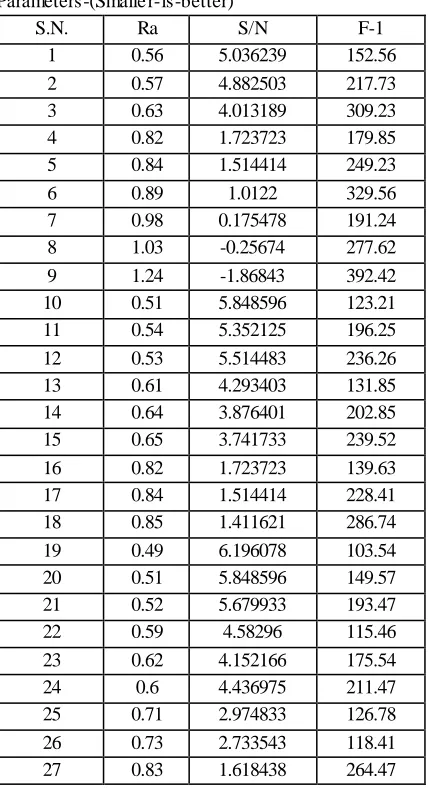
2.3Analysis of S/N Ratios & Analysis of Variance (ANOVA)
For Taguchi analysis, experimental results of surface roughness are transformed into Signal to Noise (S/N) ratio (η) as shown in Table 6. Here the signal is representing the desirable value i.e. mean of the output characteristics while the noise represents the undesirable value i.e. squared deviation of output characteristics. Usually, there are three categories for analysis of S/N Ratio i.e. the smaller is better , the larger is better , the nominal is best. The S/N ratio for each level of process parameter is computed by S/N analysis. Regardless of the category, the larger S/N ratio is recommended for better performance. Thus, the optimal parameter for any factor is the level having highest S/N ratio.
Sr. No. Properties Value
1 Hardness 65 BHN
2 Elongation 26-47 %
3 Tensile Strength 345-580 MPa
4 Yield Strength 250-395 MPa
5 Young‟s Modulus 200-250 GPa
6 Thermal Conductivity 138 W/mK
7 Fatigue Strength 25.9 GPa
8 Density 7800-7900kg/ m3
Sr. No. Component %Wt.
1 Fe 98.24
2 C 0.2
3 Si 0.15
4 S 0.05
5 P 0.04
6 Mn 0.58
7 Ni 0.13
8 Cr 0.11
9 Mo 0.016
IJIRT 145288
INTERNATIONAL JO URNAL OF INNOVATIVE RESEARCH IN TECHNOLOGY359
Table-6: Signal to Noise Ratios for Various Parameters-(Smalle r-is-better)
S.N. Ra S/N F-1
1 0.56 5.036239 152.56
2 0.57 4.882503 217.73
3 0.63 4.013189 309.23
4 0.82 1.723723 179.85
5 0.84 1.514414 249.23
6 0.89 1.0122 329.56
7 0.98 0.175478 191.24
8 1.03 -0.25674 277.62
9 1.24 -1.86843 392.42
10 0.51 5.848596 123.21
11 0.54 5.352125 196.25
12 0.53 5.514483 236.26
13 0.61 4.293403 131.85
14 0.64 3.876401 202.85
15 0.65 3.741733 239.52
16 0.82 1.723723 139.63
17 0.84 1.514414 228.41
18 0.85 1.411621 286.74
19 0.49 6.196078 103.54
20 0.51 5.848596 149.57
21 0.52 5.679933 193.47
22 0.59 4.58296 115.46
23 0.62 4.152166 175.54
24 0.6 4.436975 211.47
25 0.71 2.974833 126.78
26 0.73 2.733543 118.41
27 0.83 1.618438 264.47
Table 6.1: General Linear Model: F1 versus SS, FR & DC
Sour ce
DF Adj
SS
Adj M S
F P %
Contribu tion
SS 2 71.5
81
35.79 03
44.4 7
0.00 0
29.10%
FR 2 8.98
8
4.493 9
5.58 0.01
2
3.65%
DC 2 149.
272 74.63
60 92.7
4 0.00
0
60.69%
Resi dual error
20 16.0
96
0.804 8
6.54%
Total 26 245.
937
S = 0.8971 R-Sq = 93.5% R-Sq (adj) = 91.5%
3. RESULTS
Fig. 9.0.1: Main Effect Plot for SN Ratios Corresponding to F1
The results acquired from the respective tables 6 & 6.1 are as follows:
It can be seen from the Tables 6 & 6.1; Spindle speed, Feed rate and Depth of cut all appear to significantly affecting the values of force signal i.e. F1. Each factor has their effect on the force amplitude in different manner explored from the results.
As seen from the Table 6.1, the amplitude of force i.e. F1 is strongly affected by Depth of cut because from the ANOVA table DC has highest F-value (92.74) which is much greater than four indicating its strong level of significance. Spindle speed and feed rate also have their significant effect on F1 because their F- values are more than four. This model has the coefficient of determination (R-Sq) of 93.5%, which also indicates a strong relationship between the significant factors and response and shows that model fit on higher side of acceptable limit because value of R2 is more than 90%.
4 CONCLUSION
Finally, the following conclusions may be drawn for full factorial design of experiment:
IJIRT 145288
INTERNATIONAL JO URNAL OF INNOVATIVE RESEARCH IN TECHNOLOGY360
The full factorial run is proven to be a best choice because it involves all the possible combination of parameter values and gives minimum error rate hence shows accuracy of the experimental setup and statistical model and roughness values can be predicted up to close level of accuracy and precision.
While analyzing the force signals using ANOVA technique, F1 is proven to be strongly affected by all the cutting parameters
Depth of cut is highly affecting parameter which affects F1 Thus, to minimize the values of force signals DC should be set to its precise value.
REFERENCES
[1] Chelladurai H., Jain V.K., Vyas N.S.,
Development of cutting tool condition
monitoring system for high speed turning operation by vibration and strain analysis. Int J. of AdvManufTechnol, Springer 37 (2008) 471-485.
[2] Kriby D.E, Zhang Z., Chen J.C. Development of an accelerometer-based surface roughness prediction system in turning operations using multiple regression techniques. J. of IndTechnol 20(4) (2004) 1–8.
[3] AzouziR.and GuillotM.,On-line prediction of surface finish and dimensional deviation in turning using neural network based sensor fusion.Int.J.Mach.ToolsManufact.,37:
(1997)1201-1217.DOI:10.1016/S0890-6955(97)00013-8
[4] Abouelatta O.B. and Madl J., Surface roughness prediction based on cutting parameters and tool vibrationsinturningoperations.J.Mater.Process.Te chnol.,118(2001)269-277.DOI:10.1016/S0924-0136(01)00959-1
[5] Sundaram,S.,SenthikumarP.andManoharanN.,St udyofacousticemissionsensortechniquesformonit oringmachiningprocesses.J.Eng.AppliedSci.,2(20 07)1581-1586.
[6] BenardosP.G. and Vosniakos G.C., Predicting surface roughness in machining: Areview. Int.J.Mach.Tools Manufact.,43:(2003) 833844. [7] ParkS.H.,Robust design and analysis for quality
engineering,Chapman&Hall,London,1996.
[8] Ghani J.A.,ChoudhuryI.A.,Hassan
H.H.,“ApplicationofTaguchimethodintheoptimiz ationofendmillingparameter”,J.ofMate.Processin gTechnol.,145,(2004),pp.84– 92.
[9] KopacJ.,KrajnikP.,“Robustdesignofflankmillingp
arametersbasedongrey-Taguchimethod”,J.ofMate.ProcessingTechnol.,1 91,(2007),pp.400– 403.
[10]BendellT.,Taguchimethods,in:ProceedingsoftheE uropeanConferenceonTaguchiMethod,Elsevier,A msterdam (1988)
[11]JulieZ.Zhang,Chen J.C.,KirbyE.D.,“Surface
roughness optimization in
anend-millingoperationusingtheTaguchidesignmethod”, J.ofMate.ProcessingTechnol.,
184,(2007),pp.233–239.
[12]KuramE.,SimsekB.T.,OzcelikB.,DemirbasE.,and AskinS.“Optimizationofthecuttingfluidsandpara metersusingTaguchiandANOVAinmilling”Worl dCongressonEngineering,2,(2010),pp.978-988 [13]Berger P.D. and Maurer R.E., Experimental
design with applications in management,
engineering and the
sciences.1stEdn.,DuxburyPress,USA.,(2001)ISB N:10:0534358225,pp:496.
[14]Henderson G.R., 2006. Six Sigma:
QualityimprovementwithMINITAB.JohnWileya ndSons,England,ISBN:10:0470011556,pp:452 [15]Sundaram R.M., Lambert B.K., Mathematical
model to predict surface finish in fine turning of steel, Part-I. Int. J. of Prod. Research 19. (1981). 547-556
[16]Sundaram R.M., Lambert B.K., Mathematical model to predict surface finish in fine turning of steel, Part-I. Int. J. of Prod. Research 19. (1981). 547-556
![Table 1: Mechanical Properties of Mild Steel Alloy [52]](https://thumb-us.123doks.com/thumbv2/123dok_us/1394700.1651006/3.612.72.290.252.542/table-mechanical-properties-mild-steel-alloy.webp)