International Journal of Advanced Engineering Research and Applications May – 2015
www.ijaera.org 1
Optimization of Thrust Force and Material Removal Rate in Turning EN-16
Steel Alloy using Taguchi Approach
Vijay Kumar
M. Tech. Scholar, Department of Mechanical Engineering University Institute of Engineering & Technology, Kurukshetra
Kurukshetra University, Kurukshetra - 136119, INDIA E-mail: [email protected]
Abstract: The selection of optimal cutting parameters in turning operation is very important to achieve high cutting performance. This paper deals with the optimization of performance characteristics of turning EN-16 steel alloy using tungsten carbide inserts by Taguchi approach. The experiments were performed on the basis of an L-18 orthogonal array given by Taguchi’s parameter design approach. The performance characteristics such as thrust force and Material Removal Rate (MRR) are optimized with the optimal combination of cutting parameters such as nose radius, cutting speed, feed rate and depth of cut. Analysis of variance (ANOVA) is applied to identify the most significant factor using MINITAB-16 software. The cutting parameters are varied to observe the effects on performance characteristics and find the optimal results. Finally, confirmation tests are performed to verify the experimental results. The results from the confirmation tests proved that the performance characteristics such as thrust force and MRR are improved simultaneously through optimal combination of process parameters obtained from Taguchi approach.
Keywords: EN-16 steel alloy, cutting parameters, turning, thrust force and material removal rate, taguchi approach
I. INTRODUCTION
www.ijaera.org 2
turning SCM 440 alloy steel. Aggarwal [3] present the findings of an experimental investigation into the effects of cutting speed, feed rate, and depth of cut, nose radius and cutting environment in CNC turning of AISI P-20 tool steel. Gopalsamy et al [4] investigating the application of Taguchi method for parametric optimization of hard machining while machining hardened steel using L18 orthogonal array was used to design the experiments (machining parameters: cutting speed, feed, depth of cut, length of cut) with consideration of surface finish and tool life as response variable. Jaswin and Mohan Lal [5] investigated the optimization of deep cryogenic treatment for EN 52 valve steel using Taguchi method in combination with Grey relational analysis. The factors considered for the optimization are the cooling rate, soaking temperature, soaking period and tempering temperature, each at three different levels. Babu et al [6] studied that amongst the most critical quality measures that define the product quality surface roughness plays a vital role. This study has attempted in developing an empirical second order model for the predicting the surface roughness in machining EN24 alloy steel using RSM. Abhang and Hameedullah [7] optimized the multi-criteria problems because it is a great need of producers to produce precision parts with low costs. Optimization of multi-performance characteristics is more complex compared to optimization of single-performance characteristics. Rajyalakshmi [8] addressed an effective approach, Taguchi grey relational analysis, has been applied to experimental results of WEDM on Inconel 825 with consideration of multiple response measures. Saraswat [9]studied that the main objective of today's manufacturing industries is to produce low cost, high quality products in short time. The selection of optimal cutting parameters is a very important issue for every machining process in order to enhance the quality of machining products and reduce the machining costs. The performance characteristics in turning operation have been optimized for various work materials like EN-31, EN-24, EN-8, AISI P20 steel and some super alloys. An attempt is made to optimize the thrust force and material removal rate in turning EN-16 steel alloy using Taguchi approach.
II. EXPERMINTAL DETAILS
A. Experimental Conditions and Planning of Experiment
The experiments are performed, on the basis of L18 standard orthogonal array design with four process parameters namely nose radius, cutting speed, feed rate and depth of cut for two performance characteristics (thrust force and MRR). The experimental conditions on which the experiments are performed are given in table 1.
Table 1: Experimental conditions
Work piece EN- 16 Steel alloy
Workpiece
Composition
C= 0.30-0.40%, Si=0.10-0.35%,Mn=1.30-1.80% , Mo=0.20-0.35%, S=0.05%, P=0.05%
Environment Wet Cutting
Size (mm) Diameter = 26 mm and length =600 mm
Machine Tool HMT Lathe Machine
www.ijaera.org 3
Table 2: Process parameters and levels
Level Nose Radius (A),
mm
Cutting Speed (B), rpm
Feed Rate
(C),mm/rev
Depth of Cut
(D),mm
1 0.2 420 0.04 0.3
2 0.4 490 0.08 0.5
3 --- 540 0.12 0.7
Table 3: Representation of factors
Factor Nose Radius Spindle Speed Feed Rate Depth of Cut
Level 1 A1 B1 C1 1
Level 2 A2 B2 C2 2
Level 3 --- B3 C3 3
B. Selection of Orthogonal Array
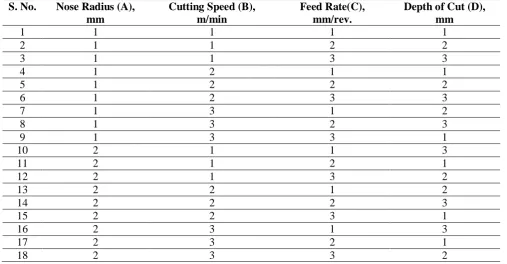
Taguchi’s design of experiments (DOE) methodology is used to plan the experiments statistically. To select an appropriate orthogonal array for the experiments, the total degrees of freedom need to be computed. In the present work, the nose radius has two levels of experiments so it has 1 degree of freedom (DOF) where as the other parameters have three levels so they have 2 DOF. Therefore, total degree of freedom = (1×1) + (3×2) = 7. Once the required degrees of freedom are known, the next step is to select an appropriate orthogonal array to fit specific task. In this study, an L18 orthogonal array with five columns and nineteen rows is used. The array has seventeen degrees of freedom and it can handle three level design parameters. Each cutting parameter is assigned to a column, eighteen cutting parameter combinations being available. The experimental layout for the four cutting parameters using the L18 orthogonal array is shown in table 4 as:
Table 4: Basic Taguchi's l18 orthogonal array
S. No. Nose Radius (A), mm
Cutting Speed (B), m/min
Feed Rate(C), mm/rev.
Depth of Cut (D), mm
1 1 1 1 1
2 1 1 2 2
3 1 1 3 3
4 1 2 1 1
5 1 2 2 2
6 1 2 3 3
7 1 3 1 2
8 1 3 2 3
9 1 3 3 1
10 2 1 1 3
11 2 1 2 1
12 2 1 3 2
13 2 2 1 2
14 2 2 2 3
15 2 2 3 1
16 2 3 1 3
17 2 3 2 1
www.ijaera.org 4
III. EXPERIMENTAL RESULTS
A. Thrust Force
After performing turning EN-16 steel alloy on lathe machine, the results are obtained for thrust force and material removal rate. A total (18×3) = 54 experiments are performed on lathe machine. Each experiment is performed thrice to obtain the mean values of response variables. Table 5 shows three readings R1, R2, R3 and mean value of thrust force for eighteen runs.
Table 5: Experimental results for thrust force
Exp. No. Thrust force (kg) Mean value (kg)
Reading1 Reading2 Reading3
1 6 8 7 7
2 13 15 11 13
3 28 24 26 26
4 4 6 5 5
5 11 13 9 11
6 29 27 25 27
7 14 10 12 12
8 21 18 24 21
9 13 12 11 12
10 14 18 16 16
11 13 12 11 12
12 19 18 20 19
13 15 13 11 13
14 19 25 22 22
15 15 17 13 15
16 13 11 15 13
17 9 8 10 9
18 13 15 14 14
The mean values are used in MINITAB-16 to observe the effects of process parameter (nose radius, cutting speed, feed rate and depth of cut) on response variables such as thrust force and MRR.
2 1
20.0 17.5 15.0 12.5 10.0
3 2
1
3 2
1 20.0 17.5
15.0 12.5 10.0
3 2
1 A
M
ea
n
of
M
ea
ns
B
C D
Main Effects Plot for Means Data Means
www.ijaera.org 5
Table 6: Response table of means for thrust force
Level Nose radius (A) Cutting speed (B) Feed rate (C) Depth of cut (D)
1 14.89 15.50 11.00 10.00
2 14.78 15.50 14.67 13.67
3 --- 13.50 18.83 20.83
Delta 0.11 2.00 7.83 10.83
Rank 4 3 2 1
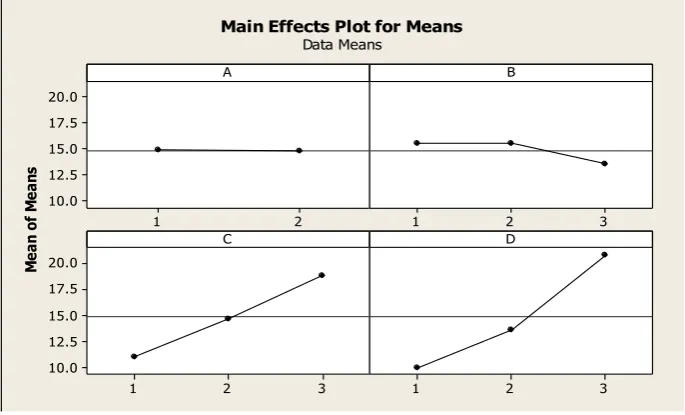
Figure 2 and table 6 show the effect of process parameters on the thrust force at different levels and it can be noticed that:
a) There is negligible change in thrust force, when nose radius changes from level 1 to 2.
b) Thrust force is constant when cutting speed changes from level 1 to 2. But significantly decreases, when speed changes from level 2 to 3.
c) As the feed rate and depth of cut increases from level 1 to 3, thrust force also increases significantly.
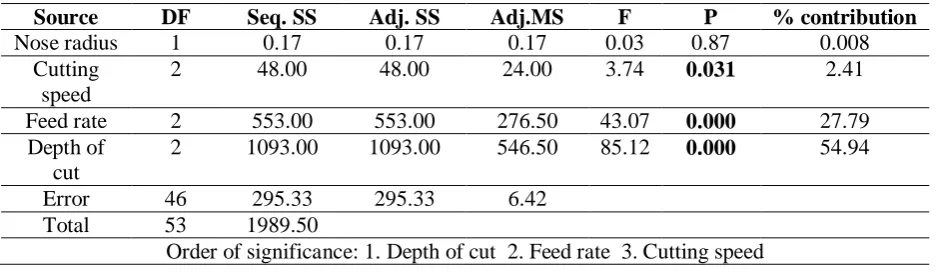
Table 7: ANOVA result for thrust force (raw data)
Source DF Seq. SS Adj. SS Adj.MS F P % contribution
Nose radius 1 0.17 0.17 0.17 0.03 0.87 0.008
Cutting speed
2 48.00 48.00 24.00 3.74 0.031 2.41
Feed rate 2 553.00 553.00 276.50 43.07 0.000 27.79 Depth of
cut
2 1093.00 1093.00 546.50 85.12 0.000 54.94
Error 46 295.33 295.33 6.42 Total 53 1989.50
Order of significance: 1. Depth of cut 2. Feed rate 3. Cutting speed
DF= degree of freedom; SS= sum of squares; MS= mean squares (variance); F= ratio of variance to variance error
Table 7 gives the significant variables. In table 7, the value of P indicates the significant or insignificant variables. If the value of P is less than 0.05 or near about 0.05, means the variable is significant otherwise insignificant. It is clear from the ANOVA table that depth of cut is the most significant parameter for thrust force. Among the four process parameters, depth of cut is the largest i.e. the contribution of depth of cut is 54.94% so it is highly significant factor. The contribution of feed rate is 27.79 % so it is less significant factor as compare to depth of cut. The contribution of cutting speed and nose radius are 2.41 and 0.008% so they are less significant factor as compared to depth of cut and feed rate.
B. Material Removal Rate
Table 8: Experimental results for MRR
Exp. No. MRR (g/sec.) Mean value
(g/sec.)
Reading1 Reading2 Reading3
1 2.656 2.000 3.343 2.666
2 2.676 3.383 2.000 2.686
3 5.373 4.687 4.042 4.704
4 1.697 2.020 2.383 2.033
5 4.687 4.043 3.387 4.042
6 3.000 3.669 4.833 3.834
7 2.021 3.383 2.650 2.685
www.ijaera.org 6
8 4.041 4.669 4.388 4.366
9 1.689 3.039 2.633 2.454
10 4.031 4.363 5.647 4.680
11 1.387 2.104 2.467 1.986
12 4.063 2.667 3.443 3.391
13 4.567 3.283 4.123 3.991
14 4.669 4.073 5.123 4.622
15 1.707 2.860 2.000 2.189
16 4.000 2.767 3.533 3.433
17 2.403 2.707 2.037 2.382
18 4.051 2.680 3.412 3.381
Table 9: Response table for means for MRR
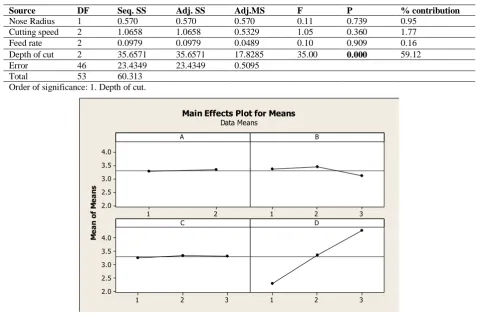
Figure 3 and table 9 shows the effects of process parameters on the MRR and it can be noticed that depth of cut is the main influencing process factor for MRR. MRR increases as the depth of cut increases from level 1 to 3. From the ANOVA table 10 it is clear that D3 is the optimal parameter setting for the MRR. The contribution of depth of cut is 59.12% so; it is most significant factor than nose radius, cutting speed and feed rate.
Table 10: ANOVA result for MRR (raw data)
2 1 4.0 3.5 3.0 2.5 2.0 3 2 1 3 2 1 4.0 3.5 3.0 2.5 2.0 3 2 1 A M e a n o f M e a n s B C D
Main Effects Plot for Means Data Means
Figure 3: Effect of process parameters on material removal rate (larger the better)
Level Nose radius Cutting speed Feed rate Depth of cut
1 3.275 3.352 3.248 2.285
2 3.340 3.452 3.347 3.363
3 --- 3.117 3.325 4.273
Delta 0.065 0.335 0.099 1.988
Rank 4 2 3 1
Source DF Seq. SS Adj. SS Adj.MS F P % contribution
Nose Radius 1 0.570 0.570 0.570 0.11 0.739 0.95
Cutting speed 2 1.0658 1.0658 0.5329 1.05 0.360 1.77
Feed rate 2 0.0979 0.0979 0.0489 0.10 0.909 0.16
Depth of cut 2 35.6571 35.6571 17.8285 35.00 0.000 59.12
Error 46 23.4349 23.4349 0.5095
Total 53 60.313
www.ijaera.org 7
C. Prediction of mean and confidence interval
Prediction of mean and confidence interval are two methods for finding out the optimal results. The estimate of the mean (µ) is only a point estimate based on the average of results obtains from the experiment. In other words, the confidence interval (CI) is a maximum and minimum value between which the true average should fall at some stated percentage of confidence. The Taguchi approach for predicting the mean performance characteristics and determination of confidence interval for the predicted mean has been applied. For the optimum value of various parameters the predicted value is always greater than the value of confidence interval. Prediction of mean for Thrust force (µTF): The optimum combination of process parameters for thrust force is B3 C1 D1
Hence,
µTF = TF + (B3-TF) + (C1-TF) + (D1-TF)
µTF = Prediction of mean
TF = 14.833; average value of thrust force
B3 C1 D1 is the value of different input parameters at which thrust force is optimum.
µTF = 4.834
Now, calculate the confidence interval:
C.I. = √ (Fa(1,fe)Ve⌈1/neff+1/R⌉ )
Where Fa (1, fe) = 4.0157; the F ratio at a confidence level of degree of freedom 1 and its value is constant
Ve = 6.42; an error in the ANOVA table in (adjMS) column (variance error)
neff = N / (1+total degree of freedom associated in the estimate of mean) = 54/(1+7)= 6.75
N = 54; total no. of results
R = 3; total no. of repetition
C.I. = 3.52
The confidence interval of the predicted optimal thrust force is:
[µTF – CI] < µTF < [µTF + CI]
[4.834 – 3.52] < µTF < [4.834 + 3.52]
1.314 < µTF (kg) < 8.354
Prediction of mean for MRR (µTmrr):
The optimum combination of various parameters for mrr is D3
www.ijaera.org 8
Now, calculate the confidence interval: C.I. = .9922
The confidence interval of the predicted optimal material removal rate (mrr) is:
[µTmrr – CI] < µTmrr < [µTmrr + CI]
[4.273 – 0.9922] < µRF < [4.273 + 0.9922]
3.281 < µTmrr < 5.265
In case of MRR, variation of nose radius and feed rate do not affect the material removal rate. Only depth of cut plays a significant role in case of material removal rate in turning EN-16 alloy steel. Hence, the value of CI is less than predicted mean so, the optimum values are right.
IV. CONFIRMATION EXPERIMENTS
This investigation recommends the optimal level of parameters on which three confirmations experiment have been performed. The actual mean value of all response variables lies between the confidence interval of the predicted mean value of response variables respectively as shown in table 11. Therefore, the performance characteristics in turning EN-16 steel alloy can be improved by given below optimal setting of process parameters.
Table 11: Conformation experiments
Response Optimum value setting Predicted mean value Actual mean value
Thrust force A2B3C1D1 4.834 5.347
MRR A2B2C2D3 4.273 4.667
V. CONCLUSIONS
The following conclusions can be drawn based on the experimental results of this study:
a) It is found that the parameter design of the Taguchi method provides a simple, systematic and efficient methodology for the optimization of the machining parameters.
b) Feed rate and depth of cut are the main parameters among the four controllable factors (nose radius, cutting speed, feed rate and depth of cut) that influence the thrust force significantly in turning EN-16 steel alloy. Also from ANOVA, B3C1D1 are the optimal parameter setting for thrust force.
c) Depth of cut at level 3, D3 i.e. (0.7) is recommended to obtain the maximum MRR.
VI. REFERENCES
[1] Ross, P. J. (1988). Taguchi techniques for quality engineering, 2nd edition, McGraw-Hill.
[2] S. Thamizhmanii, S. Saparudin, & S. Hasan (2007). Analysis of surface roughness by turning process using Taguchi method, Journal of Advancement in Material and Manufacturing Engg., Vol. 20, pp. 503-506.
www.ijaera.org 9
[4] Gopalsamy, B. M., Mondal, B., & Ghosh, S. (2009). Taguchi method and ANOVA: An approach for process parameters optimization of hard machining while machining hardened steel. Journal of Scientific & Industrial Research, 68(8), 686-695.
[5] Arockia Jaswin, M., & Mohan Lal, D. (2010). Optimization of the cryogenic treatment process for En 52 valve steel using the Grey-Taguchi method. Materials and Manufacturing Processes, 25(8), 842-850.
[6] Babu, V. S., Kumar, S. S., Murali, R. V., & Rao, M. M. (2011). Investigation and validation of optimal cutting parameters for least surface roughness in EN24 with response surface method. International Journal of Engineering, Science and Technology, 3(6), 146-160.
[7] Abhang, L. B., & Hameedullah, M. (2012). Determination of optimum parameters for multi-performance characteristics in turning by using grey relational analysis. The International Journal of Advanced Manufacturing Technology, 63(1-4), 13-24.
[8] Rajyalakshmi, G., & Ramaiah, P. V. (2013). Multiple process parameter optimization of wire electrical discharge machining on Inconel 825 using Taguchi grey relational analysis. The International Journal of Advanced Manufacturing Technology, 69(5-8), 1249-1262.
[9] Saraswat, N., Yadav, A., Kumar, A., & Srivastava, B. (2014). Optimization of Cutting Parameters in Turning Operation of Mild Steel. Int. Rev. Appl. Eng. Res, 4, 251-256.