Copyright 8 1996 by the Genetics Society of America
Quantitative Genetics
of
Transgenic Mice: Components
of
Phenotypic
Variation
in
Body Weights
and
Weight
Gains
A.
C.
Clutter,* D.
Pomp*"
and
J.
D. Murray'
*Department of Animal Science, Oklahoma State University, Stillwater, Oklahoma 74078-0425 and $Department
of Animal Science and Department of Population Health and Reproduction, School of Vetm'naly Medicine, University of California, Davis, Cali$ornia 9561 6-8521
Manuscript received January 17, 1996
Accepted for publication May 16, 1996
ABSTRACT
Transgenic mice possessing an ovine growth hormone gene were used to study the effects of elevated growth hormone on quantitative genetic variation. Males hemizygous for the transgene were mated to wild-type females to produce half- and full-sib families in which approximately half the progeny were transgenic and half were wild type. Analyses of body weights at 3-10 weeks, and weight gains from 3 to
6, and 6 to 10 weeks produced estimates of the proportion of total variance due to additive genetic effects (h') and common litter effects (c'), and the genetic correlation between transgenic and wild- type expression of each trait. At 10 weeks, body weight of transgenics exceeded that of wild types by 26
and 49% in males and females, respectively. Estimated genetic variances in the transgenic group were
significantly greater than zero for body weights at most ages and for both measurements of gain. Common litter effects accounted for a similar proportion of variation in the wild-type and transgenic groups.
Additive genetic correlations between wild-type and transgenic expression of body weights tended to decline with age, indicating that a partially different array of genes may have begun to affect body weight in the transgenic group.
I
N
recent years, alarge
body of work with transgenic mice, sheep and pigs(PALMITER
et
al.
1982;PURSEL
et al.
1990;NANCARROW
et al.
1991; POMPet
al.
1992) has revealed that the effects of growth hormone trans- genes on various metabolic and developmental pro- cesses may have great potential value in livestock pro- duction applications. Exogenous treatments with growth hormone have also been developed to improve the efficiency of dairy, beef, and pork production(KOP-
CHICK and CIOFFI 1991).Coinciding with these technological developments, livestock industries have continued to pursue the largely untapped economic benefits available through traditional genetic selection for quantitative perfor- mance traits.
As
gene transfer and exogenous growth factor treatment become part of livestock production, optimization of these technologies in national genetic evaluation programs is vital. Simulation of dairy produc- tion in a system that includes exogenous treatments with growth hormone revealed scenarios in which tradi- tional genetic evaluations may be significantly biased(BURNSIDE
andMEYER
1988). The heritability of perfor- mance characteristics under the influence of a transgene or exogenous treatment, and the genetic cor- relation of performance with and without such influ- ences are examples of parameters necessary to incorpo-Curresponding author: Archie C. Clutter, Department of Animal Sci- ence, Oklahoma State University, 206 ANSI, Stillwater, OK 7407% 0425. E-mail: [email protected]
'
Present address: University of Nebraska, Lincoln, NE 68504.Genetics 143: 1753-1760 (August, 1996)
rate these practices into genetic evaluation programs. Unfortunately, estimates of these parameters have not been reported.
Changes in estimates of genetic parameters resulting from elevated growth hormone are also
of
interest from a basic quantitative genetics perspective, as they reflect changes in the expression of genes involved in the poly- genic control of a trait. The effects of environmental influences on genetic variances have been widely stud- ied in plants (ST. CWR and ~ A M S 1991;WESSEL-BEA-
VER andSCOTT
1992;Row
andBRINK
1993) and insects(GEBHARDT
and STEARNS 1992; Asp1 and HOIKKAL,A 1993), and the study of ontogenetic changes in genetic variation is well documented(ATCHLEY
andRUTLEDCE
1980;
CHEVERUD
et al.
1983;ATCHLEY
1984, 1987), but the effects of transgene expression on components of quantitative variation are essentially unknown.Thus, we conducted an investigation of the effect of elevated growth hormone level on components
of
pheno- typic variation in growth traits using transgenic miceas
a model. The specific objective of the present studywas
to determine if elevated growth hormone via a transgene affects the components of variation in growth. Hypothe- ses were that(1)
significant additive variation in growth remains when growth hormone is elevated,(2)
patterns of ontogenetic changes in variance components are af- fected by elevated growth hormone, and(3)
the assort- ment of genes affecting growth traits is changed by ele- vated growth hormone. Implications for livestock genetic1754 A. C. Clutter, D. Pomp and J. D. Murray
MATERIALS AND METHODS
Mice ( M G l O l ) possessing a sheep growth hormone transgene driven by a sheep la-metallothionein promoter
(oMTla-oGH; SHANAHAN et al. 1989) exhibit dramatically in- creased growth and have proven to be an excellent model for study of the effects of increased growth hormone on a variety of metabolic and developmental processes (OBERBAUER et al.
1992; POMP et al. 1992). Growth hormone overexpression in
oMTla-oGH is almost fully inducible and retractable by the provision or removal of zinc in the drinking water (SHANAHAN et al. 1989). All other metallothioneingrowth hormone con- structs that have been reported result in elevated basal levels of growth hormone from neonate periods through adult- hood, even in the absence of exogenous heavy metal induc- tion. The high level of control of the oMTla-oGH transgene, along with the ability to identify oMTla-oGH transgenic mice at early preweaning ages (POMP and MURRAY 1991), enable controlled studies of the effects of growth hormone in mice from weaning through adult periods.
Mating design and animal husbandry: A variation of a classi- cal mating design optimized for estimation of genetic parame- ters was adopted for the present study. Based on the capacity of the animal facility, the optimum number and size of fami- lies was determined for traits with moderate heritability using methods described by FALCONER (1989). Full- and half-sib families were produced by mating MGlOl males proven to be hemizygous for oMTla-oGH with females from a four-strain composite (Harlan Sprague Dawley NIH X Harlan Sprague Dawley ICR X Charles River CF-1 X Charles River CFW) ob- tained from the University of Nebraska-Lincoln. Forty-three males were sampled from the MGlOl population at the Uni- versity of California-Davis and each mated in the laboratory at Oklahoma State University to an average of 3.14 females. The females were from the early generations of a study of divergent selection for heat production (M. K. NIELSEN, per- sonal communication) and were cross-classified by selection line (high, low, and control) when assigned to mating cages. Due to space constraints, the design was implemented in two consecutive replicates. Each male was placed in a mating cage with four females; after 2 weeks females were placed in individ- ual litter cages. At birth, litters were standardized to 10 pups. Pups were toe-notched for identification at 10 days of age and characterized for presence of the transgene by PCR of toe- clip lysate (POMP and MURRAY 1991). The expectation for progeny of these matings was 1/2 hemizygous for the transgene (transgenic genotype) and 1 / 2 homozygous wild- type (control genotype). Pups were weaned at 21 days of age; females were randomly caged in groups of five, and males were caged by genotype in full-sib pairs. Ad libitum access to feed (Purina Laboratory Chow 5001) and water were pro- vided, Beginning at weaning all mice received 25 mM zinc sulfate through the drinking water, an amount sufficient to stimulate expression of the transgene through the metallo- thionein-la promoter. Room temperature was maintained at 23" and a 12L:12D photoperiod used.
Data collection and statistical analyses: Growth traits were measured on a total of 1237 male and female progeny. Mice were weighed weekly from weaning to 10 weeks of age. To characterize growth in the transgenic and wild-type progeny, the following logistic function (KOOPS 1986) was fitted to body weight data for each mouse:
yt = a ( l
+
tanh (b(t - d) ) ),where yt is the weight at age t, a is one-half the upper asymp- totic value of y, b is the growth rate relative to a, and d is the age at the inflection point.
Weights were regressed on the function for each animal using the NONLIN procedure of SAS (1988). As suggested
by KOOPS and GROSSMAN (1991), each animal was assigned a value of 0 for body weight at the time of conception (yt = 0
at t = -3, assuming a %week gestation). Resulting parameter estimates for each animal were subjected to least-squares anal- ysis with a model that included the effects of genotype
(transgenic or wild type), sex and the genotype X sex interac- tion. Growth curves were derived from subclass means from the least-squares analysis, and subclass means for parameter estimates were contrasted with t-tests.
Components of variance for body weights at 3-10 weeks, and weight gains from 3-6 weeks and 6-10 weeks were esti- mated using an algorithm for multiple-trait derivative-free re- stricted maximum likelihood (MTDFREML; BOLDMAN and VAN VLECK 1991). Two sets of analyses were performed: (1) univariate analysis of each trait by genotype group and (2) bivariate analyses in which each weight or weight gain was treated as a different trait for transgenic and wild-type prog- eny (e.g., &week weight for transgenics and for wild types defined as the two traits in a bivariate analysis). Each set of analyses provided estimates of the proportion of total (pheno- typic) variance due to additive genetic effects (h'), common litter effects (c'), and residual environmental effects (e') in each genotypic group; the bivariate analyses also produced an estimate of the genetic correlation between transgenic and wild-type expression of each trait.
The model used for all traits in both the univariate and bivariate analyses included the fixed effects of replicate and sex, random additive genetic effects of animal, and random effects due to litter. In matrix notation, the bivariate model was
y = Xb
+
Z,a+
Z21+
e,where y is the vector of observations sorted by trait; b is the vector of fixed effects, replicate and sex; a is the vector of random additive genetic effects of animals; 1 is the vector of random litter effects; e is the vector of random residual ef- fects; and X, Z,, and Z2 are known incidence matrices. Addi- tionally, E(y) =
Xb,
and the assumed variance/covariance structures for random effects wereV(a) = A*G,
V(l) = I,*L, and
V(e) = I.*R,
where G , L, and R are 2 X 2 variance/covariance matrices for additive genetic, common litter, and random residual effects, respectively, and
*
denotes the direct matrix product. A is the numerator relationship matrix among all animals (progeny with records, and parents and ancestors without records), andI, and I, are identity matrices. For bivariate analyses in which animals only had a record for one or the other of the two traits, the offdiagonal elements of R were zero.
Some potential sources of bias should be noted. (1) Compo- nents of variance due to dominance and epistasis were as- sumed to be zero. MILLER et al. (1963) reported that these sources of variation were negligible for postweaning body weights in mice.
(2)
In general, maximum likelihood esti- mates are well-suited for unbalanced designs but can only assume values within the parameter space. Consequently, the estimates are easy to interpret but inherently biased. (3) Esti- mates of genetic parameters in the present analyses are based on records of progeny from an F1 cross of diverse parental stock, thus are potentially biased due to linkage disequilib- rium. However, if only additive effects are assumed, the d i s equilibrium effect can be plus or minus for each pair of loci and may tend toward zero when summed across all loci.Quantitative Variation in Mice
TABLE 1
Parameter estimates for logistic functions of growth in genotype X sex subclasses
Parameter"
Genotype Sex n a b d
Transgenic Male 302 19.61 2 0.11 0.27 2 .005 4.27 +- 0.03
Female 247 18.76 +- 0.13 0.28 ? ,005 4.25 2 0.03
Control Male 395 14.53 2 0.10 0.42 2 .004 3.19 2 0.03
Female 293 11.83 2 0.12 0.39 2 .005 2.90 2 0.03
1755
"a, one-half the upper asymptotic value of body weight " I _ (g); b, growth rate relative to a; d, age at the inflection point (week).
trait was analyzed as both a raw measurement and after log transformation (logarithms to base 10) in an attempt to un- couple variance and mean (ATCHLEY 1984). In all analyses, relationships among animals with records through the half- and full-sib mating design, and those among sires and among dams through ancestors traced back two generations were accounted for in the relationship matrix.
MTDFREML is an iterative procedure and convergence was assumed at the round of iteration at which the variance of log likelihood evaluations was 1 X lo-' or less. At least three restarts using estimates at previous convergence were per- formed for each analysis to help ensure that a global rather than a local maximum of the likelihood function had been reached.
In general, algorithms for derivative-free REML do not pro- vide estimates of sampling errors as a byproduct, and alterna- tive approximations of errors were not available in the MTDFREML program package. Methods that fit a polynomial function to the likelihood surface have been developed to approximate standard errors and confidence intervals for pa- rameter estimates from derivative-free REML (MEYER and HILL 1992), but the procedures can be computationally de- manding and may produce unacceptable results for specific models and unbalanced data.
As an alternative, we chose to use information available with the MTDFREML programs to evaluate some relatively simple hypotheses with likelihood ratio tests (KENDALL and STUART 1979; SHAW 1987, 1991). These tests are intuitively straightfor- ward, the test statistic based on the difference between the value of the log likelihood under the conditions of the null hypothesis and the (unconditional) maximum value of the log likelihood, and are possible without characterization of the likelihood sur- face. Results from univariate analyses were used to determine the significance of additive genetic effects for each trait by com- paring the log likelihood for a model in which the additive genetic variance (V,) was constrained to zero (Lo) to the log likelihood for the unconstrained model
(L=).
The value of -2(h, - L,,,,) is asymptotically distributed asx'
with 1 degree of freedom (KENDALL and STUART 1979). The common litter effect was expected to capture one-half of the additive genetic variance in the constrained model. In that respect, the result was considered a conservative test of Ho: V, = 0. The hypothesis that the genetic correlation (r,) = 1.0 was tested for each of the bivariate analyses by comparing the log likelihood for a model in which r;, was constrained to -1.0 (0.99) to the log likelihood from the unconstrained model. These tests ad- dressed relevant hypotheses in the study and provided an indi- cation of the precision with which we were able to estimate genetic parameters.RESULTS AND DISCUSSION
Least-squares means for estimates of curve parame- ters are in Table
1
and the logistic growth curves for thetransgenic and wild-type (control) groups are plotted
by
sex in Figure1.
There was a genotype X sex interaction( P
<
0.01)
for each of the estimated parameters. Transgenics exhibited faster and more prolongedgrowth
( P
<
0.01),
but the effects were more pro- nounced in females than in males relative to controls. As a result, typical gender differences in growth were reducedby
the transgene. The period of most rapid growth ranged from-2.9
to3.2
weeks of age in the controls, but was4.25 weeks in the transgenics. At
10
weeks of age, transgenic males and females were26%
(36.4 us.
28.8
g)
and 49%(35.0
us. 23.5g)
heavier, respectively, than their wild-type contemporaries(P
<
0.01). Control micehad
stopped growingby
week10,
but transgenics only approached their predicted asymp- totic value of-38
g.
T h e overall effect of the transgene in the present study, as well as the interaction
of
the transgene with gender, is similar to results from a previous report ofMGl01
progeny from a different maternal genetic back- ground(POMP
etal.
1992). In studies
of
mice with hu- man and bovine growth hormone transgenes(KOOPS
andGROSSMAN
1991; EISEN
etal.
1993), transgene Xsex interactions were also reported. But in the latter study
(EISEN
et aZ. 1993), the transgene had a greater effect in males than in females.Estimates of phenotypic variances in unadjusted and log-adjusted body weights from 3 to
10
weeks of age are presented for the control group in Figure2
to show the effects of log transformation. The scales of the y axes are, thus, in different units, but are aligned for comparison of the relative ontogenetic patterns. Variances from unad- justed data increased from 3 to 4 weeks of age, decreased slightly from 4 to6
weeks, and increased linearly thereaf- ter. For log-adjusted data, the variance increased from3
to4
weeks, decreased to6
weeks and then remained relatively constant. The pattern of change for log-adjusted data is similar to reports of various other mouse popula- tions when data were log-adjusted (ATCHLEY 1984) and indicates that much of the effect of scaling o n the variance has been alleviated by the transformation. Therefore, the remainder of the present report will include only results from log-transformed analyses.1756 A. C. Clutter, D. Pomp and J. D. Murray
-m- TG.males
-0- TG.females
A CL.males
-v- CL.females
-- A
I O
!
I3 4 5 6 7
s
Week of Age
and e2) from the univariate analyses are presented in Table 2; estimates of the same components from the bivariate analyses are presented in Table 3. Estimates of corresponding variance components and patterns in changes of components with ontogeny were generally similar for univariate and bivariate analyses. The great- est difference was for additive genetic variance and cor- responding
h2
at 3 weeks of age. Figures 3 and4
depict ontogenetic changes in estimates from bivariate analy- ses of weights through 10 weeks of age.Additive genetic variances were significant
( P
<
0.05)
or approached significance( P
<
0.10) for body weights at all ages in the control progeny, except for week4
and week 10. Corresponding estimates of heritabilities were similar to those from literature reports for pre-6 . 0
-
5.5
-
5.0
-
(u 0 c
cu
4
n .-
z
4.5-.- 0
4.0- c (u
iE
3.5 -
3.0 -
2.5
1
~
1
-a- unadjustedI
I
I
9 1 0
FIGURE 1.-Logistic growth curves of the transgenic (TG) and wild-type (CL) males and females. See Table 1 for growth curve parameters.
weaning and postweaning body weights (MALIK 1984). The estimated genetic variances for gains from 3 to
6
and6
to10
weeks in the control group were not differ- ent from zero, but the heritability for 3 to6
week gain from the bivariate analysis (0.23) was within the range of literature reports for the trait (MALIK 1984;EISEN
andPRASETYO
1988). Estimates of additive genetic vari- ances for body weights in the transgenic group were significant( P
<
0.05)
or tended to be significant( P
<
0.10)
at all ages except5
and 9 weeks, and for both measurements of gain.As previously discussed, the constrained univariate model applied in the likelihood ratio tests resulted in what was considered a conservative test of
Ho: V,
= 0, and measurement of the power of likelihood ratio tests1-m- logadjusted
1
FIGURE 2.-Estimates of phenotypic vari- ances in unadjusted (left) and log-adjusted (right) body weights for the control group. The scales of the y axes are in different units but are aligned for comparison.
2 4 6 8 10 2 6 8 10
Quantitative Variation in Mice 1757
TABLE 2
Estimates of variance components and proportions of total phenotypic variance from univariate analyses by genotype
Control Transgenic
Trait Of U: 0: h' C' e2 Uf Up
d
h' C2 e'3-wk weight 4 w k weight 5-wk weight 6 w k weight 7-wk weight 8-wk weight 9-wk weight 1@wk weight Gain 3-6 Gain 6- 10
7.68** 2.93 5.45+ 6.52** 5.16* 5.95* 4.47* 2.78 6.39 0.00
15.52 18.15 7.52 2.79 3.43 3.45 3.49 4.07 15.33 50.94
5.19 16.69 8.92 5.43 5.54 5.31 6.86 8.00 31.09 392.56
0.27 0.55 0.18 0.08 0.48 0.44 0.25 0.34 0.41 0.44 0.19 0.37 0.37 0.24 0.39 0.40 0.23 0.36 0.30 0.24 0.46 0.19 0.27 0.54 0.12 0.29 0.59 0.00 0.11 0.89
6.90** 8.51* 2.42 3.37t 4.59* 5.74* 3.87 7.34* 31.42** 99.76*
10.97 8.40 5.61 3.60 3.79 2.89 3.55 3.10 17.27 30.47
4.13 13.95 15.71 10.30 10.16 11.37 13.74 12.67 27.76 148.70
0.31 0.50 0.19 0.28 0.27 0.45 0.10 0.24 0.66 0.20 0.21 0.60 0.26 0.16 0.58 0.29 0.14 0.57 0.18 0.17 0.65 0.32 0.13 0.55 0.41 0.23 0.36 0.36 0.11 0.53
a:, additive genetic; a:, common litter; uz, residual; h', heritability; c', common litter; e', residual.
**
P
<
0.01; H,: u: = 0.*
P<
0.05; H,: a: = 0. P<
0.10; Ho: a,' = 0.through simulation has shown them to be generally conservative
(SHAW
1987).
Conversely, the error rates presented here may be somewhat underestimated due to the correlation among sequential weights. Given these considerations, all but three of the estimates of additive variance in the transgenic group were signifi- cant ata
=0.05,
and for 3-&week gain the estimate was significant at a relatively stringent criterion ( a =0.01).
To
our knowledge these are the first reported estimates of genetic variances and heritabilities in transgenic animals. For these traits of body size and growth, a significant amount of genetic variation ex- isted in the presence of prolonged elevated growth hor- mone via transgene expression.Differences in estimates of additive genetic variance and in the ontogenetic patterns of change in genetic variances for the control and transgenic groups (Figure
3)
were apparently within the rangeof
sampling error, except for perhaps the pattern from3
to4
weeks ofage. The greatest amount of genetic variance was at
3
weeks in the control group and at4
weeks in transgenics, corresponding with their respective peri- ods of greatest growth. Estimates of genetic variance in the control group declined greatly from3
to 4 weeks, then steadily through10
weeks, while estimates for transgenics increased from3
to 4 weeks and then tended to decline.ATCHLEY
(1984)
summarized several studies of the ontogeny of genetic parameters in nontransgenic mice and rats. He concluded that both additive genetic and phenotypic variances increased as growth accelerated, peaked at approximately the inflection point or period of maximum growth, then declined as the growth curve approached the asymptote. If the patterns in genetic variances for the control and transgenic groups were in fact different from3
to4
weeks, the difference may have been related to the later inflection point in the growth curves of the transgenic animals (Table1).
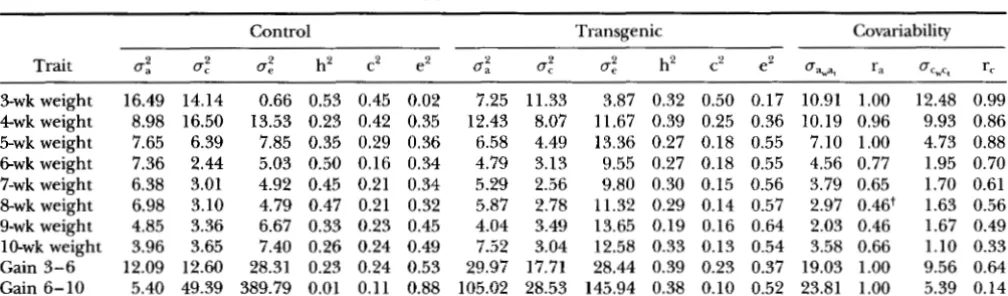
How-TABLE 3
Estimates of variances and covariances from bivariate analyses and corresponding proportions of phenotypic variance and correlations
Control Transgenic Covariability
Trait a: u: u: h' c2 e2 U: 0: uz h2 c' e2 uGa, ra ucs. r,
3-wk weight 16.49 14.14 0.66 0.53 0.45 0.02 7.25 11.33 3.87 0.32 0.50 0.17 10.91 1.00 12.48 0.99 4 w k weight 8.98 16.50 13.53 0.23 0.42 0.35 12.43 8.07 11.67 0.39 0.25 0.36 10.19 0.96 9.93 0.86 5-wkweight 7.65 6.39 7.85 0.35 0.29 0.36 6.58 4.49 13.36 0.27 0.18 0.55 7.10 1.00 4.73 0.88 6 w k weight 7.36 2.44 5.03 0.50 0.16 0.34 4.79 3.13 9.55 0.27 0.18 0.55 4.56 0.77 1.95 0.70 7-wk weight 6.38 3.01 4.92 0.45 0.21 0.34 5.29 2.56 9.80 0.30 0.15 0.56 3.79 0.65 1.70 0.61 8-wk weight 6.98 3.10 4.79 0.47 0.21 0.32 5.87 2.78 11.32 0.29 0.14 0.57 2.97 0.46t 1.63 0.56 9-wk weight 4.85 3.36 6.67 0.33 0.23 0.45 4.04 3.49 13.65 0.19 0.16 0.64 2.03 0.46 1.67 0.49 IO-wk weight 3.96 3.65 7.40 0.26 0.24 0.49 7.52 3.04 12.58 0.33 0.13 0.54 3.58 0.66 1.10 0.33 Gain 3-6 12.09 12.60 28.31 0.23 0.24 0.53 29.97 17.71 28.44 0.39 0.23 0.37 19.03 1.00 9.56 0.64 Gain 6-10 5.40 49.39 389.79 0.01 0.11 0.88 105.02 28.53 145.94 0.38 0.10 0.52 23.81 1.00 5.39 0.14
a:, additive genetic; u:, common litter; uz, residual; u-,, additive covariance between wild type (control) and transgenic;
uCwCr, common litter covariance between wild type (control) and transgenic; h2, heritability; c', common litter; e2, residual; r,, genetic correlation; rc, common litter correlation.
1758 A. C. Clutter, D. Pomp and J. D. Murray
-0- Transgenic
20
Additive Genetic
i
15
10
5
Week of Age
I
Residual
ever, the patterns
in phenotypic variances over
the same
age period were similar for the groups.
The corresponding ontogenetic changes in additive
genetic and phenotypic variances, as summarized by
ATCHLEY
(1984),
result in a relatively age-constant heri-
tability for body weight.
Fluctuations in heritabilities for
each group in the present study (Figure
4)
are likely
due to sampling and do not dispute the hypothesis of
a constant heritability, nor is there clear evidence of an
average difference in heritabilities between the groups.
There was, however, a tendency for the control group
to have a greater heritability for body weights from
5
1
Phenotypici
f
FIGURE 3.-Estimates of components ofvariance for log-adjusted body weights in the wild-type (control) and transgenic groups.
weeks through
9
weeks than transgenics. This result
may be due to larger, and apparently increasing, resid-
ual and phenotypic variances in the transgenic group.
Changes
withage in the variance due to common
litter effects were generally similar in the control and
transgenic groups (Figure
3).
The variance in the con-
trol group was nearly constant from
3
to
4
weeks of age,
while in transgenics the variance began to decline over
the same period, but there
was a general decline in
both groups
following weaning at
3
weeks. This variance
component reflects differences in maternal influences
between litters, and the pattern of decline agrees with
100
-
100-
h
0
a
"
3
c
8 0 - 80
-
80-
0
5
Additive Genetic Common Lltter Residual-I
m
-
e
Q 8 0 - 60-
60-FIGURE 4.-Proportion of total pheno- typic variance in log-adjusted body weights of wild-type (control) and transgenic groups due to additive genetic (h'), com- mon litter (c2) and residual environmental
m
u-
0
s
0 . I . I . , . , O . ~ n ~ . l . l~ o1 ' 1 . 1 . 1
2 4 6 8 1 0 2 4 6 8 1 0 2 4 6 8 1 0
Quantitative Variation in Mice 1759
1.0-
0.8
-
0.6
-
c 0.-
-
-
0-?!
5
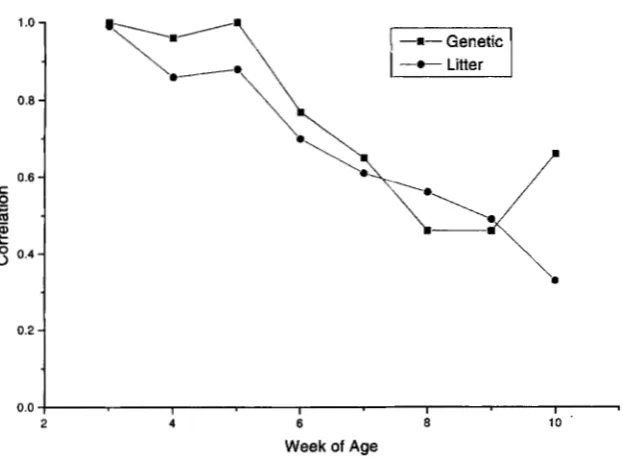
0.4-FIGURE 5.-Estimated additive genetic and common litter effect correlations between wild-type and transgenic log-adjusted body weights at each age.
2 4 6
e
Week of Age
several reports in the literature
(MOORE
etal.
1970; ATCHLEY and RUTLEDCE 1980; CHEVERUD etal.
1983; ATCHLEY 1984; COWLEY et al. 1989). However, COWLEYet
al.
(1989) also reported that maternal uterine envi- ronment continued to influence body weight through 9 weeks of age. It is important to note in the context of the present study that maternal influences on growth were a significant source of variation among transgenic animals and accounted for>lo%
of phenotypic vari- ance as late as 10 weeks (Figure 4).Estimates of the covariances between additive genetic effects and between common litter effects on each trait in transgenics and controls, along with corresponding correlations, are presented in Table
3.
The correlations for body weights are also plotted in Figure5 .
Both addi- tive genetic and common litter correlations displayed a pattern of decline with ontogeny from estimates of (approximately) 1.0 at3
weeks of age. The linear regres- sions of each correlation on week of age were -0.08( P
<
0.01) and -0.09( P
<
0.01) for additive genetic and common litter, respectively. However, among the ge- netic correlations, only the estimate at 8 weeks of age tended to be significantly different from 1.0( P <
0.10). Estimates of the genetic correlation between expression of gains in transgenics and controls were -1.0.The additive genetic correlation between body weight at a given age in control and transgenic animals measures the degree to which the same genes (or linked genes) affect expression of the trait in the two groups. Similarly, the common litter correlation measures the degree to which the same maternal factors influence body weight at a given age in transgenic and nontransgenic animals. The patterns of decline in both these correlations suggest that as the transgene is expressed over time, a Merent set of genes and of factors associated with maternal envi- ronment may begin to influence body weight.
Quantitative geneticists have long considered changes in additive genetic variance with ontogeny to be due to
10
the switching on and off, and temporal expression,
of
the various genes involved in developmental processes (ATCHLEY and RUTLEDCE 1980; ATCHLEY 1984). The in- crease in genetic variance associated with the period of most rapid growth, for example, has been attributed to expression of a greater number of genes (ATCHLEY and RUTLEDGE 1980). Changes in gene action may also occur with changes in the physiological environment. ROTHSCHILD et
al.
(1996) report a major effect on litter size in the pig associated with the estrogen receptor gene that is additive in the first parity but dominant in later parities. Recent applications of a saturated marker map of the mouse genome in segregating populations has resulted in identification of specific chromosomal regions associated with variation in body weight at various stages of develop ment(D.
POMP,
unpublished data).A
similar strategy us- ing a segregating population with and without the oMTla-oGH
transgene would allow identification of unique loci and changes in gene action that contribute to variation in body weight at different ages in an environmentof
elevated growth hormone.Results from the present study reveal several points with potential implications for scenarios of genetic improve- ment. The oMTla-oGHtransgene
has
a dramatic effect on growth rate and body size through physiological pathways (CHOW etal.
1994) that are likely large contributors to normal genetic variation(BLAIR
et al. 1989; CLUTTER et1760 A. C. Clutter, D. Pomp and J. D. Murray
(BURNSIDE
andMEYER
1988),
or in transgenics and non- transgenics may be necessary.Precise estimation of genetic parameters in experi- mental populations is difficult
(KOOTS
andGIBSON
1994),
and results of the present study provide onlyan
initial and general picture of genetic variation in transgenic animals. The recent application of growth hormone treatments in dairy cattle management will re- sult in data bases suited for the study of the effects of elevated growth hormone on genetic variances and co- variances for dairy traits. Further studyof
various con- structs in transgenic mouse populations with the aidof
molecular tools should provide a clearer picture of the specific interactions of transgenes with quantitative varia- tion. In summary, results from the present study indicate that overexpression of an important peptide such as growth hormone may alter the genetic controlof
growth, but that significant additive genetic variation remains.Approved for publication by the Director, Oklahoma Agricultural Experiment Station. The authors gratefully acknowledge Dr. M. K. NIEL
SEN for providing female mice for the mating design and D. BAILEY, B. GOOD, M. A. CUSHMAN, S. KEBE and T. C. CLUTTER for help with animal care and data collection. Thanks also to Drs. S. NEWMAN, L. D. VAN VLECK, C. P. VAN TASSELL, J. W. KEELE and M. K. NIELSEN for helpful discussions regarding data analysis, and two anonymous reviewers for comments on an earlier draft of the manuscript.
LITERATURE CITED
ASPI, J., and A. H O I W , 1993 Laboratory and natural heritabilities of male courtship song characters in Drosophila montana and D.
littoralis. Heredity 70: 400-406.
ATCHLEY, W. R., 1984 Ontogeny, timing of development, and ge- netic variance-covariance structure. Am. Nat. 123: 519-540. ATCHLEY, W. R., 1987 Developmental quantitative genetics and the
evolution of ontogenies. Evolution 41(2): 316-330.
ATCHLEY, W. R., and J. J. RUTLEDGE, 1980 Genetic components of size and shape. I. Dynamics of components of phenotypic vari- ability and covariability during ontogeny in the laboratory rat. Evolution 34(6): 1161-1173.
BLAIR, H. T., S. N. MCCUTCHEON, D. D. S. MACKENZIE, P. D. GLUCKMAN, J. E. ORMSBY et al., 1989 Responses to divergent selection for plasma concentrations of insulin-like growth factor- 1 in mice. Genet. Res. Camb. 53: 187-191.
BOLDMAN, K. G., and L. D. VAN VLECK, 1991 Derivative-free re- stricted maximum likelihood estimation in animal models with a sparse matrix solver. J. Dairy Sci. 7 4 4337-4343.
BURNSIDE, E. B., and K. MEYER, 1988 Potential impact of bovine somatotropin on dairy sire evaluation. J. Dairy Sci. 71: 2210-
2219.
CHEVERUD, J. M., L. J. LEAMY, W. R. ATCHLEYand J. J. RUTLEDGE, 1983 Quantitative genetics and the evolution on ontogeny. Genet. Res. Camb. 42: 65-75.
CHOW, J. C., J. D. MURRAY, D. POMP, R. L. BALDWIN, C. C. &VERT et
al., 1994 Regulation of insulin-like growth factor-I and binding protein-3 expression in oMTla-oGH transgenic mice. Transgen. Res. 3: 127-133.
CLUTTER, A. C., L. J. SPICER, M. D. WOLTMANN, R. W. GRIMES, J. M. HAMMOND et al., 1995 Plasma growth hormone, insulin-like growth factor 1, and insulin-like growth factor binding proteins in pigs with divergent genetic merit for postweaning average daily gain. J. Anim. Sci. 73: 1776-1783.
COWLEY, D. E., D. POMP, W. R. ATCHLEY, E. J. EISEN and D. HAWIUNS-
BROWN, 1989 The impact of maternal uterine genotype on post- natal growth and adult body size in mice. Genetics 122 193-203. EISEN, E. J., and H. PRASETYO, 1988 Estimates of genetic parameters
and predicted selection responses for growth, fat and lean traits in mice. J. Anim. Sci. 66: 1153-1165.
EISEN, E. J., M. FORTMAN, W. Y. CHEN and J. J. KOPCHICK, 1993 Effect
of genetic background on growth of mice hemizygous for wild-
type or dwarf mutated bovine growth hormone transgenes. Theor. Appl. Genet. 87: 161-169.
FALCONER, D. S., 1989 Introduction to Quantitative Genetics. Wiley &
Sons, New York.
GEBHARDT, M. D., and S. C. STEARNS, 1992 Phenotypic plasticity for life-histoly traits in Drosophila melunagusfer. 111. Effect of the environ- ment on genetic parameters. Genet. Res. Camb. 6 0 87-101.
KENDALL, M. G., and A. STUART, 1973 The Advanced Theoly of Statis- tics, Vol. 2. Hafner, New York.
KOOPS, W. J., 1986 Multiphasic growth curve analysis. Growth 50:
KOOPS, W. J., and M. GROSSMAN, 1991 Multiphasic analysis ofgrowth curves for progeny of a somatotropin transgenic male mouse. Growth Dev. Aging 5 5 193-202.
KOOTS, K. R., and J. P. GIBSON, 1994 How precise are genetic corre- lation estimates? Proc. 5th World Congress on Genetics Applied to Livestock Production 18: 353-360.
KOPCHICK, J. J., and J. A. CIOFFI, 1991 Exogenous and endogenous effects of growth hormone in animals. Livestock Prod. Sci. 27: 61-75.
MALIK, R. C., 1984 Genetic and physiological aspects of growth, body composition and feed efficiency in mice: a review. J. Anim. Sci. 58: 577-590.
MEYER, IC, and HILL, W. G. 1992 Approximation of sampling variances
and confidence intervals for maximum likelihood estimates of vari- ance components. J. Anim. Breed. Genet. 109: 264-280. MILLER, R. H., J. E. LEGATES and C. C . COCKERHAM, 1963 Estimation
of non-additive hereditary variance in traits of mice. Genetics 48: 178-187.
MOORE, R. W., E. J. EISEN and L. C. ULBERG, 1970 Prenatal and postnatal maternal influences on growth in mice selected for body weight. Genetics 64: 59-68.
NANCARROW, C. D., J. T. A. MARSHALL, J. L. CLARKSON, J. D. MURRAY, R. M. MILLARD et al., 1991 Expression and physiology of perfor- mance regulating genes in transgenic sheep. J. Reprod. Fert.
OBERBAUER, A. M., T. A. CURRIER, C. D. NANCARROW, K. A. WARD and J. D. MURRAY, 1992 Linear bone growth of oMTla-oGH transgenic male mice. Am. J. Physiol. 262 E93GE942.
PALMITER, R. D., R. L. BRINSTER, R. E. HAMMER, M. E. TRUMBAUER, M. G. ROSENFELD et aL, 1982 Dramatic growth of mice that develop from eggs microinjected with metallothionein-growth hormone fusion genes. Nature 300: 61 1-615.
POMP, D., and J. D. MURRAY, 1991 Single day detection of transgenic mice by PCR of toe-clips. Mouse Genome 89 279.
POMP, D., C. D. NANCARROW, K. A. WARD and J. D. MURRAY, 1992 Growth, feed efficiency and body composition of transgenic mice expressing a sheep metallothionein la-sheep growth hormone fusion gene. Livestock Prod. Sci. 31: 335-350.
PURSEI., V. G., D. J. BOLT, K. F. MILLER, C. A. PINKERT, R. E. HAMMER
et al., 1990 Expression and performance in transgenic pigs. J. Reprod. Fert. (Suppl.) 40: 235-245.
ROTHSCHILD, M. F., C. JACOBSON, D. VASKE, C. TUGGLE, L. WANG et
al., 1996 The estrogen receptor locus is associated with a major gene influencing litter size in pigs. Proc. Natl. Acad. Sci. USA
ROWE, D. E., and G. E. BRINK, 1993 Heritabilities and genetic corre- lations ofwhite clover clones grown in three environments. Crop Sci. 33: 1149-1152.
169-177.
(SUPPI.) 43: 277-291.
93: 201-205.
SAS, 1988 SAS/STAT User’s Guide. SAS Institute Inc., Cary, NC. SHANAHAN, C. M., N. W. RIGBY, J. D. MURRAY, J. T. MARSHAIL, C. A.
TOWNROW et ab, 1989 Regulation of expression of a sheep metallothionein la-sheep growth hormone fusion gene in transgenic mice. Mol. Cell. B~ol. 9 5473-5479.
SHAW, R. G., 1987 Maximum-likelihood approaches applied to quantitative genetics of natural populations. Evolution 41(4):
SHAW, R. G., 1991 The comparison of quantitative genetic parame- ters between populations. Evolution 45(1): 143-151.
ST. CLAIR, J. B., and W. T. ADAMS, 1991 Relative family performance
and variance structure of open-pollinated Douglas-fir seedlings grown in three competitive environments. Theor. Appl. Genet.
WESSEL-BEAVER, L., andJ. W. SCOTT, 1992 Genetic variability of fruit set, fruit weight, and yield in a tomato population grown in two
high-temperature environments. J. Amer. SOC. Hort. Sci. 117(5): 812-826.
81: 541-550.
867-870.