Abstract
Kim, Chang Hyeuk. A study of an area x-ray source for Diffraction Enhanced Imaging for Clinical and Industrial Applications. (Under the Direction of Professor Mohamed A.
Bourham.)
Research in diffraction-enhanced imaging (DEI) has shown strong potential in
obtaining high-resolution images as compared to conventional radiographs. A successful
development of a compact size DEI system would greatly improve x-ray diagnostics in the
medical field, as well as potential application in material science research and other industrial
applications.
DEI experimental research, using a synchrotron source, has shown success and
proven to be an attractive medical diagnostics method. While the use of a synchrotron source
might be applicable, however, a clinical system would rather use an x-ray source that could
be integrated into a radiology system feasible for hospital and clinical practices.
This research is aiming to develop an area x-ray source that replaces the need for a
synchrotron source by providing a monochromatic area x-ray beam collimated over 100cm2 area. Reasonable operation time (5-10 sec) is also a desirable feature with efficient thermal
management of the x-ray tube (target and housing). The x-ray flux should be comparable to
synchrotron source flux (1.4×10¹² photon/mm2/sec). The peak power must not exceed 200kW for feasible use in a major medical facility or industrial complex. A computational
study of concentric filament area x-ray source has been investigated in this research.
The design features are based on generating electrons from three concentric circular
filaments to provide an area electron flux, with a 60kV accelerating potential. The x-ray
(manufactured by BranXray Co., Inc.). Study of electron trajectories and their distribution at
various tilt angles of the target was completed using the SIMION 3D code. Heat loading and
thermal management is studied using an in-house developed thermal and heat transfer code.
X-ray flux and energy distribution for aluminum and beryllium windows was studied using
MCNP 4C2 Monte Carlo code. A prototype area x-ray source, a proof-of-principle device, is
under construction in the Department of Nuclear Engineering, NCSU to investigate the
feasibility of area x-ray generation and the scalability to clinical and industrial aspects. Other
researchers will use the computational results of this thesis as a predicting tool to determine
and optimize the prototype device operational parameters, and to benchmark the
experimental results.
A study of an areas x-ray source for Diffraction Enhanced Imaging for
Clinical and Industrial Applications
By
Chang Hyeuk Kim
A thesis submitted to the Graduate Faculty of North Carolina State University
in partial fulfillment of the requirements for the Degree of
Master of Science
Department of Nuclear Engineering
North Carolina State University Raleigh, North Carolina
2004
APPROVED BY:
Dr. Mohamed A. Bourham, Chair Dr. J. Michael Doster
Biography
Chang Hyeuk Kim was born May 22, 1976 in Gwangju, South Korea. He grew up
within Gwangju with his parents, Woo-Jeon Kim and Kyoung-Sook Beck, as well as his sister, Nu-Lee Kim. After he graduated from Gwangju Insung high school, he started college education at Chosun University as a Nuclear Engineering student in 1994. He joined military
Acknowledgement
I would like to express my gratitude to Dr. Mohamed A. Bourham. He has been my
academic advisor and good example to me as a researcher. Without his kindly and sincere guidance, I could not complete this thesis. I am also grateful to my committee members, Dr. Doster, Dr. Sayers, and Dr. McCord for their comments on my thesis. Dr. Doster helped me
in the thermal analysis and running his code. I must also acknowledge the Nuclear Engineering department and faculty, without this department’s financial support I could not have performed this research at North Carolina State University. I also would like to express my thanks to Dr. Man-Sung Yim for his invaluable guidance during the course of my
Table of Contents
page
List of Figures... vi
List of Tables ... ix
Chapter 1 Introduction ... 1
Chapter 2 Background ... 4
2.1 Typical X-ray imaging method... 4
2.2 Diffraction-Enhanced Imaging ... 6
2.2.1 Principle of DEI ... 6
2.2.2 Diffraction enhanced imaging components ... 12
2.2.3 Required X-ray flux ... 14
2.3 The area x-ray generator ... 16
Chapter 3 Theory ... 18
3.1 Electrostatics and electron trajectories... 18
3.2 Target thermal analysis... 20
3.2.1 Heat production... 20
3.2.2 Heat transfer... 21
3.3 X-ray production... 22
3.3.1 The Bremsstrahlung process ... 22
3.3.2 The characteristic x-ray... 23
3.3.3 Radiation shielding ... 24
Chapter 4 Simulations and Results ... 27
4.1 Proof-of-principle apparatus ... 27
4.1.2 X-ray target design... 29
4.1.3 X-ray source assembly and housing ... 31
4.2 Electron beam calculations ... 34
4.2.1 Thermionic electron emission... 34
4.2.2 Filament circuit current... 35
4.3 Simulations Results... 37
4.3.1 Electron trajectory simulation... 37
4.3.2 Target thermal analysis ... 53
4.3.3 X-rat production, radiation dose and shielding... 59
4.3.4 X-ray intensity for aluminum and beryllium windows... 62
4.3.5 Shielding consideration... 64
Chapter 5 Conclusions ... 68
Future work... 71
References... 72
Appendix I SIMION 3D geometry code... 74
List of Figures
page
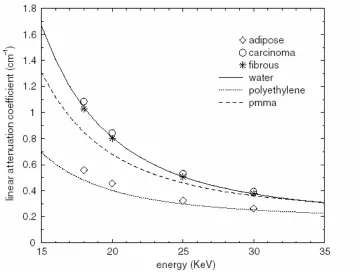
Figure 2- 1 Linear attenuation coefficients for breast tissue and tissue-equivalent material.... 5
Figure 2- 2 The conventional x-ray tube spectrum... 6
Figure 2- 3 A DEI Bragg and a radiography setup ... 7
Figure 2- 4 The rocking curve and examples of higher an lower side images ... 10
Figure 2- 5 Monochromatic beam flux in the NSLS X15A hutch using silicon [1 1 1],[3 3 3],[4 4 4], and [5 5 5] crystal-diffraction planes... 14
Figure 3- 1 The attenuation coefficient of lead... 25
Figure 4- 1 Concentric circular fillament assembly... 28
Figure 4- 2 Conventional x-ray tubes; rotating target and stationary target ... 29
Figure 4- 3 X-ray target for the proof-of-principle device ... 30
Figure 4- 4 Concept of concentric circular filaments and filament-target configuration ... 31
Figure 4- 5 Pictures of the filament-target assembly using a line filament source... 32
Figure 4- 6 Schematic diagram of the proof-of-principle experimental setup... 33
Figure 4- 7 Schematic diagram of the proof-of-principle experimental setup with the liquid nitrogen cooling option ... 33
Figure 4- 8 Illustration of standard unbiased and biased x-ray filament cup... 38
Figure 4- 9 Configuration of the concentric filament and focusing cup assembly... 38
Figure 4- 10 Electron trajectories without and with backing plate... 40
Figure 4- 11 Electrons’ distribution on the target, x-y and x-z planes ... 40
Figure 4- 12 Schematic of filament and target positions in the proof-of-principle experiment ... 41
Figure 4- 14 Floating backing plate, filament at -60kV, 10 degree target tilt angle... 43
Figure 4- 15 Floating backing plate, filament at -60kV, 15 degree target tilt angle... 44
Figure 4- 16 Floating backing plate, filament at -60kV, 20 degree target tilt angle... 44
Figure 4- 17 Floating backing plate, filament at -60kV, 22.5 degree target tilt angle... 45
Figure 4- 18 Filament at -12V, backing plate at -60 kV, 5 degree target tilt angle ... 47
Figure 4- 19 Filament at -12V, backing plate at -60 kV, 10 degree target tilt angle ... 47
Figure 4- 20 Filament at -12V, backing plate at -60 kV, 15 degree target tilt angle ... 48
Figure 4- 21 Filament at -12V, backing plate at -60 kV, 20 degree target tilt angle ... 48
Figure 4- 22 Filament at -12V, backing plate at -60 kV, 22.5 degree target tilt angle ... 49
Figure 4- 23 Filament at -60kV, backing plate at -60 kV, 5 degree target tilt angle ... 50
Figure 4- 24 Filament at -60kV, backing plate at -60 kV, 10 degree target tilt angle ... 51
Figure 4- 25 Filament at -60kV, backing plate at -60 kV, 15 degree target tilt angle ... 51
Figure 4- 26 Filament at -60kV, backing plate at -60 kV, 20 degree target tilt angle ... 52
Figure 4- 27 Filament at -60kV, backing plate at -60 kV, 22.5 degree target tilt angle ... 52
Figure 4- 28 Converted electron distribution as a heat source on the target for the option of the filament and the backing plate connected to each other and at -60kV ... 55
Figure 4- 29 Target temperature distribution for 3mA beam current at 60kV ... 57
Figure 4- 30 Target temperature distribution for 30mA beam current at 60kV ... 58
Figure 4- 31 Target temperature distribution for 300mA beam current at 60kV ... 58
Figure 4- 32 MCNP simulation results for aluminum window options... 61
Figure 4- 33 MCNP simulation results for beryllium window options ... 61
Figure 4- 34 Comparison between aluminum and beryllium window options... 62
Figure 4- 36 Kα1 x-ray flux with Be window options ... 64
Figure 4- 37 Schematic diagram of the sheilding calculation... 65
Figure 4- 38 Coefficient of lead in the low energy range ... 66
Figure 4- 39 Exposure rate versus circuit current... 67
List of Tables
page
Table 3- 1 K-shell characteristic x-ray energies (keV)... 24
Table 4- 1 Concentric circular filament parameters ... 28
Table 4- 2 Target component data ... 30
Table 4- 3 Electron beam current as a function of temperature calculated for a tungsten filament ... 35
Table 4- 4 Filament temperature versus circuit current ... 36
Table 4- 5 Filament circuit current versus beam current ... 37
Table 4- 6 Simulation results, floating backing plate, filament at -60kV... 42
Table 4- 7 Simulation results, Filament at -12V, backing plate at -60 kV ... 46
Table 4- 8 Simulation results, Filament at -60kV, backing plate at -60 kV ... 50
Table 4- 9 Heat transfer code input data... 56
Table 4- 10 The possible operation time... 57
Table 4- 11 MCNP simulation results for aluminum window... 60
Chapter 1
Introduction
Recent research in medical imaging has provided various means by which high resolution images could be obtained. The various imaging techniques have different
capabilities, and some have progressed dramatically during past fifty years. X-ray imaging, radiology, although it is one of the oldest techniques (Roentgen 1895), has proven to be one of the standard reliable radiology methods. Recent research in diffraction-enhanced imaging
(DEI) has shown strong potential in obtaining high-resolution images over other known technique [1]. Images obtained using DEI, with the utilization of a synchrotron beam, have shown the benefits of DEI over other x-ray radiology and other imaging system. However, the use of a synchrotron source necessitates having a DEI system close to a major
synchrotron facility. The synchrotron source provides a monochromatic highly collimated beam, which is necessary for diffraction-enhanced imaging. A clinically approved DEI system, which may be installed in major hospitals, would need a new x-ray source that can provide a substitute for a synchrotron source. Although medical imaging may appear as the
primary application of DEI, but the application extends to material science research and various industrial applications such as advanced radiography for cargo and parcel screening with enhanced resolution for active interrogation techniques.
a highly collimated synchrotron radiation source, from the X15A beam line at the National Synchrotron Light Source of Brookhaven National Laboratory. The system employed two
different types of crystals for producing monochromatic and diffracted x-ray beams. This system is completely free of scattering and the beam contains only the contribution from x-rays that are affected by absorption, extinction or refraction through a very small angular
deflection of the order of microradians (5.73 × 10⁻⁵ degree/microradian). This arrangement made it possible to obtain higher contrast images from the same object.
The purpose of this study is to investigate the feasibility of developing a new compact
size area x-ray source capable of producing typical parameters needed for diffraction-enhanced imaging without using a synchrotron source. This computational study would be used as the proof-of-principle towards developing a clinically approved DEI system for medical radiology, and scalability to other industrial applications including active
interrogation of cargo and parcels. The desirable features of an area x-ray generator are:
- Peak electric power less than 200 kW - High x-rays flux (~1012 ph/mm2/sec)
- Output x-ray beam collimated over a 100 cm2 area - Reasonable operation time (~ 5 – 10 seconds)
- Stationary (non-rotating) target assembly and concentric or spiral filament configuration.
industrial system. The major design aspects of this study are the electrostatic analysis and electron trajectories and their distribution, the thermal analysis and target heat loading for
Chapter 2
Background
2.1 Typical X-ray imaging method
X-ray radiography is one of basic diagnostics in medical imaging. It is based on the attenuation of an x-ray as it travels through a medium, and the specific density of the medium
and the energy of the incident beam determine the attenuation coefficient. A medium with a structure of different compositions will attenuate the incoming beam with different attenuations. A detector, or x-ray film, will thus indicate the structure of the medium. For human body, the concept is the same and a radiograph is a picture obtained due to different
attenuation in the human body for a given exposure rate on the film or the detector [3]. A basic radiography system has an x-ray generator on one side of the patient, and an x-ray detector on the other side. When X-ray travels through the body, the attenuation is different in different tissue or bones due to their difference in attenuation coefficients. The film, or
x-ray detector, will detect the difference in x-x-ray intensities after attenuation through the medium. The contrasts on the film or amplitudes on a digital detector produce an image of the structure of the medium. Radiographic images in the medical practice are widely used to obtain images of broken bones, kidney stones, lung cancer, cardiovascular disorder, etc. [3].
x-ray energy levels. The linear attenuation coefficients of breast tissue and tissue-equivalent materials [4] are shown in Figure 2-1.
The different attenuation coefficients of these tissues are not detectable with conventional radiography devices, which use relatively high-energy x-ray. The spectrum of a
conventional x-ray tube [5] is shown in Figure 2-2. The images from these energy ranges cannot efficiently discriminate between normal and cancerous breast tissues. As a corollary, modern mammography systems have x-ray sources and detector systems specifically designed for breast imaging.
Figure 2- 2 The conventional x-ray tube spectrum (Ref.: FDA 81-8162, 1981)
2.2 Diffraction-Enhanced Imaging
2.2.1 Principle of DEI
Conventional x-ray radiography uses an x-ray beam to penetrate an object, and the attenuation of x-ray occurs through the structure of the object resulting in different attenuated
intensities. The difference in attenuation results in a spatial distribution of the attenuated x-rays on the film or the digital detector. However, x-ray attenuation process is not only due to interaction between the incident x-rays and an object, it included absorption, refraction and
Figure 2-3 illustrates the synchrotron setup used to obtain radiographs of an object and the addition of the analyzer crystal (Bragg or reflection geometry) used to implement the
DEI system at the synchrotron (D. Chapman et al., 1997; [1]). In the shown setups, a Si(333) double crystal monochromator is used to select required x-ray energy range for the synchrotron beam, while for the DEI Bragg case setup the Si(333) crystal serves as the Bragg
analyzer. As previously mentioned, information from x-ray scattering and diffraction are lost in conventional radiography. In diffraction-enhanced imaging DEI Bragg setup, with Si(333) Bragg analyzer, it allows for such information to be obtained [6].
Figure 2- 3 A DEI Bragg and a radiography setup (Ref.: D. Chapman. 1997)
It is important to mention that in both set ups of Figure 2-3, a Si (333) double crystal monochromator is used, but the addition of a Si (333) Bragg analyzer is necessary for the DEI Bragg setup. To further clarify this necessity, for DEI imaging, the imaging beam is
high degree of scatter rejection, which results in obtaining an improved image contrast. The Bragg analyzer provides almost complete scatter rejection due to the fact that the analyzer
only accepts narrow angles in the range of few microradians. The Bragg analyzer provides the tools necessary to prepare and analyze x-ray beams traversing an object on the microradian scale [7], and thus this Bragg analyzer is a necessity for a DEI setup. The
material of the crystal is typically silicon. The purity and perfection of these crystals have allowed many advances in x-ray diffraction techniques and in particular at synchrotron x-ray sources. The condition for x-ray diffraction from a crystal is met only when the incident beam makes the correct angle to the atomic lattice planes in the crystal for a given x-ray
energy, or wavelength. When this condition is met, the beam diffracts from the planes over a narrow range of incident angles, which is called the Bragg diffraction. As the crystal is rotated around the axis parallel to the lattice plane and perpendicular to the incident beam direction, the intensity variation is referred as the rocking curve. The shape of this curve is
roughly triangular with the peak reflectivity approaching near 100%.
The intensity of x-ray, after penetrated an object in normal radiography, can be expressed by:
I C D R
N I I I I
I = + + +
where, IN is the source of contrast at the detector plane. The portions of coherent
scattering and incoherent scattering are IC and II, respectively; and the diffraction intensity is
given by ID, which arrives on the detector along with the portion of incident beam IR that has
In a DEI system, the portion of refracted beam IR will be separated from the other
components and shows contrast based on refraction, absorption, and extinction. The
scattering component, IC and II, contribute to loss of contrast and spatial resolution, which
can be improved by using a synchrotron source and a monochromator. Synchrotron radiation offers high intensity and good natural collimation of the radiation. The characteristics of
synchrotron radiation make it possible to select a narrow wavelength by a crystal monochromator [8]. In addition, the crystal diffraction optics could also be used to eliminate coherent and incoherent fractions IC and II, respectively. The crystal analyzer diffracts the
x-ray, which is aligned within the angular acceptance (rocking curve), onto the detector. It is
possible to remove the scatter contribution to the image. The width of the rocking curve is few microradians. After eliminating the coherent IC and the incoherent II scattering portions,
the incident beam has only the refracted portion IR, which is very close to the initial direction.
In the DEI setup, two images are obtained depending on the position on the rocking curve. One image is the apparent absorption image, which is an actual image from direct transmission. The other is the refraction image, which is correlated to the gradient of the refractive index along the path of the x-ray through the object. To facilitate this, an example of two images of an object are obtained; one through an analyzer angle that is slightly greater
than the peak angle of the rocking curve (higher side image), and one at lower than the peak angle (lower side image). The rocking curve and two DEI images are shown in Figure 2-4 [1].
The analyzer crystal diffracts the beam in the vertical plane. Therefore, the sensitivity
Figure 2- 4 The rocking curve and examples of higher an lower side images (Ref.: D. Chapman, 1997)
According to Chapman, et al [1], the intensity diffracted by the analyzer is set as a relative angle θi from the Bragg angle θB where θB+ θi is the angle between the incident beam
and diffraction planes and is given by
(
B i)
R
i I R
I = θ ±θ
where Ii is the intensity at relative angle θi from Bragg angle θB, IR is defined as the portion of
the incident beam which has only been affected by refraction and attenuation by absorption
and extinction, and R(θ) is the analyzer reflectivity function at angle θ. The analyzer reflectivity function R(θ) is a function of the rocking curve. The beam intensities of the images IL and IH, which are taken on the lower side (θL) and the higher side (θH) of the
rocking curve, respectively, can be expressed by Taylor expansion.
( )
+ ∆= L Z
L R L d dR R I I θ θ θ θ ( )
( )
+ ∆= H Z
The analyzer reflectivity function R(θ is an expression of Taylor expansion. From the above two equations, the beam intensity composed of apparent absorption, IR, and the
refraction image angle, ∆θZ, can be obtained.
− − = θ θ θ θ θ θ θ θ θ θ d dR R d dR R d dR I d dR I I L H H L L H H L
R ( )
) ( ) ( ) ( ) ( ) ( − − = ∆ θ θ θ θ θ θ θ d dR I d dR I R I R I L H H L H L L H
Z ( ) ( )
) ( ) (
In general, the images of each side are obtained at the half width of the rocking curve.
It makes R(θL) and R(θH) equal with the peak reflectivity normalized to 1.0. Because the
rocking curve around the peak is symmetrical, one obtains:
θ θ θ θ d dR d
dR( H) =− ( L)
Therefore, IR and ∆θZ can be shown as
) ( L H
R I I
I = +
∆θZ represents the distribution of angles of refraction in the Z-direction. The
refraction intensity, IR, is expressed by IR(dR/dθ)∆θZ and is proportional to (IL-IH), assuming
that the slope of the rocking curve dR/dθ assumed equal magnitude at the high and low sides. As illustrated in Figure 2-4 by D. Chapman, 1997, the rocking curve FWHM is 4 microradians. The figure also shows both high and low angle sides images.
2.2.2 Diffraction enhanced imaging components
The main components of DEI system are an image plate detector, a monochromator, Bragg analyzer, and a synchrotron radiation source. The DEI group (Zhong, Chapman, at al. 2000) have already established two DEI imaging test facilities using the synchrotron source
at the National Synchrotron Light Source (NSLS) of Brookhaven National Laboratory for lower energy range (less than 30 keV), and the Advanced Photon Source (APS) at Argonne National Laboratory for higher energy range (up to 60 keV). The two DEI facilities successfully performed DEI imaging experiments [9].
Z. Zhong, at el [9] reported that the DEI images were obtained using image-plate readers (Fuji Medical Systems, model BAS 2000 or AC3) at the NSLS. Since the Bragg analyzer inverts the beam, the image plate was scanned in the direction opposite to the
object’s scan direction to avoid blurring the image. The image plate scanner was also tilted to an angle 2θB from the vertical direction. The pixel size of the image was 100µm×100µm.
The synchrotron source offers high intensity and good natural collimation of radiation, but it has a continuous spectrum through the entire energy range. The synchrotron radiation
makes it possible to select a narrow energy range by a crystal monochromator. According to the experiment by Chapman, at el [1] at NSLS, a silicon double-crystal monochromator was used for selecting narrow radiation energy range. The energy range of the system was 16-25
keV. The beam energy used 18 keV with an energy width of about 1.5eV. The monochromator crystals are silicon (3,3,3) lattice planes. The narrower rocking curve of the Silicon (3,3,3) makes a preferable choice. This choice of lattice planes increased the sensitivity to refraction effects by a factor of five as compared to an experiment that used the
silicon (1,1,1) lattice planes.
The x-ray flux of the synchrotron affect the DEI image quality and scan time. According to Z. Zhong, at el [9], the X15A beamline at NSLS has a flux of 1.4×10¹²
ph/s/mm2/keV at 18 keV (at 200mA ring current) of white beam. This white beam travels thorough a Be window and Al filter, protected from ozone by a helium flow. After the white beam travels through the Be window and Al filter, the specific energy range could be selected by the monochromator. The monochromatic beam is dependent on the crystal
Figure 2- 5 Monochromatic beam flux in the NSLS X15A hutch using silicon [1,1,1],[3,3,3],[4,4,4] ,and [5, 5,5] crystal-diffraction planes (Ref.: Z. Zhong, 2000).
2.2.3 Required X-ray flux
As previously mentioned, the white beam from X15A beamline at NSLS, has 1.4×10¹² ph/s/mm2/keV at 18 keV. The scan time, which used this white beam intensity, was 4 to 200 sec. For the purpose of using DEI for mammography, this scan time is appropriate. However, using synchrotron source is not feasible for a clinical DEI system unless DEI
facilities to be built at a national laboratory that has a synchrotron source. The size, construction cost, and operation of a synchrotron source are difficulties of applying a synchrotron as an x-ray source for clinical application. A conventional x-ray tube may be used to substitute for the x-ray source, however, conventional x-ray tubes do not specifically
bremsstrahlung radiation from a conventional x-ray tube delivers unnecessary radiation dose to the patient, and does not provide a means by which DEI could be employed. Moreover, the
low intensity of the produced x-ray increases the scan time, which is estimated to be approximately between 1,000 to 10,000 second for a conventional source. Such long scanning times are not acceptable to operate a DEI system for clinical use for mammography.
It is also important to have a collimated are x-ray beam to provide area magnification for DEI application. A conventional x-ray tube has typically 0.3~0.4 mm focal spot. For a clinically approved DEI mammography unit, the dimension of the beam in the sagittal direction will be 150 mm to get a full field of view. For these reason, a new x-ray source is needed to provide
the similar synchrotron characteristics necessary for DEI imaging at clinical practice level.
Several concepts for a new x-ray source were proposed by the NCSU research group (Bourham, Doster, Verghese and Sayers, in collaboration with UNC Chapel Hill Radiology
group and others, 2000) [10], such as the shaped-target multi-filament concept, the high-current beam steering concept and the cold cathode field emission concept. The shaped-target multi-filament concept has the most attractive features over other concepts. In this concept, the source design is based on a tilted stationary molybdenum target with the target’s surface
shaped in a log-spiral. Filaments to be arranged as an array of line filaments, with each filament assembly composed of the individual line filaments and corresponding focus cups. Total emission current of the filament array can be as high as 3A, which will deliver a total power of 180kW to the target for 60kVp operation. The illumination area for this concept is
copper target with a layer of molybdenum. The x-ray intensity for DEI can be reached by the above concept, concentric filaments and flat target. This appears as a modification of a
conventional x-ray tube utilizing area illumination.
First, increasing the acceleration potential produces higher x-ray intensity. However,
generated bremsstrahlung radiation could be reduced and eliminated through Aluminum or Beryllium filter. Second, increasing the electron beam current, which depends on electron emission area from the filament, could increase the x-ray intensity. The typical x-ray tube uses a small line filament, which does not exceed the diameter of the target area. Therefore,
the concept of concentric circular, or spiral, filament produces larger electron emission as the emission area increases over the standard small line filament source. The large electron emission area produces higher electron beam current, and higher electron flux, thus increasing the number of electrons illuminating the target over the entire target cross section.
Both methods, increasing acceleration potential and using larger electron emission area, result in increased heat loading of the x-ray. The heat loading would exceed the capacity of cooling mechanism of typical x-ray tube, which usually uses a rotating target to spread the heat loading or uses an air-cooling system. Therefore, a concentric filament x-ray source will
necessitate an active cooling system for heat removal.
2.3 The area x-ray generator
For this study, the area x-ray generator is basically composed of a stationary target made of oxygen-free copper with a molybdenum layer, a filament assembly composed of
housing of the source assembly. The core of this research is to investigate the source electrostatics and generation of the electrons and their trajectories, thermal behavior and
thermal management, nuclear analysis of x-ray generation and dose delivery, and x-ray shielding and safety.
Electron trajectories and their distribution in the system are determined by the geometry of anode and cathode, and the form of electron acceleration. Thus, an analysis of electron trajectories and their distribution is conducted using electrostatic code (SIMION). As accelerated electrons hit the target, most of their kinetic energy converts to heat thus
raising the target’s temperature (which may exceed its vaporization temperature), and limits the operational time. The system should operate in a time range not to allow target melting. For this purpose thermal calculations are performed using in-house heat transfer code. The x-ray quality and intensity are related to the target material and the electron accelerating
potential, which requires nuclear analysis of x-ray generation; the Monte Carlo code MCNP 4C2 has been used for this analysis.
Chapter 3
Theory
3.1Electrostatics and electron trajectories
The acceleration and spatial distribution of electron in the ray source will affect x-ray generation, target heat loading, and radiation safety concerns arising from electrons bouncing on the interior of the x-ray source housing. Electrons are generated by thermionic emission from a hot filament and are accelerated towards the target by high voltage
accelerating potential. Electron trajectories would have different shapes and distributions depending on the form of the accelerating potential, uniformity of the electric field distribution, biasing of the filament cup or using of a backing plate (the later may also be biased). The SIMION 3D 7.0 was used to calculate electron trajectories and distributions on
the target surface for various field configurations and biased and un-biased backing plate.
The SIMION 3D code [12] is based on the charged particles optics, electrons or ions. Charged particle optics utilizes the motion of charged particles under the influence of electric,
or magnetic fields, or a combination of both. The equation of motion for a charged particle accelerated by a uniform electric field is
m eE dt
dv M F
A= / → =−
X V e eE dt dv
m e X
e ∂
∂ = − =
from which the electron velocity could be obtained
∫
∫
∂ ∂ = t e v e dt X V m e dv e 0 0 t dX dV m e v e e =A static uniform magnetic field will not change the velocity of the charged particle but will force the particle to gyrate in a fixed orbit around the magnetic field line. The force
equation for a charged particle under the influence of magnetic field is
(
U B)
Q
Fm = i ×
where Fm is the magnetic force, Qi is the charge (for an ion). The force Fm (Lorentz
force) is always normal to both B field vector and U velocity component normal to the magnetic field. Trajectories of charged particles are governed by the form of electric and magnetic fields, their spatial uniformity and their time dependence (if any) [12].
The deflection of a charge particle due to electric force may be expressed by electrostatic radius of refraction, which is proportional to the particle's kinetic energy. The orbiting radius due to magnetic force is proportional to the particle’s momentum. The electric
deflection is given by
n n r mv eE 2 =
− , and thus
n eE E K E v e m eE mv
r ( / ) 2 .
The gyration radius due to magnetic field is given by n n r mv ev B 2 = − and thus n n n n eB E mK B v e m e B mv r 2 / 1 ) . 2 ( ) / ( = = =
, where K.E. = (mυ)2/2.
Thus all ions (or electrons) with the same starting location, direction and kinetic energy per unit charge would have identical trajectories in static electric and magnetic fields.
The trajectories are not mass dependent in static electric field, but they are mass dependent in static magnetic field.
When the filament emits electrons by thermionic emission, and an accelerating potential is applied, electrons follow the electric field direction towards the target. Although
electron current induces magnetic field, however, this self-induced magnetic field is weak and the force equation is governed by the electric force over Lorentz force.
3.2Target thermal analysis
3.2.1 Heat production
When electrons hit the target, the kinetic energy of the electrons undergoes conversion to x-ray production and heating of the target. Most of the electron’s energy is
[14]. The efficiency of x-ray production is directly proportional to the atomic number of the target and to the applied potential, as approximately expressed by the following equation.
kVp Z K
efficiency= × ×
%
where K is constant = 1 × 10⁻⁴, Z is the atomic number of the target, and kVp is the
peak voltage. For example, for a molybdenum target ( Z = 42 ) and an accelerating potential of 60 kVp:
% 25 . 0 60 42 10
1× 4 × × =
= −
efficiency
This means that only 0.25% of the total kinetic energy of the electron beam appears as x-ray and the remaining 99.75% percent as heat in the target.
3.2.2 Heat transfer
The mechanism of heat transfer into the target has the three heat transfer processes, conduction, convection, and radiation; and they occur simultaneously depending on medium. In x-ray targets, the conduction would be dominant among convection and radiation heat
transport as the source is under vacuum. However, radiation heat transfer from the hot target follows. In this research, a molybdenum layer is attached to the oxygen-free target, where the later serves as a target structure and cooling material. The heat conduction equation is given by
dx dT k qx'' =−
For a one-dimensional plane wall, the heat flux qx`` (W/m2) is the heat transfer rate in
the x direction per unit area perpendicular to the direction of transfer, and it is proportional to
the temperature gradient, dT/dx, in this direction. The proportionality constant k, thermal conductivity, is a transport property [15].
The basic three dimensional – time dependent conduction equation is
t T C r q
T p
∂ ∂ = +
∇ ⋅
∇ κ ```( ) ρ
where,
T: temperature ( K )
ρ : density ( kg/m3)
κ : thermal conductivity ( W/m·K )
Cp: specific heat ( J/kg·K )
q``` : volumetric heat generation rate ( J/m3·s )
3.3X-ray production
3.3.1 The Bremsstrahlung process
The conversion of electron kinetic energy into electromagnetic radiation produces x-rays. The x-ray source has the filament as the cathode and is negatively charged. The filament emits electrons by thermionic emission. The anode, the target, may be positively
example, the energies of electrons accelerated by potential difference of 20 and 100 kilovolt peak (kVp) are 20 and 100 keV, respectively [3]. The kinetic energy of electrons converts to
both target heating and production of x-rays, where the largest percentage of this energy appears in target heating. When electrons are accelerated and hit the target material, the target Coulomb force would attract and decelerate the electrons, causing a significant loss of
kinetic energy and a change in the electron’s trajectories. The amount of energy lost in the target during this process generates electromagnetic radiation, bremsstrahlung “breaking radiation”, with equivalent amount of the energy.
The distance between the bombarding electrons and nucleus determines the electron energy lost in producing bremsstrahlung, because the Coulomb force between the nucleus and electron is increasing with the inverse square of the distance between them. The electron energy loss could be determined by long or short-range interactions, or by the direct impact
on the nucleus. In the long-range interaction the electron energy loss is low and thus the produced photon’s energy is also low. The short-range interaction is an interaction at closer distance, where in this process the electron loses more energy than the first case and thus produces higher energy photons. The third process is the direct electron impact on the
nucleus, and the electron loses all its kinetic energy and produces much higher energy photons, however, it is an extremely low probability.
3.3.2 The characteristic x-ray
Collisional interaction takes place when the incident electron’s energy exceeds the
ejecting the incident and target electrons, leaving a vacancy at the electron orbit and the atom becomes ionized. The vacancy of the orbit would be filled by the outer orbit electron, which
has low energy state. The excess energy is released as a characteristic x-ray photon with energy equal to the difference between binding energies of the electron shells. The binding energy of an orbit electron is unique to each element. Consequently, the emitted x-ray has
discrete energies that is characteristic of the element. The K-shell characteristic x-ray energies are shown in Table 3-1 for various target atoms. The discrete energy spikes are superimposed on the continuous bremsstrahlung spectrum. The most prevalent characteristic x-rays in the diagnostic energy range are due to K shell vacancies. The shell capturing the
electron designates the characteristic x-ray transition from the L to the K shell, and Kβ
referred to an electron transition form M, N, or O shell to K shell. In case of mammography, Molybdenum is preferred as a target material, which has low energy characteristic x-ray.
Table 3- 1 K-shell characteristic x-ray energies (keV)
Shell transition Tungsten Molybdenum Rhodium
Kα1 59.32 17.48 20.22
Kα2 57.98 17.37 20.07
Kβ1 67.24 19.61 22.72
3.3.3 Radiation shielding
When ionizing radiations travel through matter, the radiations, especially γ-ray and
energies of incident radiation. In case of a photon, the pair production is dominant with increased energy. The photoelectric effect has a higher probability for lower energy photons.
The specific photon, which has a certain energy range, has coherent proportionality with three interactions. The interaction probability per unit differential path length is fundamental in describing how radiation interacts with matter and is known as the linear attenuation
coefficient. It could also be represented by mass attenuation coefficient which is the linear attenuation coefficient divided by the density [16]. The attenuation coefficient of lead,
usually used for radiation shielding, is shown in Figure 3-1. When radiation, x-ray or γ-ray,
penetrates a material the intensity decreases exponentially. Thus, materials with higher attenuation coefficient are desirable for radiation shielding.
1.00E-02 1.00E-01 1.00E+00 1.00E+01 1.00E+02 1.00E+03 1.00E+04
1.00E-03 1.00E-02 1.00E-01 1.00E+00 1.00E+01 1.00E+02
Energy [MeV]
A
tte
nuat
ion c
o
ef
ficie
n
t [c
m
2/g]
Mass attenuation Mass - Energy attenuation
The photon exposure is defined as the absolute value of the ion charge produced anywhere in the air by the complete stoppage of all negative and positive electrons liberated
in an incremental volume of air, per unit mass of air in that volume. The exposure is clearly related to air kerma, but differs in one important respect. The phenomenon measured by the interaction of the photons in the incremental volume of air is not the kinetic energy of the
secondary electron, but the ionization caused by the further interaction of these secondary electrons with air. The basic unit of exposure is roentgen, abbreviated R, which equals to 2.58×10⁻⁴ coulombs of separated charge per kilogram of air in the incremental volume where the primary photon interaction occur. The conversion factor for kinetic energy to ionization
for air is 33.85 eV [17]. The response function of exposure rate is shown in R cm2 [18].
air en x E E kg MeV ions ion C R C kg R × × × × × = − ρ µ ( ) 10 85 . 33 10 10 602 . 1 58 . 2
104 19 6 3
air en x E E R × = − ρ µ ( ) 10 835 . 1 8
∫
= • Ex E E
dER
X ( )φ( )
Chapter 4
Simulations and Results
In this thesis work, three computer codes were used for the calculations necessary for the proof-of-principle design of the area x-ray generator. The first code is the SIMION 3D
[12], which was used to calculate the electron trajectories and their spatial distributions, and to optimize the selection of electric field configuration. Structures of the concentric filaments and target assembly were encoded by a geometry file, which is shown in Appendix I. The
electron distribution on the target determines the production of x-ray and heat generation into the target. The Second code is a 2-D cylindrical heat transfer code to calculate the temperature rise of the target, and to help evaluating the operation time under which the target temperature shouldn’t exceed the melting point. The third code is the Monte Carlo
MCNP 4C2 [19], which was used for calculations of the x-ray production rate with various window options, and was also used for shielding calculation.
4.1Proof-of-principle apparatus
4.1.1 Filament assembly design
A filament assembly is designed with three concentric circular filaments to provide electron emission from a large area to provide the required area magnification necessary for a
produces higher x-ray flux. The three concentric circular filaments are designed to produce flux equivalent to synchrotron source. The design parameters of the concentric circular
filament are shown in Table 4-1, and an illustration of the filament assembly is shown in Figure 4-1.
Table 4- 1 Concentric circular filament parameters
Material Tungsten Outer filament 0.4749 inch
Meddle filament 0.3231 inch Circular filament Radius
Inner filament 0.1750 inch Filament diameter 0.05 inch
4.1.2 X-ray target design
There are two aspects for a target design, structure and material. For most conventional x-ray generators, the target may be rotating or stationary. Rotating target provides distribution of the heat over the entire tilted surface of the target and may not
necessitate active cooling. The stationary target may be used in systems that operate for very short times; however, active cooling may be necessary. Figure 4-2 shows two conventional x-ray tubes, a rotating target tube (left) and a stationary target tube (right) [3].
Figure 4- 2 Conventional x-ray tubes; rotating target (left drawing) and stationary target (right drawing). (Ref.: Jerrold T, Essential physics of medical imaging, 2002)
The rotating target has an advantage in terms of better handling of heat loading, as it provides large electron exposed area, and consequently has a decreased average heat loading.
The stationary target has more of a simple structure, but its operation time is limited. For the area x-ray source in this study, if to operate at higher beam currents at 60kVp, active cooling will be necessary and may require using a liquid nitrogen cooling circulator to allow for longer operation times sufficient for DEI application. Because of the specific design of the
liquid nitrogen cold finger will be attached to the back of the target for heat removal. However, the proof-of-principle device may not be equipped with liquid nitrogen cold finger
because it is neither intended for longer operation times nor for high beam currents. The proof-of-principle device provides the basic studies in area x-ray production, mapping of electron trajectories and distribution and benchmarking codes’ results, however, it is scalable to industrial features with inclusion of forced or liquid nitrogen cooling. The target
parameters are shown in Table 4-2, and a drawing of the target is illustrated in Figure 4-3.
Table 4- 2 Target component data
Material Molybdenum layer on oxygen-free copper
Length 2.1 inch
Diameter 1.4 inch
Mo 2623 °C
Melting point [7]
Cu 1084.62 °C
Mo 4.01 W/cm K
Thermal Conductivity [7]
Cu 1.48 W/cm K
Figure 4- 3 X-ray target for the proof-of-principle device Molybdenum
Copper
4.1.3 X-ray source assembly and housing
For the proof-of-principle experimental device, a 6-inch, 6-way cross is used to house the filament-target assembly and to allow for diagnostics to measure the device operational parameters. The experiment is equipped with an air-cooled Alcatel turbo-molecular pump
venting to a mechanical rotary pump. A 4-inch extension T-section accommodates vacuum measuring devices, a Convectron gauge and an ionization gauge heads. A pressure of <1x10⁻⁶ Torr could be reached in about 20 minutes. The filament and target are assembled on one flange with high voltage and filament current feedthroughs. Figure 4-4 shows a drawing of
the filament-target configuration and pictures of the filament-target assembly using a line filament source is shown in Figure 4-5. The target is tilted to allow for the take off angle, and thus the x-ray is directed towards the extraction window.
Figure 4- 4 Concept of concentric circular filaments and filament-target configuration A
A
Elevation Cross-sec Side-view looking A-A
Outer filament ring Middle filament ring Inner filament ring Cold finger (liquid nitrogen)
Molybdenum layer ‘target’
Filament assembly Copper anode
Figure 4- 5 Pictures of the filament-target assembly using a line filament source.
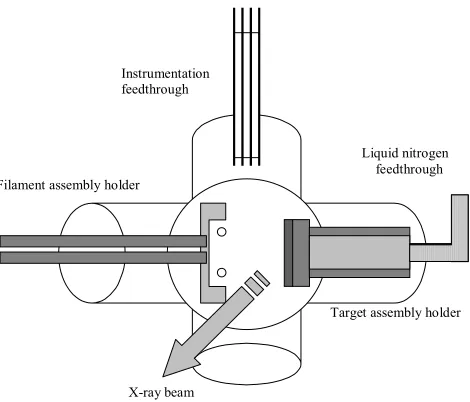
If needed, a liquid nitrogen cold finger feedthrough could be attached through the window across from the back of the target. Other flanges are arranged with instrumentation
feedthroughs for experimental measurements. Beryllium or aluminum may serve as the x-ray window material. Optimization of window material and thickness was conducted with the Monte Carlo MCNP code, as will be discussed in section 4.3.3. A schematic of the proof-of-principle experiment is shown in Figures 4-6 and 4-7. Figure 4-7 shows the experimental configuration with instrumentation feedthroughs and the liquid nitrogen cooling option.
Additional instrumentation feedthroughs are also installed (not shown in the figure) on the flange opposite to the extraction window. The T-section has an end-on viewing port for infrared thermometry to measure the filament temperature and to monitor the temperature of
Faraday Cup Convectron Gauge
Ionization Gauge Filament Supply
-HV
Viewing
Window
Electric Probe Target
Reducer
Table Top
Turbopump
Table Middle Frame Mechanical
Pump
Figure 4- 6 Schematic diagram of the proof-of-principle experimental setup
Instrumentation feedthrough
Liquid nitrogen feedthrough Filament assembly holder
Target assembly holder
X-ray beam
4.2Electron beam calculations
4.2.1 Thermionic electron emission
Emission of electrons from the hot filament could be calculated from the
Richardson-Dushman equation [22], which relates electron current density to the filament’s temperature and the filament’s material work function. Richardson’s equation for thermionic emission is given by:
] / exp[
2
0T KT
A
J = −φ
where,
T : surface temperature of the filament
φ : work function of filament material
K : Boltzman constant
A0: is a constant =1.2 x 10⁶ A/m2K2 according to the statistical mechanics theory, however, it is not the same for all metals and is 70x104 for
tungsten (φ =4.55V)
It is also possible to calculate the electron beam current from the emissivity of the filament as
I = εA, where A is the area of the filament. The emissivity ε of the filament for a specific
material is a function of the filament’s surface temperature, and could be obtained from
available tables, such as CRC Handbook [23]. The emitting area of the filament A = πdL,
emissivity of tungsten [23], and the calculated beam current for the above filament parameters.
Table 4- 3 Electron beam current as a function of temperature calculated for a tungsten filament. Emissivity of tungsten obtained from CRC Handbook [23]
Temperature [K]
Emissivity [A/cm2]
Beam current
[A]
Temperature [K]
Emissivity [A/cm2]
Beam current
[A]
1500 9.14E-08 5.66E-07 2100 3.93E-03 0.0243
1600 9.27E-07 5.74E-06 2200 1.33E-02 0.0824
1700 7.08E-06 4.39E-05 2300 4.07E-02 0.252
1800 4.47E-05 2.77E-04 2400 1.16E-01 0.719
1900 2.28E-04 1.41E-03 2500 2.98E-01 1.85
2000 1.00E-03 6.20E-03 2600 7.16E-01 4.44
As seen from the table, the filament temperature should be above 2500 K to provide a
beam current close to 2 A, in order to produce x-ray flux similar to synchrotron source. The calculation of beam current using Richardson’s equation slightly differs from those calculated from emissivity (Table 4-3).
4.2.2 Filament circuit current
The total electric current into the filament could control the desired filament temperature. Assuming all Joule heating of the filament due to circuit current is re-emitted from the filament surface via heat radiation; one may equate the total Joule heating into the
) T T ( A A I P 4 0 4 S T T
2ρ = σ σ −
= l
Where,
ρT
: electric resistivity of the filamentA : filament emission area
σT
: emissivity of equivalent blackbodyσs : Stefan’s constant ( 5.67×10⁻¹² w/cm2k4 )
T : filament temperature
T0 : temperature of surroundings
The surrounding temperature T0 may be neglected with respect to the filament
temperature (T > 1000oK). For the design parameters of the concentric tungsten filament, the circuit current was calculated for a temperature range between 300 and 2800 oK as shown in Table 4-4. The filament circuit current provides a means by which the beam current is controlled. Combining Tables 4-3 and 4-4 provides a relationship between filament circuit
current and electron beam current as shown in Table 4-5.
Table 4- 4 Filament temperature versus circuit current
Temperature [ K ]
Emissivity [A/cm2]
Circuit current [ A ]
Temperature [ K ]
Emissivity [A/cm2]
Circuit current [ A ]
1500 0.192 0.448 2100 0.270 1.037
1600 0.207 0.526 2200 0.279 1.160
1700 0.222 0.617 2300 0.288 1.288
1800 0.236 0.714 2400 0.296 1.420
1900 0.249 0.815 2500 0.303 1.557
Table 4- 5 Filament circuit current versus beam current
Temperature [K]
Circuit current [A]
Beam Current
[A]
Temperature [K]
Circuit current [A]
Beam Current
[A]
1500 0.448 5.66E-07 2100 1.037 0.0243
1600 0.526 5.74E-06 2200 1.160 0.0824
1700 0.617 4.39E-05 2300 1.288 0.252
1800 0.714 2.77E-04 2400 1.420 0.719
1900 0.815 1.41E-03 2500 1.557 1.85
2000 0.924 6.20E-03 2600 1.708 4.44
It is worthy to mention that higher beam currents in the range of 2-3 A are required for an industrial scale DEI system, which will necessitate active target cooling. However, for
the proof-of-principle experiment, lower beam currents will be used to obtain experimental results on beam uniformity and distribution on the target. Experimental results at low beam currents are scalable to industrial scale device with active target cooling.
4.3Simulations Results
4.3.1 Electron trajectory simulation
Electron trajectories for the concentric filament-target assembly are simulated using the SIMION code with several options. These options allow for varying electric field configuration by either biasing or floating the base of the filaments’ cup (backing plate). The
to shape electron distribution and their trajectories. The filament, in most x-ray tubes, usually has a common connection with the focusing cup such that the cup is at negative potential and
the filament is positive with respect to the cup. Figure 4-8 illustrates a standard x-ray filament cup with unbiased and biased connections.
Figure 4- 8 Illustration of standard unbiased and biased x-ray filament cup
For the concentric filament design, the filament supply is floating, however, if desired one of the filament’s lead may be connected to the focusing cup such that they together work as a cathode, or the filament may have a high voltage connection different from the cup
potential and its supply current floats on top of this high voltage biasing. This design configuration allows for various filament-cup options. Figure 4-9 illustrates the configuration of the concentric filament and focusing cup assembly.
Figure 4- 9 Configuration of the concentric filament and focusing cup assembly
Simulation of electron trajectories, their distribution at the target, and the take off angle has been carried out using the SIMION 3-D 7.0 charged particles’ optics code. A
-ve Unbiased filament -ve +ve filament bias
-ve -ve
geometry code was written (Appendix I) to provide input to SIMION for the filament and target geometry, potential arrays and filament base cup biasing. The simulation generates the
electric field profiles, fly the electrons from the filament towards the target, and graphically draw their trajectories and distribution. Optimization of electron flux (beam flux) and uniformity of electron distribution on the target for various options were conducted. The
filament cup is named “backing plate” through out this simulation exercises. Optimization would allow for the maximization of electrons landing on the target and minimization of electrons loss due to dispersions. This optimization is necessary to eliminate, or reduce, electron impact on the source housing-chamber, which may result in heat loading of the walls
and generating un-wanted radiation.
The backing plate serves as the focusing cup with various biasing options. An example of electron trajectories without and with the backing plate is shown in Figure 4-10 for a 20o target tile angle, where good control on electrons’ dispersion and better focusing
onto the target could be achieved. Figure 4-11 shows the electrons’ distribution on the target for the backing plate case. The take off angle determines the focal spot size at the x-ray extraction window. In conventional x-ray tubes, small takeoff angles are used since the electron generation is from an approximate spot filament. In the concentric filament concept,
the actual focal spot size is an area on the anode (target), as target illumination in this concept is the entire target surface area. The effective focal length is given by [3]:
Figure 4- 10 Electron trajectories without (a) and with (b) backing plate, the target is at 20o tile angle with respect to the filament assembly
The geometrical configuration of the proof-of-principle experiment allows for a maximum of 22.5o tilt angle. Figure 4-12 is an illustration of the filament and target positions
in the proof-of-principle experiment. The effective focal spot is determined by the takeoff angle, distribution of electrons on the target and the spatial and intensity of the electric field.
Figure 4- 12 Schematic of filament and target positions in the proof-of-principle experiment, a maximum
takeoff angle of θ= 22.5o could be allowed in this geometry
4.3.1.1SIMION simulation options
Simulation options were performed in three different configurations with each option simulated with five takeoff angles, 0, 5, 10, 15, 20 and 22.5 degrees. The first simulation option has floating backing plate and the filament is acting as the cathode at -60 kV. The second option has the filament acting as a cathode and biased at -12V while the backing plate
4.3.1.2Simulation results
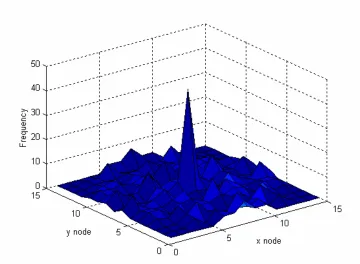
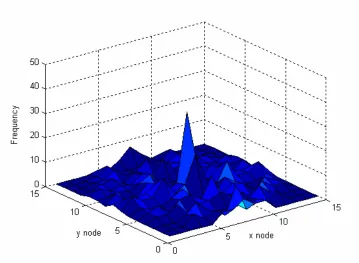
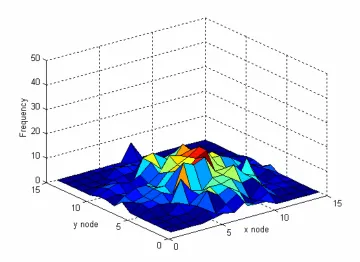
SIMION simulation provides spatial distribution of electrons as they land on the target surface. Axis transformation is required as the target could be tilted to change the takeoff angle. The axis transformation makes it possible to obtain 2-D information from 3-D
data. The results of each axis transformation is shown as frequency distributions along x and y directions. Table 4-6 shows simulation results for Option I (floating backing plate and filament acts as cathode at - 60 kV, for all takeoff angle options. Figures 4-13 through 4-17 show 3-D plots of the frequency versus x and y. This configuration develops a hot spot at the
center of the target for all takeoff angles indicating that a group of electrons are focused on the target at its center, while other electrons are dispersed and fly away towards the interior of the source housing (also seen in Figure 4-11 with a hot spot at the center).
Table 4- 6 Simulation results, floating backing plate, filament at -60kV
5 degree 10 degree 15 degree 20 degree 22.5 degree
node x y x y x y x y x y
Figure 4- 13 Floating backing plate, filament at -60kV, 5 degree target tilt angle
Figure 4- 15 Floating backing plate, filament at -60kV, 15 degree target tilt angle
Figure 4- 17 Floating backing plate, filament at -60kV, 22.5 degree target tilt angle
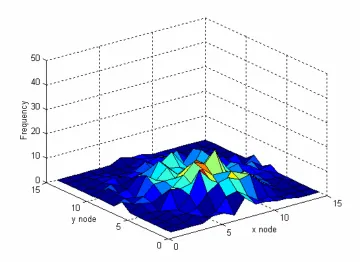
In the second option, where the filament also acts as a cathode and is biased by -12V while the backing plate is at -60kV, the distribution is more uniform and the hotspot moved to lower position of the target surface with increased takeoff angle. However, there is a loss
of electron population and many electrons fly away from the target as a result of diverging electric field between the filament assembly and the target. Although target illumination is uniform and reasonable for the production of an area beam, but the expected x-ray intensity will be low. Table 4-7 shows the simulation results, and Figures 4-18 through 4-22 shows
intensity, however, the target thermal loading would be very high. Increasing the beam current could be accomplished by increased thermionic emission from the filament, which
may lead to either shorter filament lifetime or filament failure at high temperatures; or by increasing the acceleration potential at same beam current, which makes the entire system impractical.
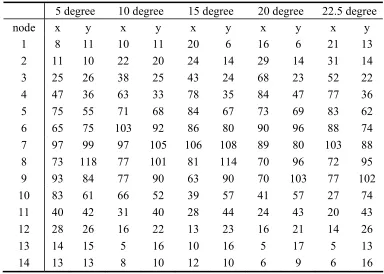
Table 4- 7 Simulation results, Filament at -12V, backing plate at -60 kV
5 degree 10 degree 15 degree 20 degree 22.5 degree
node x y x y x y x y x y
1 8 11 10 11 20 6 16 6 21 13 2 11 10 22 20 24 14 29 14 31 14 3 25 26 38 25 43 24 68 23 52 22 4 47 36 63 33 78 35 84 47 77 36 5 75 55 71 68 84 67 73 69 83 62 6 65 75 103 92 86 80 90 96 88 74 7 97 99 97 105 106 108 89 80 103 88 8 73 118 77 101 81 114 70 96 72 95 9 93 84 77 90 63 90 70 103 77 102 10 83 61 66 52 39 57 41 57 27 74 11 40 42 31 40 28 44 24 43 20 43 12 28 26 16 22 13 23 16 21 14 26
13 14 15 5 16 10 16 5 17 5 13
Figure 4- 18 Filament at -12V, backing plate at -60 kV, 5 degree target tilt angle
Figure 4- 20 Filament at -12V, backing plate at -60 kV, 15 degree target tilt angle
Figure 4- 22 Filament at -12V, backing plate at -60 kV, 22.5 degree target tilt angle
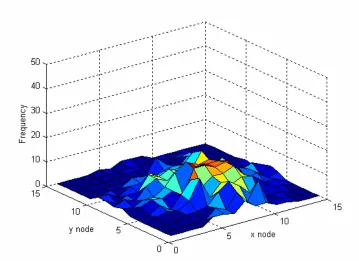
In the third option, where the filament also acts as the cathode at -60kV but also
connected to the backing plate, the entire source assembly acts as a traditional x-ray source except that the thermionic emission is a large-area emission versus the spot emission of conventional sources. In this configuration, there is a peak at the center of the target for all
takeoff angles. However, the electron trajectories are focused towards the target and few electrons are diverged away, which results in less background radiation. The intensity of generated x-rays will be high and sufficient for DEI application. The hotspot, if to select this option, could be filtered out via x-ray optics or by further optimization in this configuration
Table 4- 8 Simulation results, Filament at -60kV, backing plate at -60 kV
5 degree 10 degree 15 degree 20 degree 22.5 degree
nod x y x y x y x y x y
1 18 17 18 16 18 17 18 16 18 16 2 43 36 47 37 57 32 49 34 49 34 3 79 68 83 68 79 65 89 64 89 64 4 68 69 62 66 56 68 54 67 54 67 5 74 83 83 81 87 80 81 81 81 81 6 61 74 56 76 56 77 58 78 58 78 7 135 103 138 102 154 99 131 97 131 97 8 107 113 104 112 94 108 107 106 107 106 9 76 75 76 76 74 77 72 78 72 78 10 58 84 59 83 59 82 60 83 58 83 11 75 69 70 66 66 67 50 65 52 65 12 63 66 67 66 51 64 66 64 66 64 13 35 36 25 37 31 32 35 34 35 34 14 18 17 15 16 3 18 13 16 14 16
Figure 4- 24 Filament at -60kV, backing plate at -60 kV, 10 degree target tilt angle
Figure 4- 26 Filament at -60kV, backing plate at -60 kV, 20 degree target tilt angle
4.3.2 Target thermal analysis
The impact of the electron beam on the target produces target heating and may raise the target’s temperature beyond the melting point. In the target, the main heat transfer is conduction, although the target would re-emit heat via radiation at a slow rate as the entire
source is under vacuum. Convective heat transfer could also be ignored in the analysis since the system is under vacuum, 10-6 Torr, and there is no flow regime to allow for efficient convection. The target material properties and its geometrical shape are important factors in heat conduction analysis. The target is a thin layer of molybdenum on top of oxygen-free
cylindrical copper block. Molybdenum melting point is 2623oC while it is much lower for copper (1085oC), and thus the copper block will reach melting if heat loading is intensive. The thermal resistance of the thin molybdenum layer could also be ignored with respect to the copper block.
Electron heat flux
The accelerated electrons lose their kinetic energy upon their impact on the target, which will be transferred to target heating, as almost 99% of the kinetic energy will be
converted to heat. For molybdenum, only 0.25 % of the incoming electrons contribute to the production of x-rays. The heat flux could be expressed in terms of the beam current density:
× × = − eV J electron eV E Coulomb electrons Amperes Coulomb Ampere I H BC 19
18 1.602 10
10 25 . 6 sec / ) ( ) / (J s E I
H = BC
Thermal resistance of target material
The thermal resistance of the target could be approximated to simple slab geometry
and assumed to be that of the copper block due to the fact that the molybdenum layer is very thin (molybdenum, about few micrometers, is a layer prepared by sintering on the surface of the copper block). The thermal resistance in the simple slab geometry is given by
c Ak
b
R=
where, b is thickness, A is the area of slab geometry, and kc is the thermal
conductivity of the slab material. The thermal conductivity of molybdenum is about a factor of 4 higher than that of copper, and thus the thermal resistance of molybdenum is very small
compared to the copper block and is neglected in this analysis.
In order to perform thermal analysis, electron beam energy and beam profile at the surface of the target must be used as inputs to the thermal analysis code. This code is an
in-house code written by Professor J.M. Doster and can run cases for various geometry and beam profiles. The choice of beam profile is based on the results of the preceding section of SIMION code results. The third option, where the filament acts as the cathode at -60kV and is connected to the backing plate such that the backing plate is also at -60 kV, was chosen as

![Figure 2- 5 Monochromatic beam flux in the NSLS X15A hutch using silicon [1,1,1],[3,3,3],[4,4,4] ,and [5, 5,5] crystal-diffraction planes (Ref.: Z](https://thumb-us.123doks.com/thumbv2/123dok_us/1732334.1221293/25.595.140.474.107.347/figure-monochromatic-nsls-hutch-silicon-crystal-diffraction-planes.webp)