XIONG, KAIQI. Resource Optimization and Security in Distributed Computing. (Under the direc-tion of Professor Harry Perros.)
With the number of e-Business applications dramatically increasing, service level agree-ments (SLA) will play an important part in distributed service computing. An SLA is a combination of several quality of service (QoS) metrics, such as security, performance, and availability, agreed between a customer and a service provider. Due to the complexity of these metrics, most existing research typically addresses only one of these QoS metrics. In the case of the response time as a performance metric, the average time to process and complete a job is typically used in the litera-ture. However, this may not be of real interest to a customer. A statistically bounded metric, that is, a percentile response time, is more realistic than the average response time. Moreover, in enterprise service computing, customer requests are typically distinguished by different request characteristics and service requirements.
This dissertation includes a study of trustworthiness, percentile response time, service availability, and authentication among service stations or sites that may be owned by different ser-vice providers. The first part of this dissertation contains an analysis of percentile response time, which is one of the most important SLA metrics. Effective and accurate numerical solutions for the calculation of the percentile response time in single-class and multi-class queueing networks are obtained. Then, the numerical solution is incorporated in a resource allocation problem. Specifi-cally, we present an approach for the resource optimization that minimizes the total cost of computer resources required while preserving a given percentile of the response time.
by
Kaiqi Xiong
A dissertation submitted to the Graduate Faculty of North Carolina State University
in partial fulfillment of the requirements for the Degree of
Doctor of Philosophy
Computer Science
Raleigh, NC
2007
Approved By:
Dr. David Thuente Dr. Matthias Stallmann
Dedication
Biography
Acknowledgements
I would like to express my sincere appreciation to Dr. Harry Perros for being an adviser and friend. I am very thankful to him for his understanding, guidance, and encouragement during the process of my studies and thesis writing. He was very supportive and always available whenever I wanted to meet him. I very much enjoyed working with him.
I would like to thank Dr. David Thuente, Dr. Matthias Stallmann and Dr. Mihail De-vetsikiotis for being in my committee and for giving me valuable comments and suggestions. I am specially thankful to Dr. David Thuente for his great help and support as Director of Graduate Programs. I also want to thank Dr. Matthias Stallmann and Dr. Mihail Devetsikiotis in devoting their time to helping me when needed.
Contents
List of Figures vii
List of Tables viii
1 Introduction 1
1.1 Motivation . . . 1
1.2 The Problems . . . 3
1.3 Summary of Contributions . . . 7
1.4 The Organization of this Dissertation . . . 8
2 Related Work 9 2.1 Service Availability . . . 9
2.2 Trustworthiness . . . 11
2.3 Performance . . . 12
2.4 The Resource Optimization Problem Subject to an SLA . . . 14
2.5 Public Key Cryptography-based Authentication . . . 15
3 Single Class Customers 18 3.1 The Percentile of Response Time . . . 18
3.2 A Resource Optimization Problem for Service Models with Single Class Customers 20 3.3 Approaches for the Resource Optimization . . . 21
3.4 Numerical Validations . . . 26
3.5 The Balanced Condition . . . 29
3.6 An Application: Web Services Performance Modeling and Analysis . . . 34
3.6.1 A Web Services Performance Model . . . 35
3.6.2 Analysis of the Web Services Performance Model . . . 36
3.6.3 A Numerical Validation . . . 40
3.7 Concluding Remarks . . . 42
4 Multiple Class Customers 44 4.1 The SLA Performance Metric in the Case of Multiple Class Customers . . . 45
4.3 Approaches for Resource Optimization . . . 46
4.3.1 The LSTs of Response Time Distributions for Two Priority Customers . . . 46
4.3.2 Algorithms for the Resource Optimization Problem . . . 50
4.4 Numerical Validations . . . 56
4.5 Concluding Remarks . . . 61
5 A Trustworthy Service Model 63 5.1 The Trust-based Resource Optimization Problem . . . 64
5.2 A Framework for Solving the Trust-based Resource Provisioning Problem . . . 66
5.3 The Calculation of SLA Metrics . . . 70
5.3.1 The Trustworthiness of Resource Sites . . . 70
5.3.2 The Percentile Response Time . . . 72
5.3.3 The Service Availability . . . 74
5.4 An Approach for Solving the Trust-based Resource Provisioning Problem . . . 75
5.4.1 Single Class Customers . . . 75
5.4.2 Multiple Priority Customers . . . 81
5.5 Numerical Examples . . . 87
5.5.1 Single Class Customers . . . 88
5.5.2 Multiple Priority Customers . . . 90
5.6 Concluding Remarks . . . 94
6 Performance Analysis of Public Key Cryptograph-based Group Authentication 96 6.1 Public Key Cryptography-based Authentication . . . 97
6.2 PKCROSS and PKTAPP . . . 98
6.2.1 Protocol Analysis . . . 99
6.2.2 The Calculation of the Response Time via Queueing Networks . . . 102
6.3 A New Group Authentication Technique Using Public-Key Cryptography . . . 107
6.3.1 A Single Remote Realm . . . 108
6.3.2 Multiple Remote Realms . . . 111
6.4 Performance Evaluation of the New Proposed Technique . . . 113
6.4.1 The Operations of Encryption and Decryption . . . 113
6.4.2 The Calculation of the Response Time via a Queueing Network . . . 116
6.4.3 Discussions . . . 119
6.5 Concluding Remarks . . . 120
7 Summary and Future Work 121 7.1 Research Summary of the Dissertation . . . 121
7.2 Future Research Directions . . . 123
List of Figures
1.1 The Execution of Service Requests . . . 4
2.1 A Three-node Tandem Network with Overtaking . . . 13
3.1 Percentile Response Time vs. Service Rate . . . 20
3.2 A Tandem-station Service Model for Single-class Customer Services . . . 21
3.3 A Service Model with Feedback for Single-class Customer Services . . . 24
3.4 A Two Station Tandem Model . . . 30
3.5 A Scenario in Web Services Applications . . . 35
3.6 A Web Server Performance Model . . . 37
4.1 A Tandem-station Service Model for Multiple-class Customer Services . . . 50
4.2 A Service Model with Feedback for Multiple-class Customer Services . . . 54
5.1 An SLA-based Web Services Model . . . 65
5.2 A Framework for Solving the Trust-based Resource Provisioning Problem . . . 67
5.3 A Web Services Computing System for Single-class Customer Services . . . 75
5.4 A Web Services Computing System for Multiple-class Customer Services . . . 81
6.1 The PKCROSS Message Flow . . . 99
6.2 The PKTAPP Message Flow . . . 100
6.3 A Queueing Network withmRemote Realms for PKCROSS . . . 103
6.4 A Queueing Network withnApplication Servers for PKTAPP . . . 104
6.5 A Test Scenario with a Remote Realm . . . 105
6.6 Response Time vs. Authentication Request Rate . . . 106
6.7 Crossover Numbers vs. The Number of Remote Realms . . . 107
6.8 The Message Flow of the New Technique in a Single Remote Realm . . . 109
6.9 The Message Flow of the New Technique in Multiple Remote Realms . . . 112
6.10 A Queueing Network withnRemote Realms for the New Technique . . . 117
6.11 Response Times vs. Authentication Request Rates Whenm= 1 . . . 117
6.12 Response Times vs. Authentication Request Rates Whenm= 2 . . . 118
6.13 Response Times vs. Authentication Request Rates Whenm= 8 . . . 118
List of Tables
3.1 The Cumulative Distribution Function (CDF) of the Response Time vs. Service Rate 21
3.2 The Service Rates of the Eight Stations in Model 1 . . . 27
3.3 The Cumulative Distribution of the Response Time in Model 1 . . . 28
3.4 The Optimal Number of Servers in Model 1 . . . 28
3.5 The Service Rates of The Eight Stations in Model 2 . . . 28
3.6 The Optimal Number of Servers in Model 2 . . . 29
3.7 The Cumulative Distribution of the Response Time in Model 2 . . . 30
3.8 The Solutions of Problems I and II with Variedγ . . . 33
3.9 The Solutions of Problems I and II with Variedˆc2 . . . 34
3.10 A Comparison of the Number of Servers by Using Problems I and II . . . 34
3.11 The Cumulative Distribution Functions of The Response Time in the Web Services Performance Model . . . 41
4.1 The Cumulative Distribution of the Low-priority Response Time forλ(1) =λ(2) = 50 58 4.2 The Cumulative Distribution of the Low-priority Response Time forλ(1) = 75and λ(2)= 25 . . . . 59
4.3 The Cumulative Distribution of The High-priority Response Time in Model 1 . . . 59
4.4 The Cumulative Distribution of the Low-priority Response Time in Model 1 . . . . 60
4.5 The Optimal Number of Servers in Model 1 . . . 60
4.6 The Optimal Number of Servers in Model 2 . . . 60
4.7 The Cumulative Distribution of The High-priority Response Time in Model 2 . . . 61
4.8 The Cumulative Distribution of the Low-priority Response Time in Model 2 . . . . 62
5.1 The Initial Trust Index of the Ten Stations for Single Class Customers . . . 88
5.2 The Service Rates of the Ten Stations for Single Class Customers . . . 88
5.3 The Server Unavailability Rates of the Ten Stations for Single Class Customers . . 88
5.4 The Trust Indices of the Ten Stations for Single Class Customers at Timest = t2,· · ·, t5, t20, t21. . . 89
5.5 The Cumulative Distribution of the Response Time for Single Class Customers . . 90
5.6 The Optimal Number of Servers for Single Class Customers . . . 90
5.7 The Initial Trust Index of the Ten Stations for Priority-class Customers . . . 91
5.9 The Server Unavailability Rates of the Ten Stations for Priority-class Customers . . 91
5.10 The Trust Indices of the Ten Stations for Priority-class Customers at Times t = t2,· · ·, t5,· · ·, t20, t21,· · ·, t84, t85 . . . 92
5.11 The Cumulative Distribution of the High-priority Response Time . . . 93
5.12 The Cumulative Distribution of the Low-priority Response Time for Priority-class Customers . . . 93
5.13 The Optimal Number of Servers for Priority-class Customers . . . 94
6.1 The Operations of Encryption and Decryption WhennApplication Servers are in mRemote Realms . . . 101
6.2 The computational times of Encryption and Decryption Operations . . . 105
6.3 A Comparison of Analytic and Simulated Response Times . . . 106
6.4 The Notation Used in the Case of a Single Remote Realm . . . 108
6.5 The Additional Notation Needed in the Case of Multiple Remote Realms . . . 112
6.6 The Operations of Encryption and Decryption WhennApplication Servers are in mRemote Realms . . . 113
6.7 The Minimal Number of Application Servers . . . 115
Chapter 1
Introduction
This dissertation is concerned with resource optimization problems subject to various constraints including service availability, performance and security, and the problem of public key cryptography-based group authentication. The motivation of our research is discussed in Section 1.1, the formulation of the optimization problems subject to various constraints is given in Section 1.2, and the performance of public key cryptography-based group authentication is presented in the same section as well. Section 1.3 summarizes the contributions of our research, and Section 1.4 gives the organization of this dissertation.
1.1 Motivation
The management of the quality of service is fundamental to a distributed enterprise com-puting system. The increasing pervasiveness of network connectivity and the proliferation of on demand e-business applications and services in public domains, corporate networks, as well as home environments, give rise to the need for the design of appropriate service solutions. When evaluating how a service provider can support the customer’s requirements of an enterprise, several questions often arise:
• How can a service provider achieve higher return on investment through improved utilization of its existing service resources?
• How can a customer receive its service from a reliable service provider? • How can a customer receive better quality of service at a lower fee?
• How can multiple service providers authenticate each other such that they can work together to provide the quality of service for a customer?
• How does the process of authentication among service providers affect the overall quality of service?
Accurately predicting e-business application performance based on system statistics and a customer’s perceived quality allows a service provider not only to assure the quality of service, but also to avoid over provisioning to meet a service level agreement (SLA).
An SLA sets the expectations between a customer and a service provider, and helps define the relationship between these two parties. It is the cornerstone of how the service provider sets and maintains commitments to the customer. Usually, an SLA is a set of quality of service metrics and a price agreed between a customer and a service provider. It plays an important role in an e-business application. The set of the quality of service metrics generally consists of availability, security, and performance that are defined below:
• Availabilityis the percentage of time that a service provider can offer services. Capabilities in the availability component are determined by the resiliency of the environment of service re-sources. They are related to recovery mechanisms, and data replications that improve service survivability.
• Performanceincludes QoS metrics related to the underlying network that interconnects the resource sites, such as, throughput, link utilization, packet loss rate, and end-to-end transfer delay. It also includes similar QoS metrics for the resource sites, such as, response time and throughput. The response time is the time it takes for a service request to be satisfied, and the throughput is the service rate that a service provider can offer.
Customers will receive higher levels of quality of services if they are willing to pay more. Therefore, having different SLAs with different associated costs is a common practice approach.
This dissertation will focus on resource optimization whereby a service provider uses the least resources at each service station but it is still able to achieve the pre-defined SLA. These resources may include servers, storage devices, routers, network links, processors and so on (e.g., see [57] and [91]). It also presents a study of performance of public key cryptography-based group authentication.
1.2 The Problems
In this dissertation, we consider a collection of computer resources used by a service provider1to host enterprise applications for business customers. An enterprise application running
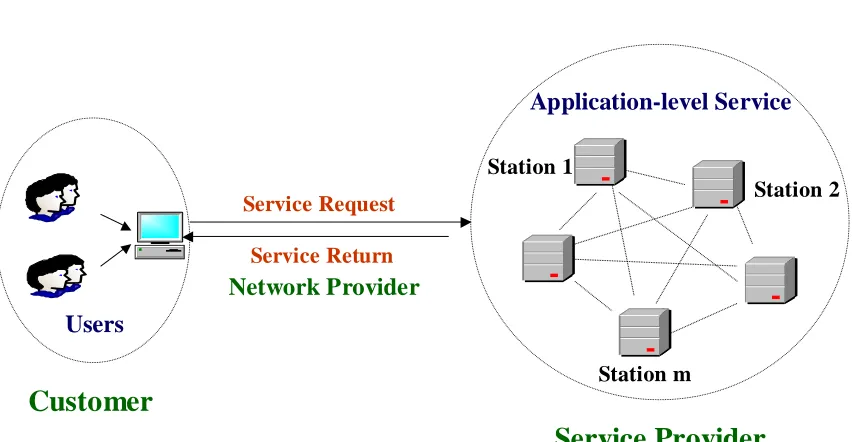
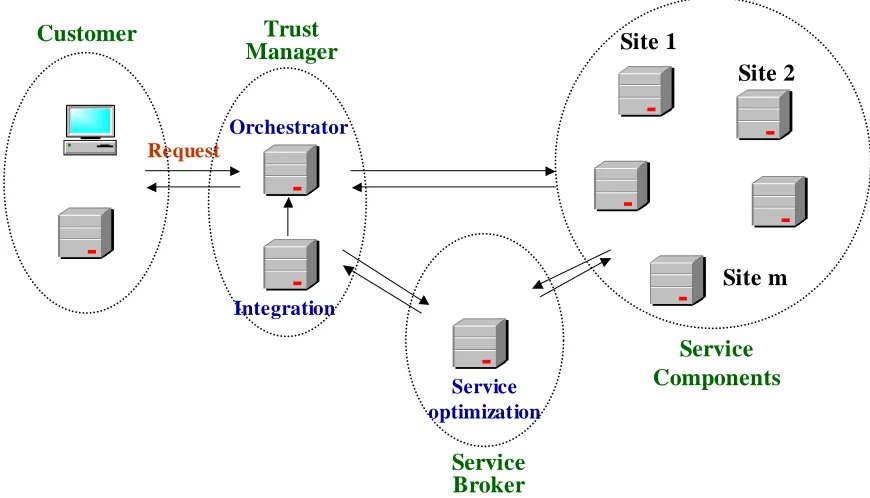
in such a computing environment is associated with an SLA (see [54], [19] and [66]). That is, the service provider is required to execute service requests from a customer within negotiated QoS requirements for a given price. Figure 1.1 depicts a scenario for such an environment. A customer represents a business that generates service requests at a given rate to be processed by the service provider’s resource stations according to QoS requirements and for a given fee. As shown in Figure 1.1 a service request is transmitted to the service provider over a network provider. After it is processed at the various resource stations of the service provider the final result is sent back to the customer. For presentation purposes, we assume that each resource station has only one type of server associated with costcj. If they have multiple types of servers, we can decompose each
resource station into several individual stations so that each one only contains one type of server with the same cost.
LetNj be the number of servers at stationj(j = 1,2,· · ·, m). Thus, the resource allo-1The computer resources may or may not owned by the service provider. The service provider may only act as a
Service Provider
Customer
Station 1
Station m
Station 2
Users
Application-level Service
Service Request
Service Return
Network Provider
Figure 1.1: The Execution of Service Requests
cation is quantified by solving fornj (nj = 1,2,· · ·, Nj) in the following optimization problem:
I = min
n1,···,nm
(n1c1+· · ·+nmcm) (1.1)
subject to SLA constraints. Performance and price are the two most important components for a variety of SLAs for business applications. Hence, in this dissertation, we first consider the mini-mization of the overall cost of the service provider’s computing resources allocated to a multi-class business customer so that γ% of the time the response time, i.e., the time to execute a service request, is less than a pre-defined value.
In enterprise computing, customer requests often need to be distinguished, with different request characteristics and customer’s different service requirements. In this dissertation, we further consider a set of computer resources used by a service provider to host enterprise applications for differentiated customer services subject to an SLA.
r1, r2 = 1,2,· · ·, R), while customers of the same type are served in order of arrival (or FIFO). Then, it is said that the single queue operates according to a priority discipline withRclasses.
In this dissertation, we consider a preemptive-resumepriority discipline, that is, the ser-vice of a classr2 customer can be interrupted if a higher-priority customer of classr1 (r2 > r1) arrives during its service. The interrupted customer resumes its service from where it stopped after the higher-priority customer, and any other customer with priority higher thanr2 that may arrive during its service, complete their service. There are many other situations of practical interest (in the fields of modern computer systems, communication networks, computer server maintenance, and computer security checking, for example) in which the order of servicing is determined by preemptive-resume.
Second, we present an approach for the resource optimization that minimizes the total cost of computer resources required while preserving a given percentile of the response time for priority-class customers. We calculate the number of servers in each resource station that minimize a cost function that reflects operational costs.
Web services technology was introduced as a major component of .NET technology by Microsoft in June of 2000, and it is widely considered as an emerging paradigm for the next gen-eration of Internet computing (Zhang et al. [97]). Web services technology has become the most popular computing paradigm for e-business applications and distributed environments. Many com-panies such as Google and Amazon are boosting their traffic using Web services APIs (Menasce 2004 [63]). By adopting service-oriented architectures (SOAs), services components from several universal service providers can be flexibly integrated into a composite service regardless of their location, platform, and execution speed (Barry [9], and Singh and Huhns [84]). In this type of en-terprise service applications, service resources may be located in different places. Thus, security becomes a big concern. Hence, our study further addresses how to choose reliable resource stations from a customer’s perspective.
In Chapter 5 of the dissertation, we further consider a trust-based resource allocation problem which typically arises in the aforementioned Web services applications. We formulate the trust-based resource allocation problem as an optimization problem under the SLA constraints: trustworthiness, performance and availability.
As discussed above, a trust model is suggested to establish the relationship between a customer and a service provider. However, receiving a reliable service response heavily depends on the security of the chosen service stations. When these chosen service stations are not secure, they can not provide reliable services for the customer. Authentication is the process of reliably verify-ing the identity of someone or somethverify-ing. It is an essential part in enterprise service computverify-ing. Authentication must be done before or with data communication.
Kerberos [52] consists of a client, an application server and a key distribution center (KDC). It is a mature, reliable, secure network authentication protocol that allows a client to prove its identity to a server without sending confidential data across the network. Public key cryptogra-phy has been extended to support Kerberos, since it simplifies the distribution of keys in Kerberos. It eliminates a single point of failure. Integrating public key cryptography into Kerberos represents the enhancements of the current Kerberos standard. Several Kerberos-based authentication tech-niques using public-key cryptography have been proposed in the last decade. Among them include Public-Key Cross Realm Authentication in Kerberos (PKCROSS) [46] and Public-key Cryptogra-phy for Initial Authentication in Kerberos (PKINIT) [99]. Moreover, the scalability of network security infrastructures is becoming a serious concern as the explosive growth of collaborative ap-plications such as Web services continues unabated. Public key based Kerberos for Distribution Authentication (PKDA) [85] and Public Key Utilizing Tickets for Application Servers (PKTAPP, a.k.a. KX.509/KCA) [53] and [61] have been proposed to enhance the security and scalability of Kerberos. But, the actual costs (e.g., computational and communication times) associated with these techniques have been poorly understood so far. It remains unknown which technique performs bet-ter in a large network where there are multiple KDC remote realms. Both PKCROSS and PKTAPP use variations of PKINIT message types and data structures for integrating public key cryptogra-phy with Kerberos in different authentication stages. PKTAPP was originally introduced as PKDA. It implemented PKDA using the message formats and exchanges of PKINIT. Hence, this research only considers these two notable techniques: PKCROSS and PKTAPP.
tech-niques shows that PKTAPP does not scale better than PKCROSS. Thus,we propose a new public key cryptography-based group authentication technique. Our performance analysis demonstrates that the new technique can achieve better scalability as compared to PKCORSS and PKTAPP.
1.3 Summary of Contributions
The contributions of this dissertation are summarized below:
• End-to-end response time: The calculation of the response time often becomes critical in solving the resource optimization problem. Existing work addressing resource allocation uses the average response time (or average execution time). Though the average response time is relatively easy to calculate, it does not address the concerns of a customer. Typically, a customer is more inclined to request a statistical bound on its response time than an average response time. To obtain the statistical bound on its response time we need to calculate the probability density function of the end-to-end response time which is not an easy task in a complex computing environment involving many computing nodes. We develop effective and accurate numerical solutions of this probability density function in both a tandem queueing network and a queueing network with feedback. which we then incorporated in this resource allocation problem.
• Multi-class queueing networks: In enterprise computing, customer requests often need to be distinguished, with different request characteristics and service requirements. Imposing a priority structure with preemption-resume is one way to implement a service for satisfying multiple class customer requests. However, it is difficult to calculate the probability density function of an end-to-end response time even for a single node in the case of multiple priority customers. In our study, we first develop an efficient and accurate numerical solution for inverting the Laplace-Stieltjes transforms (LSTs) of a multi-class priority customer’s response time numerically at a single node, and then extend the result to multi-class queueing networks under our study. A contributing factor is that typically we are interested in values of the cumulative distribution of the response time that correspond to very high percentiles for which our approximate results seem to have a very good accuracy.
price. It is not easy to solve resource allocation problem when we consider all the constraints of trustworthiness, an end-to-end response time and service availability. We provide an ef-ficient approach to solving the trust-based resource optimization problem in Web services whereby we are required to minimize the total cost of service providers under the constraints of trustworthiness, an end-to-end response time and service availability.
• Performance analysis of public key cryptography-based group authentication: Several au-thentication techniques have been proposed in the last decade. But, the actual costs (e.g., computational and communication times) associated with these techniques have been poorly understood so far. It remains unknown which technique performs better in a large network where there are multiple KDC remote realms. Based on complexity analysis and queueing theory, the dissertation proposes a performance methodology that is an effective way to ana-lyze the performance of security protocols and suggests a new group authentication that im-proves the scalability of PKCROSS and PKTAPP. It should be pointed out that the proposed performance method can be extended to analyze other security techniques as well.
1.4 The Organization of this Dissertation
Chapter 2
Related Work
In this chapter, we discuss existing approaches to addressing SLA metrics including ser-vice availability, trustworthiness, performance, and public key cryptography-based group authenti-cation. Then, we provide a review of how a resource optimization problem subject to an SLA is solved in the literature.
The chapter is organized as follows. Section 2.1 gives the definition of service availability and describes its measure methods. The characteristics of trustworthiness and performance metrics is presented in Sections 2.2 and 2.3. Section 2.4 gives a literature review of the resource optimization problem subject to various QoS metrics. The performance of public key cryptography-based group authentication is discussed in Section 2.5.
2.1 Service Availability
availability is defined in Sprint’s SLA and WorldCom’s SLA.
Availability has been extensively studied for a variety of computer systems in the lit-erature. It has been studied to improve dependability for computer and telephone networks in Gray [40]. The dependability can be defined as the property of a system such that reliance can justifiably be placed on the service it delivers, as defined in Barbacci et al. [8]. Systems with high availability tend to have large quorum1sizes and high load. Improving the availability of a system
has been discussed in the literature (e.g., see [3], [59], [71], and [86]). Aiyer et al. [3] studied the availability of non-strict quorum systems and proposedK-quorums that can provide higher avail-ability than the strict quorum systems. Naor and Wool [71] analyzed the load and the availavail-ability of traditional quorum systems.
Brown and Patterson [16] defined a new availability metric to capture the variations of the system quality of service over time. It is defined by the number of requests satisfied per second (or the latency of a request service) and the number of server failures that can be tolerated by a system. In this research, our interest is potential hardware (i.e, servers within each station) failures and their effect on unavailability. To determine this, the service provider who owns these stations needs to understand theM T BF (Mean Time to Failure) of all station components and theM T T R (Mean Time to Recover) for hardware problems for all devices at each station, where M T BF (Mean Time to Failure) is the average time of a server failure, andM T T R(Mean Time to Recover) is the average time for recovering a server at each resource station. M T BF information can be obtained from a hardware provider. For example, it is mentioned in Cisco [26] that MTBF informa-tion is available for all Cisco components and is available upon request to a local account manager. M T T Ris determined by evaluating how quickly a station owner can repair broken servers. It is a major factor of server availability. To improve service availability, it is necessary to reduce the frequency time of failure, as indicated in Brewer [15].
Network availability data may be found in the Internet. For example, the University of Houston maintains current and historical network availability data on a web site [60]. CSCO [25] presented a formula for the calculation of network availability.
In this dissertation, we consider the percentage of time that a resource is “up” or “down” as a metric, which is the traditional way to define service availability. Then, a two-state Markov chain with the states “up” and “down” is proposed to study the service availability at each service station. The detailed analysis and calculation of the service availability is given in Section 5.3.3 of
Chapter 5.
2.2 Trustworthiness
“Trust” is used to deal with the notion of the trustworthiness. In this dissertation, trust is defined as a firm belief in the competence of a resource station to act as expected. Many researchers have studied the trustworthiness of service entities, and suggested several different trust metrics. Zhang et el. [98], and Ziegler and Lausen [100] classified various trust metrics. Vu et al. [89] proposed a new QoS-based semantic Web services selection and ranking solution using a trust and reputation management and assuming known QoS qualities.
The trustworthiness of resource stations is an indicator of the quality of services provided by these stations based on previous and current job completion experience. It often predicates the future behavior of the quality of services at these stations. Most trust models (e.g., Kamvar et al [49], Lee at al [55] and Richardson et al. [81]) assume that the domain of trustworthiness ranges from 0 to 1, which is considered in this research. In this dissertation, we use a rank and a threshold-based approach. That is, according to the trust information of each station maintained by the trust manager, our study addresses how the trust manager selects service stations using a rank and threshold based approach. The rank-based approach is to rank the trustworthiness of all sites who provide the same type of services, such as EigenRep in Kamvar et al. [49]. A threshold-based approach is to choose any of those service sites who can meet trust requirements predefined by customers. For example, if the trustworthiness of a service site is over 0.9 and the predefined trust requirement of a customer is 0.9, then the trust manager can select the site to serve the customer’s service request. The relationship between the rank and the threshold based approaches are discussed in Zhang et el. [98].
Our study introduces a trust manager who represents customers. The trust manager uses the collected trustworthy information of the resource stations to evaluate their security behavior. We consider security behavior by modeling the behavior trusts of all sites, and quantify the trustwor-thiness of these stations. This approach is based on previous job completion experience assessed by the trust manager and customers. There often exist multiple trust managers in today’s complex computer systems. The assessment also adopts the opinion of those trust managers besides its own customer’s feedback. The domain of feedback is also assumed to be [0, 1].
of service provided by those chosen service stations for each service request or for a set of service requests during a certain period of time. These customers only provide feedback about their received services rather than those chosen service sites. (Note that the trust manager’s customer is usually not aware of which service sites process its service request.) The opinion is defined as the information of trustworthiness provided by those trust managers who are neighbors of the trust manager. These neighbors are a small subset of the trust manager’s acquaintances, adaptively selected based on their usefulness. The opinion aggregates the overall impression of those neighborhood trust managers for the service stations. A similar definition is given in Golbeck and Hendler [39], Kamvar et al [49], Lee at al [55], Mui at al [67], and Richardson et al. [81].
In this research, we consider all these factors by combining the feedback of the trust man-ager’s customers and the opinions of neighborhood trust managers with the past trust information of the trust manager. The detailed discussion of updating the trust information for each station will be discussed in Section 5.2 of Chapter 5.
2.3 Performance
The SLA performance metric defined in Section 1.1 includes throughput andresponse time. As an end user, a customer is in general concerned about response time rather than throughput. So, in the dissertation we only consider the percentile of the response time as the performance metric. This is the time it takes for a service request to be executed on the service provider’s multiple resource stations.
To obtain the statistical bound on its response time, i.e., the percentile of the response time, we are required to calculate the probability density function of the response time, whose detailed discussion will be given in Section 3.1 of Chapter 3.
Node 1
Exit
Node 2 Node 3
Figure 2.1: A Three-node Tandem Network with Overtaking
Martin and Nilsson [58] measured the average response time of a service request over IP networks. In [74], Osogami and Wierman analyzed anM/GI/ksystem with two priority classes and a general phase-type distribution and evaluated the optimal number of servers based on overallmean response time. A framework for service management in grid computing was defined in Menasce and Casalicchio [65], but they did not provide a method for calculating the probability distribution of the response time.
pdf of the response time was derived for a closed queueing network in [69], and the passing time distribution was calculated for large Markov chains in [43].
We develop effective and accurate numerical solutions of the probability density function of the response time for a variety of service models under our study, which we then incorporated in this resource allocation problem in Chapters 3 - 5.
2.4 The Resource Optimization Problem Subject to an SLA
Resource optimization problems subject to performance metrics such as response time, throughput, packet loss rate, and link utilization have been extensively studied [1], [14], [13], [36], [58], [65], [73] and [93]. Link utilization is defined as the percentage of the time that the network node is utilized. Packet loss rate is the probability that the packet is lost during transmission through a network since its buffer is full.
The resource optimization problems subject to some of these performance metrics (or QoS metrics) was studied for multiple packet networks in Bouillet, et al. [14], different classes of flows at network nodes in Chassot, et al. [23], IP networks in Martin and Nilsson [58], wireless networks in Aib, et al. [1], and grid computing in Menasce and Casalicchio [65], and optical networks in Nowak, et al. in [73]. Xiong and Perros [93] studied network optimization subject to the percentile of response time, network availability, network utilization and packet loss rate.
These QoS metrics can be estimated by using measurement techniques, see Aikat et al. [2], Allman at al. [4], Gummadi et al. [41] and Sommers et al. [47]. In [23], Chassot et al. dealt with a communication architecture with guaranteed to-end QoS in an IPv6 environment. The end-to-end QoS includes an end-end-to-end delay (i.e., a response time). Chassot et al. only discussed and measured the maximal, minimal and average values of the response time. In [73], Nowak, et al. developed a C++ event driven simulator to measure these three values in optical networks. But, measurement techniques are hard to be incorporated in solving a resource optimization problem with multiple constraints.
closed queueing network. The problem was formulated as an optimization problem in which the average throughput is maximized.
Web services is often contracted through SLAs which typically specify a certain QoS in return for a certain price. Although QoS was not defined in the initial UDDI standard for Web services, many studies have been carried out to extend the initial UDDI, such as WSLA (Keller and Ludwig [50]), WSOL (Tosic et al. [88]), and QML (Dobson [33]). The issue of a reputation-based SLA has been studied by Jurca and Faltings [48] in which the cost is determined by the QoS that was actually delivered.
Resource allocation problems in distributed systems have been widely studied based on one of the metrics: trustworthiness and response time (e.g., see [70]). In Chapter 5 we will con-sider a resource allocation problem in Web services subject to all three QoS metrics, expressed by trustworthiness, percentile response time and service availability.
When we consider all qualities of services consisting of trustworthiness, percentile re-sponse time, and service availability, it becomes extremely difficult to solve a trust-based resource allocation problem whereby a set of computer resources is used by a service provider to host a typical distributed computing application for single-class and multiple-class customer services re-spectively. To the best of our knowledge, our research is the first attempt toward solving the complex problem. We shall formulate the trust-based resource allocation problem as an optimization problem under all these SLA constraints in which we calculated the number of servers in each service sta-tion that minimize a cost funcsta-tion that reflects operasta-tional costs for single-class and multiple-class customer services respectively in Chapter 5.
2.5 Public Key Cryptography-based Authentication
cryptogra-phy, Davis [32] suggested that public key cryptography is best suited to securing communications between servers, between sites, and between organizations.
PKCROSS [46] has been proposed to simplify the administrative burden of maintain-ing cross-realm keys so that it improves the scalability of Kerberos in large multi-realm networks. Public key cryptography takes place only KDC-to-KDC authentication in PKCROSS. PKINIT and PKCROSS are centralized KDC protocols. Sirbu and Chuang [85] extended these two protocols to create PKDA for improving scalability and addressing the single point of failure on the KDC. PK-TAPP is only a slight variation on the PKDA specification. Both PKDA and PKPK-TAPP use lengthy public-key message exchanges between the client and the application servers, so they may not be anymore efficient than public key enabled authentication once with a KDC and faster secret-key cryptography for subsequent encryption with application servers [42]. PKTAPP is also known as KX.509/KCA [35] and Windows has its own protocol which is the equivalent to KX.509/KCA (see Altman [6]). Although the evolution of PKTAPP, its protocol structure has not been dramatically changed. We believe that PKCROSS and PKTAPP will revive soon. The Kerberos Consortium at MIT was just formed in 2007 and listed PKCROSS as Project 10 in its proposal [28].
Chapter 3
Single Class Customers
This chapter gives the definition of the percentage of response time with an illustrative example, and discusses a resource optimization problem subject to the percentile of response time and a fee for service models with single class customers. We calculate the number of servers in each resource station that minimize a cost function that reflects operational costs. We first analyze an overtake-free open tandem queueing network, and then we extend our work to an open tandem queueing network with feedback. The chapter is mainly based on the results presented in Xiong and Perros [95], and Xiong in [92].
The rest of the chapter is organized as follows. In Section 3.1 we define the SLA perfor-mance metric considered in this chapter. Section 3.2 formulates the resource optimization problem. In Section 3.3, we present two typical real-life models and propose an approach for solving the opti-mization problem. In Section 3.4, numerical simulations demonstrate the applicability and validity of the proposed approach. Finally, the conclusions are given in Section 3.7.
3.1 The Percentile of Response Time
of multiple computing nodes.
Assume thatfT(t)be the probability distribution function of a response timeT. TDis a
desired target response time that a customer requests and agrees with its service provider based on a fee paid by the customer. The SLA performance metric that aγ%SLA service is guaranteed is as follows.
Z TD
0
fT(t)dt≥γ% (3.1)
That is,γ%of the time a customer will receive its service in less thanTD.
As an example let us consider anM/M/1 queue with an arrival rateλand a service rate µ. The service discipline is FIFO. The steady-state probability of the system is
p0 = 1−ρ, and
pk= (1−ρ)ρk, k >0
whereρ= λ µ.
The response time T is exponentially distributed with the parameterµ(1−ρ), i.e., its probability distribution function is given by (see [12] and Perros [76])
fT(t) =µ(1−ρ)e−µ(1−ρ)t
Using the definition given in (3.1), we have that
Z TD
0
fT(t)dt= 1−e−µ(1−ρ)T D
≥γ% (3.2)
or
µ≥ −ln (1−γ%)
TD +λ (3.3)
This means that in order to guarantee higher SLA service levels,µincreases whenTD decreases.
Similarly, for any given arrival rate λ and service rateµ, we can use (3.2) to find the percentile ofγ.
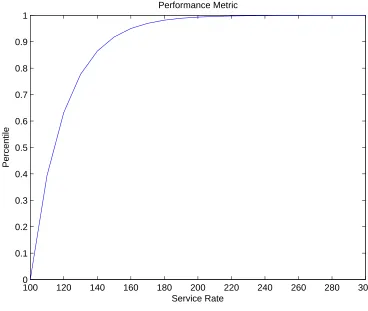
For example, whenλ= 100andTD = 0.05, Figure 3.1 gives the cumulative distribution
100 120 140 160 180 200 220 240 260 280 300 0
0.1 0.2 0.3 0.4 0.5 0.6 0.7 0.8 0.9 1
Service Rate
Percentile
Performance Metric
Figure 3.1: Percentile Response Time vs. Service Rate
3.2 A Resource Optimization Problem for Service Models with Single
Class Customers
In this section, we consider the minimization of the overall cost of the service provider’s computing resources allocated to the single class customer so thatγ%of the time the response time, i.e., the time to execute a service request, is less than a pre-defined value. Based on Section 3.1, the resource optimization problem can be formulated as the following optimization problem:
Resource Optimization Problem:
Find integersnj (1≤nj ≤Nj;j= 1,2,· · ·, m) in them-dimensional integer
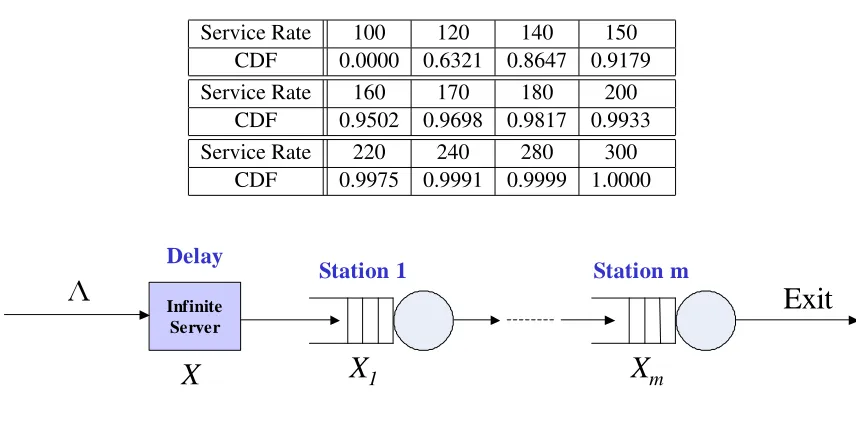
Table 3.1: The Cumulative Distribution Function (CDF) of the Response Time vs. Service Rate
Service Rate 100 120 140 150
CDF 0.0000 0.6321 0.8647 0.9179
Service Rate 160 170 180 200
CDF 0.9502 0.9698 0.9817 0.9933
Service Rate 220 240 280 300
CDF 0.9975 0.9991 0.9999 1.0000
Station 1 Station m
L
X
1X
mInfinite Server
X
DelayExit
Figure 3.2: A Tandem-station Service Model for Single-class Customer Services
service provider.
3.3 Approaches for the Resource Optimization
In this section, we study two queueing network models that depict the path that service requests have to follow through the service provider’s resource stations. These two models are shown in Figures 3.2 and 3.3. We refer to these two queueing models as service models since they depict the resources used to provide a service to a customer.
The first service model consists of a single infinite server andm stations numbered se-quentially from1tom as shown in Figure 3.2. Each stationjis modeled as a single FIFO queue served bynj identical servers, each providing a service at the rateµj. LetΛbe the external arrival
rate to the infinite server, and let λandλj be the effective arrival rates to the infinite server and
stationj(j = 1,2,· · ·, m). We assume that all service times are exponentially distributed and the external arrival to the infinite server occurs in a Poisson fashion.
etc. We only consider a single class of customer in this research.
In the following discussion each station is modeled as a singleM/M/1 queue with arrival rate λj and service rate ψ(nj)µj, where ψ(nj) is a known function of nj and depends on the
configuration of servers at each station. It is non-decreasing and can be inverted, i.e.,ψ−1 exists. For instance, suppose that a station represents a group of CPUs. Then,ψ(n)can be seen as a CPU scaling factor for the number of CPUs from 1 ton. According to [22],ψ(n) =ξlog2n, whereξis a
basic scaling factor from 1 CPU to 2. So,ψ−1(n) =ξ−log2n.
Since the queueing network is overtake-free, the waiting time of a customer at a station is independent of its waiting times at other stations (see [30] and [90]). LetX be the service time at the infinite server andXj be the time elapsed from the moment a customer arriving at stationjto
the moment it departs from the station. Then, the total response time is T =X+X1+X2+· · ·+Xm, and hence the LST (Laplace-Stieltjes transform) of the response timeT is
LT(s) =LX(s)LX1(s)· · ·LXm(s) (3.4) whereLX(s)is the LST of the service timeXgiven by
LX(s) = λ
s+λ (3.5)
andLXj(s)is the LST of the response timeXjat thej-th station given by LXj(s) = ψ(nj)µj(1−ρj)
s+ψ(nj)µj(1−ρj)
, (3.6)
whereρj = ψ(nλjj)µj (j= 1,2,· · ·, m).
From (3.4), (3.5) and (3.6) we have that LT(s) = s+λλΠmj=1
ψ(nj)µj(1−ρj)
s+ψ(nj)µj(1−ρj)
We observe thatfT(t)andFT(t)are usually nonlinear functions oftandnj. Hence, the resource
optimization problem is anm-dimensional linear optimization problem subject to nonlinear con-straints. In general, it is not easy to solve this problem. However , the complexity of the problem can be significantly reduced by requiring that the service rates of the queues in the service model in Figure 3.2 are all equal. That is, we find the optimum value ofn1,· · ·, nmsuch that
calledbalanced utilizationorbalanced condition. (We note that in production lines, it is commonly assumed that the service stations are balanced.)
From the traffic equations:
λ=λj = Λ
forj= 1,2,· · ·, m, we have that the utilization of each station ρj = λj
ψ(nj)µj
= Λ
ψ(nj)µj
Thus we have
ˆ
ai =ψ(ni)µi(1−ρi) =ψ(nj)µj(1−ρj) = ˆaj 4= ˆa,
which impliesnj =ψ−1(ˆa+µjλj)(i, j= 1,2,· · ·, m). Hence, from (3.4) we have
fT(t) =L−1{s+λλ· ˆa m
(s+ ˆa)m},
and subsequently obtain that
FT(t) =L−1{ λ s(s+λ) ·
ˆ
am
(s+ ˆa)m} (3.7)
Consequently,Pmj=1njcj reduces to a function of variableˆadue tonj =dψ−1(ˆa+λj µj )e.
Thus we have the following algorithm for the resource optimization problem. Algorithm 3-1:
1. Findˆain the one dimensional optimization problem:
ˆ
amin ←arg min
ˆ
a FT(t)|t=TD
subject to the constraintFT(t)|t=TD ≥γ%atˆa= ˆamin, whereFT(t)is given by (3.7).
2. Compute integersnj by using
nj =dψ−1( ˆamin
µj(1−ρj)
)e,
and check if1 ≤nj ≤Nj (j = 1,2,· · ·, m) andI ≤CD are satisfied. If yes, the obtained
njis the number of servers required at each station. Otherwise, print “the problem cannot be
Station 1 Station m
L
X
1X
mInfinite Server 1
D
Delay 1
Exit Infinite
Server 2
X
Delay 2
α
1-α
Figure 3.3: A Service Model with Feedback for Single-class Customer Services
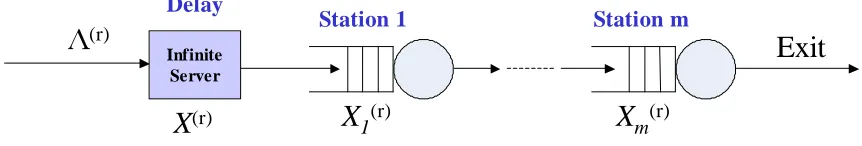
In order to allow for a more complex execution path of a service request, we extended the above model to a service model with feedback, as shown in Figure 3.3. Infinite server 1 represents the total propagation delay within a network provider and infinite server 2 represents the propagation delay within the service provider, i.e. among stations 1 to m. In this figure, a customer upon completion of its service at them-th station, exits the system with probabilityα, or returns to the beginning of the system with probability1−α.
We note that the model shown in Figure 3.3 can be easily extended to a network of queues arbitrarily connected. We reuse the notation in the first model shown in Figure 3.2:Λas the external arrival rate,λd,λandλjas the effective arrival rates to the second infinite server and stationj, and
µj as the service rate at stationj, wherej= 1,2,· · ·, m.
The main difficulty of this resource optimization problem is to findfT(t), the probability
distribution function ofT. We obtain this probability distribution function assuming that the waiting time of a customer at a station is independent of its waiting time at other stations, and each visit at the same stationjis independent of the others. (We note that this assumption of independence does not hold in queueing networks with feedback. However, as will be discussed in the validation section the solution obtained has a good accuracy.) We first have the traffic equations:
λd= Λ, λ= Λ + (1−α)λm, and λj =λ,
which impliesλj =λ= Λ
α, and the utilization of each station is
ρj =
λj ψ(nj)µj =
Λ
αµjψ(nj) (j = 1,2,· · ·, m)
is considered as the sum ofm+ 2random variables
T(k) =D+X+X1+· · ·+Xm,
where we assume that the waiting time of a customer at a station is independent of its waiting times in other visits to the same station. D andX are the service times at the first and second infinite servers respectively, andXj is the time elapsed from the moment a customer arrives at stationjto the moment it departs from it. Then, the total response time is
T =
∞ X
k=0
p(k)T(k),
wherep(k)is the steady state probability that a request will circulatektimes at the infinite station and thej-th station through the computing system.p(k)is determined by
p(k) =α(1−α)k−1
Thus the LST of the response timeT is
LT(s) =LD(s) ∞ X
k=0
p(k)LkX(s)LkX1(s)· · ·LkXm(s), which can be re-written as follows:
LT(s) =
αLD(s)LX(s) Πj=1LXj(s) 1−(1−α)LX(s)Πmj=1LXj(s)
(3.8)
whereLD(s)is the LST of the service timeDgiven by
LD(s) = s+ ΛΛ ,
and replacingLX(s)andLXj(s)(j = 1,2,· · ·, m) by (3.5) and (3.6) in (3.8), we have that
LT(s) =
Λ2Πm j=1ˆaj
(s+ Λ)[(s+λ)Πm
j=1(s+ ˆaj)−(1−α)λΠmj=1aˆj]
(3.9)
To find the response time distributionfT(t), we are required to invert the above LST using
Similarly, we want to find n1,· · ·, nm such that the best utilization of these stations is
achieved, which implies that each station has the same maximal service capacity. That is,
ˆ
ai = ˆaj = ˆa (i, j= 1,· · ·, m)
Then, from equation (3.9) andFT(t) =L−1{L
T(s)/s}we have
FT(t) =L−1{ Λ2aˆm
s(s+ Λ)[(s+λ)(s+ ˆa)m−(1−α)λˆam]} (3.10)
Thus we have the following algorithm for the resource optimization problem in the model shown in Figure 3.3.
Algorithm 3-2:
Steps 1 and 2 are the same as Steps 1 and 2 in Algorithm 3-1 exceptFT(t)given by (3.10).
Note that if we cannot get a solution for the resource optimization problem using Algo-rithm 3-1 (or 3-2), then the service provider cannot execute the service request for the service model 1 (or 3-2) due to at least one of the following reasons:
1. The service provider has an insufficient resource (i.e.,Nj is too small).
2. A pre-specific fee is too low (i.e.,I > CD).
3. A network connection is either too slow or has a problem so that (3.1) cannot be satisfied. Using these information, we may detect and debug either a network problem or a service provider’s capacity problem, or the SLA needs to be re-negotiated.
In Algorithms 3-1 and 3-2, the run-time for Step 2 isO(m). Thus, the run-time of either Algorithm 3-1 or 3-2 is a sum ofO(m), the run-time for inverting the LST of the response time, and the run-time for finding the maxima of the resulting function (orF(t)). While an efficient approach to finding the maxima ofF(t)can be found in [78], inverting the LST of the response time can be easily done by using the methods presented in [40].
3.4 Numerical Validations
Table 3.2: The Service Rates of the Eight Stations in Model 1 Service Rates µ1 µ2 µ3 µ4 µ5 µ6 µ7 µ8
Values 52 18 80 35 41 15 25 35
Two types of errors are introduced in our proposed approximation method. The first, hereafter referred to as Class I error, comes from numerically inverting the Laplace transform. The other, hereafter referred to as Class II error, is due to the assumptions that the waiting time of a customer at each station is independent of the waiting times at the other stations, and it is also independent of its waiting times in other visits to the same station.
The relative error % is used to measure the accuracy of the approximate results compared to model simulation results, and it is defined as follows
Relative error% = Approximate Result−Simulation Result
Simulation Result ×100 (3.11)
We study the accuracy of our proposed approximation method using two examples below.
We first verify the accuracy of our approach for the first service model shown in Figure 3.2. Letm = 8,λ= 100,Nj = 100,cj = 2,ψ(nj) = 1.5log2nj andCD = 400(j = 1,· · ·,8).
The service rates of these eight stations are listed in Table 3.2.
We simulated the queueing network using Arena and the analytical method was imple-mented in Mathematica. The simulation results are considered as “exact” since the simulation model is an exact representation of the queueing network under study.
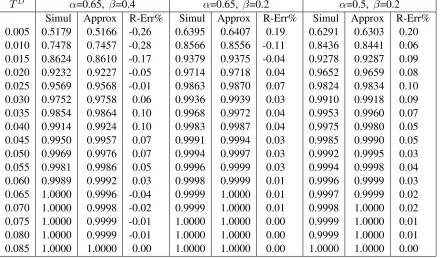
Table 3.3 shows the simulated and approximate cumulative distribution of the response time. In the table, the column labeled “Simul” gives the simulation result, the column labeled “Approx” gives the approximate result, and the column labeled “R-Err %” gives their relative errors. The same abbreviations are also used in Table 3.7. It appears that the results obtained by Algorithm 1 are very accurate. The optimal number of servers required for97.5% of the response time to be less than TD = 0.16 is shown in Table 3.4. The exact optimal number of servers, obtained
by exhaustive search using the simulation model, and assuming that each station has the same utilization, or balanced utilization, is consistent with the ones shown in Table 3.4. Thus,I = 382< CD. We point out that the relative errors shown in Table 3.3 are only due to the Class I error since the Class II error is not present for this service model.
Table 3.3: The Cumulative Distribution of the Response Time in Model 1 Response Time Simul Approx R-Err %
0.04 0.0213 0.0214 0.4393 0.06 0.1517 0.1528 0.7004 0.08 0.4070 0.4075 0.1112 0.10 0.6681 0.6672 -0.1377 0.12 0.8468 0.8450 -0.2158 0.14 0.9398 0.9379 -0.1974 0.16 0.9785 0.9780 -0.0498 0.18 0.9931 0.9929 -0.0157 0.20 0.9979 0.9979 0.0000 0.22 0.9995 0.9994 -0.0077 0.24 0.9999 0.9998 -0.0051 0.26 1.0000 1.0000 0.0000
Table 3.4: The Optimal Number of Servers in Model 1
Station 1 2 3 4 5 6 7 8
#Servers 11 62 5 20 16 84 35 20
The service rates of these eight stations are listed in Table 3.5. Thus it follows from equationλ= Λα
thatλ= 149.25.
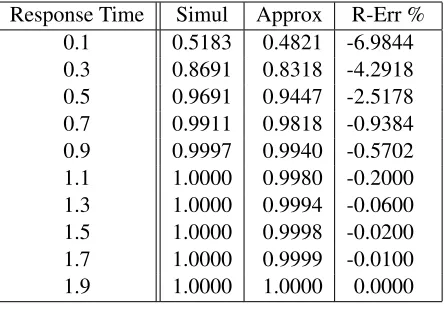
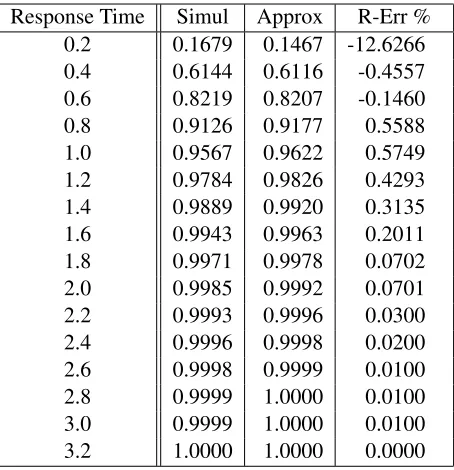
We obtained the cumulative distribution of the response time by solving (3.10) using the package of the inverse Laplace transforms in Graf [40]. Table 3.6 shows the number of servers in the eight stations necessary to ensure the95%SLA guarantee forTD ≤0.6. We also simulated the tandem queueing network and validated using the brute-force approach that these numbers of servers obtained by our approximate method are in fact optimal, provided that each station has balanced utilization. The optimal number of servers is given in Table 3.6. It derives thatI = 560< CD, i.e.,
Step 2) in Algorithm 3-2 is met. Table 3.7 gives the cumulative distribution of the response time
Table 3.5: The Service Rates of The Eight Stations in Model 2 Service Rates µ1 µ2 µ3 µ4 µ5 µ6 µ7 µ8
Table 3.6: The Optimal Number of Servers in Model 2
Station 1 2 3 4 5 6 7 8
#Servers 168 13 4 52 23 62 246 5
obtained using the approximate method and the simulation method, and the relative error%. The relative error comes from both Classes I and II errors. We note that our approximate method has a very good accuracy.
In both two examples as above, the run-time for the approximate method is less than 1 second when Algorithm 3-1 or 3-2 was implemented in Mathematica, and the run-time for the simulation result is less than 1 minute when Arena was used.
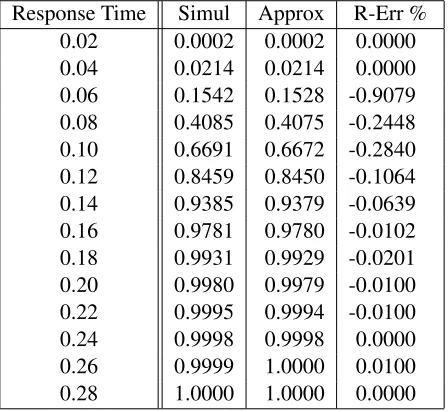
Extensive numerical results point to the fact that the independence assumption has little impact on the accuracy of the results when the number of nodes is large. A contributing factor is that typically we are interested in values of the cumulative distribution of the response time that correspond to very high percentiles for which the approximate results seem to have a very good accuracy through a comparison with simulation results that are considered as “exact.”
Additionally, to the best of our knowledge, this is the first work that provides an analytical solution of the resource optimization problem subject to the constraints of a percentile response time and a price. Hence, we do not give a comparison of our proposed method with other methods in this research.
3.5 The Balanced Condition
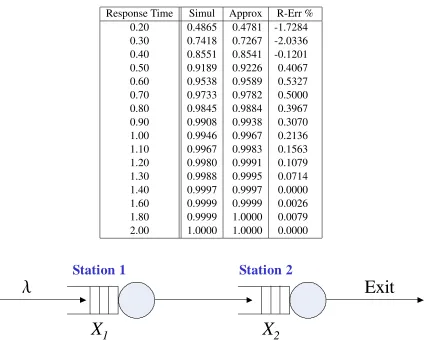
Table 3.7: The Cumulative Distribution of the Response Time in Model 2 Response Time Simul Approx R-Err %
0.20 0.4865 0.4781 -1.7284 0.30 0.7418 0.7267 -2.0336 0.40 0.8551 0.8541 -0.1201 0.50 0.9189 0.9226 0.4067 0.60 0.9538 0.9589 0.5327 0.70 0.9733 0.9782 0.5000 0.80 0.9845 0.9884 0.3967 0.90 0.9908 0.9938 0.3070 1.00 0.9946 0.9967 0.2136 1.10 0.9967 0.9983 0.1563 1.20 0.9980 0.9991 0.1079 1.30 0.9988 0.9995 0.0714 1.40 0.9997 0.9997 0.0000 1.60 0.9999 0.9999 0.0026 1.80 0.9999 1.0000 0.0079 2.00 1.0000 1.0000 0.0000
Station 1
Station 2
l
X
1
X
2
Exit
Figure 3.4: A Two Station Tandem Model
a customer and reduce the potential demand for the service. This means that these entities should collaborate with each other in allocating sufficient resources. Therefore, imposing the balanced condition on all server stations is one of good ways such that these entities are evenly utilized.
obtained form >2.
The LST of the response time is computed by LT(s) = Π2j=1
ˆ
µj(1−ρj)
s+ ˆµj(1−ρj)
whereµˆj =ψ(nj)µj andρj = λµˆjj forj = 1,2. It thus derives the PDF of the response time given
by
fT(t) = αα1α2
2−α1
¡
e−α1t−e−α2t¢
whereαj = ˆµj(1−ρj) = ˆµj−λj forj= 1,2.
Furthermore, the percentile response time given in (3.1) can be rewritten as G(TD) =
Z +∞
TD
fT(t)dt= 1
α2−α1
³
α2e−α1T
D
−α1e−α2T
D´
≤1−γ%.
Again, in order to reduce the amount of unnecessary formalization which would lead to tedious computations giving no new insight into the study, we reformulate the resource optimization prob-lem given in Section 3.2 as
min
ˆ
µ1,µˆ2≥0
(ˆc1µˆ1+ ˆc2µˆ2) (3.12) whereˆcj is the cost at a per unit of service rate in stationjforj = 1,2, under the constraint:
G(TD) = 1
α2−α1
³
α2e−α1T
D
−α1e−α2T
D´
≤1−γ%
which is equivalent to the constraint: G(TD) = 1
ˆ
µ2−µˆ1
h
(ˆµ2−λ2) e−(ˆµ1−λ1)T
D
−(ˆµ1−λ1) e−(ˆµ2−λ2)T
Di
≤1−γ% (3.13) due toαj = ˆµj−λj, whereαj ≥0. Note that by using the traffic equation in queueing theory we
haveλ1 =λ2.
Next, when imposing the balanced condition, i.e.,α1=α2 4=α, we have that LT(s) = α
2
(s+α)2 Thus, the PDF of response time is given by
p(t) =α2te−α t
Since αj = ˆµj −λj and λ1 = λ2 =4 λ, we obtainµˆ1 = ˆµ2 4= ˆµ. Subsequently, the objective function in the resource optimization problem is written as
and the percentile response time constraint can be computed by H(TD) =
Z +∞
TD
p(t)dt= [(ˆµ−λ) + 1]e−(ˆµ−λ)TD ≤1−γ% (3.15) Note thatG(TD)is a function of variablesµˆ
1andµˆ2, andH(TD)is a function of variable
ˆ
µ. To simplify notation, we reuse the notationGandH, and write them asG(ˆµ1,µˆ2)andH(ˆµ), i.e.,G(ˆµ1,µˆ2) =G(TD)andH(ˆµ) =H(TD). Moreover, it is easy to see that
d(H(ˆµ))
dµˆ =−(T
D)2(ˆµ−λ)e−(ˆµ−λ)TD
≤0 (3.16)
due to µˆ ≥ λ, which implies that H(ˆµ) is a decreasing function of variable µ. By consideringˆ
(3.12)-(3.16) we can rewrite the resource optimization problem as follows.
When the balanced condition is not imposed, the resource optimization problem is to find
ˆ
µ1andµˆ2in the minimization problem:
min
ˆ
µ1,µˆ2
(ˆc1µˆ1+ ˆc2µˆ2) (Problem I) subject to
G(ˆµ1,µˆ2)≤1−γ%, andµˆj ≥λj, j= 1,2
whereG(ˆµ1,µˆ2) =G(TD)is given in (3.13).
When the balanced condition is imposed, the resource optimization problem is to find
ˆ
µ= ˆµ1= ˆµ2 in the maximization problem:
arg max
ˆ
µ H(ˆµ)
(Problem II) subject to
H(ˆµ)≤1−γ%, andµˆ≥λ whereH(ˆµ) =H(TD)is given in (3.15).
We are interested in investigating the difference between the solutions of Problems I and II. Let first study the property of these solutions. Assume thatµˆ1 = ˆµ∗1andµˆ2 = ˆµ∗2be the solution of Problem I, denoted by
(ˆµ∗1,µˆ∗2)←(Problem I)