Quantification of uranium-238
in environmental samples using
gamma-ray spectrometry
M. Hult∗, E. Andreotti, R. Gonz´alez de Ordu˜na, S. Pomm´e and E. Yeltepe
EC-JRC Institute for Reference Materials and Measurements Retieseweg 111, B-2440 Geel, Belgium
Abstract
A large number of environmental samples are routinely measured world-wide using gamma-ray spectrometry, some of its assets being easy sample preparation and comprehensive data for many radionu-clides in one analysis. Although other techniques can be considered more suitable for analysing 238U in environmental samples, it is also
routinely done by gamma-ray spectrometry. One mainly uses γ-ray emissions following the decay of the first daughter, 234Th, for
deter-mining the 238U activity. However, the low-energy gamma-rays at
63 keV and 92.5 keV are very difficult to quantify in a robust way due to high attenuation and interferences. This paper quantifies param-eters affecting the possibility of making robust quantification of238U
via234Th using gamma-ray spectrometry. It addresses the use of cor-rect decay data, suitable detectors, optimised sample size, enhanced spectral amplification, correction for peak interferences and control of background.
1.
Introduction
Gamma-ray spectrometry using HPGe-detectors is a widely used technique in laboratories monitoring environmental radioactivity. The possibility to
∗E-mail:[email protected]
quantify the activity of several radionuclides in one single analysis makes it an efficient analytical tool. However, the detection limits for various radionu-clides vary greatly depending on the matrix in which they are. The detection limits of radionuclides emitting gamma-rays of low energy (<100 keV) suf-fer from being in a matrix with other radionuclides emitting gamma-rays of higher energy due to interferences with X-rays and scattered gamma-rays. This is generally the case when quantifying238U in an environmental sample like soil.
Uranium-238 is a primordial radionuclide that is important to monitor. It decays by alpha-decay to234Th, which generates low-energy gamma-rays with very low emission probability. It can be measured with low detection limits using alpha-particle spectrometry and mass spectrometry. However, in order to save time on sample preparation and analysis, it is very common to measure238U using gamma-ray spectrometry [1]. Theγ-ray transitions in 234Th (following the decay of238U) are too weak for this purpose. Instead the
gamma-rays following theβ-decays of234Th (T1/2 = 24.1 d) and its daughter 234Pam (T
1/2 = 1.17 m) are used for identification and quantification of 238U. Care must of course be taken to ensure that secular equilibrium exists
between234Th and238U1.
In pure uranium samples the detection limits (in mBq) are low and the following gamma-rays can be used: 63 keV (doublet), 92.5 keV (dou-blet), 767 keV and 1001 keV. The gamma-rays at 767 and 1001 keV are robust for quantification but due to their low emission probabilities (0.317% and 0.842%, respectively) they are often swamped by the background from other radionuclides in the environmental sample itself. It is thus necessary to use the two low-energy gamma-lines. This introduces several problems that are outlined and quantified in this study, which was initiated through participation in the IAEA-CRP “Benchmarking Calibration for Low-Level Gamma Spectrometric Measurements of Environmental Samples”. The first problem is that the four low-energy peaks appear as two doublets in a “normal” HPGe-detector spectrum. In this paper we will simply re-fer to the two doublet peaks as if they were singlet peaks at 63 keV and 92.5 keV.
1
2.
Analytical considerations
2.1 Use of correct decay data
Numerous measurements of theγ-ray intensities and energies following the decay of 234Th to 234Pa have been performed, and best values were de-rived from evaluations of the available data sets (see [2, 3] and references therein). Apparently the emission probabilities vary significantly from one source to another. For example, for the most intenseγ-ray at 63.290 keV one finds in reference work absolute intensities of 3.75 (8)%2 [2], 3.69 (7)% [3], 4.8% [4], 4.1 (7)% [5], 4.8 (6)% [6], 4.00% [7], 3.7 (2)% [8], 3.6 (1)% [9], 4.1 (7)% [10], 3.7 (4)% [11]. Recent evaluations [2, 3] have to be preferred, as they must have gained accuracy due to the recent measurement of the main peak intensity by Abousahl et al. [12]. The intensities of the other gamma-rays were derived from relative intensity measurements by Godart and Gizon [13] in review [3], while review [2] relied on Chu and Scharff-Goldhaber [14], mainly because in this case the U KX-rays contributions were resolved from the gamma-ray peaks situated in the (90–115) keV energy region. In this paper we use Iγ = 3.75 (8)% [2] for the 63.29 keV emission probability, although it is very common to find recent articles using much higher values, up to 4.8%. The review [2] yields furthermoreIγ(62.88 keV) = 0.016 (4)%, Iγ(92.38 keV) = 2.18 (19)%, Iγ(92.80 keV) = 2.15 (19)%, and Iγ(112.81 keV) = 2.15 (22)% as most relevant additional peaks.
2.2 Use of a suitable detector
It is well-known in some fields of radionuclide analysis, like e.g. safeguards and nuclear fuel studies, that low energy gamma-ray emitters like 234Th, 238-242Pu and 241Am, are best measured using a thin HPGe-detector with
a thickness of only a few mm. However, when measuring 234Th in envi-ronmental samples, one often has to make use of available instrumentations not optimised for the purpose of measuring gamma-rays below 100 keV or to compromise with the detection of other radionuclides emitting gamma-rays with higher energies. In recent years the sales of large volume p-type HPGe-detectors with thin upper deadlayer have increased. Such detectors provide high detection efficiency for gamma-ray energies over a wide range, which to some extent has taken over measurements previously performed with small n-type detectors.
2
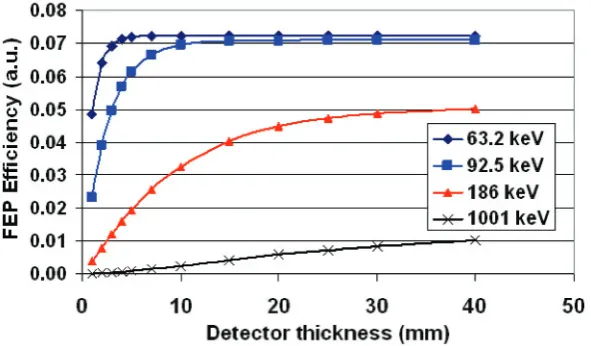
Figure 1: Monte Carlo calculations of the FEP efficiency as a function of the detector thickness for a planar crystal with a radius of 50 mm and a top deadlayer thickness of 0.5μm. The sample was a 40 mm high cylinder of dried soil with density 1.3 g/cm3, located directly on the endcap.
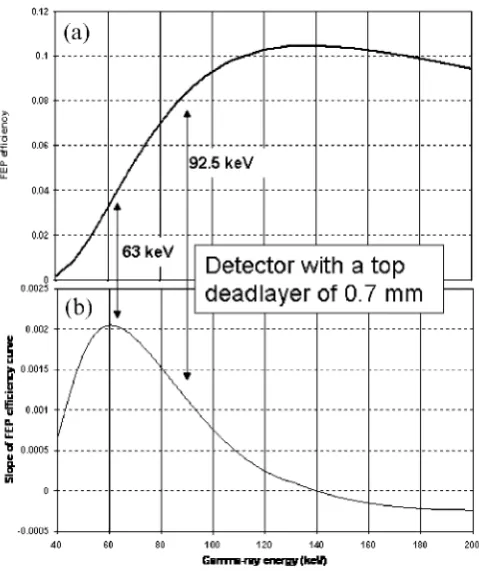
Figure 2: (a) The FEP efficiency for a detector with a thick (0.7 mm) deadlayer and (b) the derivative of the curve in (a). The sample was dried soil with the following atomic composition: H(6), C(5), O(4), Al(4), Si(5) and Fe(1) and 1.5 g/cm3density.
The sample was placed in a Teflon container with 0.2 cm bottom thickness and 5 cm internal radius. The height of the sample was 1 cm. The Teflon container was centered directly on the endcap.
2.3 Optimising the sample
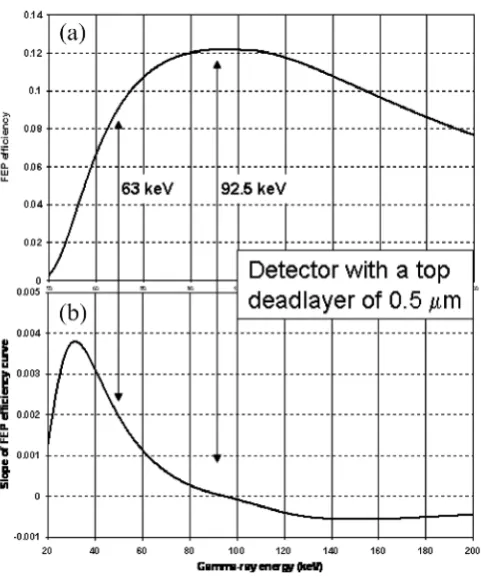
Figure 3: (a) The FEP efficiency for a detector with a thin (0.5μm) deadlayer and (b) the derivative of the curve in (a). The same sample as for figure 2.
2.4 Use of suitable amplification
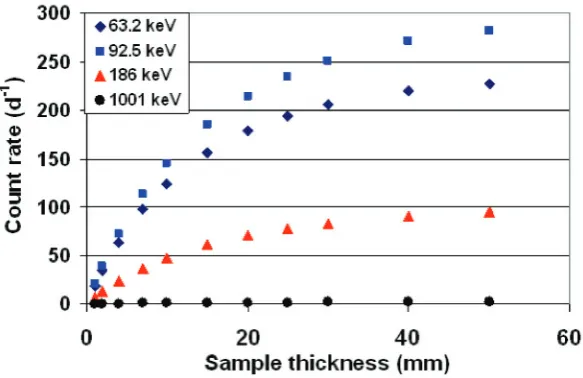
Figure 4: The count rate of four gamma lines for a fixed detector from a sample with density 1.3 g/cm3 as a function of the sample thickness. The assumed massic
activity was 10 mBq/g of238U and226Ra.
The bin-width must also be considered when performing Monte Carlo sim-ulations. At low energies 8 important detector response features need to be resolved in a narrow energy range (within 53 keV in the case of the 63 keV peak). Starting from the highest energy and going down, those features are: (i) the FEP, (ii) single low angle Compton scattering in the sample generat-ing photons that can end up in the FEP, (iii+iv) the Ge Kα and Kβ escape peaks, (v) the backscatter peak, (vi) the Compton edge (note that it is at lower energy than the backscatter peak), (vii+viii) Ge Kα and Kβ peaks.
2.5 Subtraction of interfering peaks
be originated from the decay of: 228Ac (4.1(11)%), 235U (5.76(14)%) and 238U (0.0018(5)%). Considering the low emission probability of 238U and
a nominal235U/238U activity ratio (0.046) the main interference come from 228Ac Th Kα
1. If the activity ratio 238U(234Th)/228Ra(228Ac) equals 0.95 in a sample, the count rate from the 92.5 keV doublet and the 93.3 X-ray are equal. Activity ratios near to 1 are often encountered in environmental samples and results thus in almost equally sized peaks.
2.6 Use of suitable stable reference materials
It is very important to calibrate measurements using good quality reference materials of a geometry and matrix that is similar to the samples that are being measured. Most reference materials do, however, suffer to a greater or lesser degree from aging due to chemical reactions, diffusion and evaporation. There are also known cases where reference materials have inhomogeneous distribution of 238U, which can occasionally be localised in hot-spots in e.g. soil samples. It is therefore important not to be too reliant on one reference material. Furthermore in the case of the 63 and 92.5 keV peaks, there is very much influence of the sample composition on the self-absorption and interference corrections. Therefore it is dangerous to blindly use the detection efficiency obtained from a single reference sample.
An important consideration is to look at how a reference value was de-termined. For many primordial radionuclides in environmental samples it is not so easy with spiking of primary standards and reference values may have been determined as mean values from intercomparisons of non-expert laboratories, where systematic errors may have been hidden.
2.7 Calculating efficiency transfer and absolute efficiency
out. Furthermore, Vidmar et al. [24] showed that different Monte Carlo codes generate the same results when calculating efficiency transfer factors.
2.8 Background
Perhaps the most obvious parameter for performing robust measurements is a good control of the background. There is a strong trend in placing HPGe-detectors underground [25], meaning at a depth of at least 10 m wa-ter equivalent [26]. It is clear that by reducing the cosmic ray background one can reach lower detection limits. However, when the cosmic ray contin-uum reduces, the peaks from radionuclides in the background appear. It is thus easier to see if the background changes. Performing measurements with low-background is thus important not only for activities in the mBq range but also for activities in the range of a few hundreds of mBq to some Bq. These are activities frequently encountered in monitoring laboratories. Fur-thermore, having a lower background means that one can measure smaller samples, which has many practical advantages with regards to sampling and storage.
The lowest detection limits for 238U using gamma-ray spectrometry is obtained in small swipe samples containing only uranium, measured in the underground laboratory HADES (225 m deep) [27]. The detection limit derived from that measurement is 0.1 mBq corresponding to 10 ng U.
3.
Conclusions
In order to improve robustness in determination of 238U using gamma-ray spectrometry we can identify a few steps that may not be unrealistic to introduce although they all involve investments and spending longer time on each sample.
(i) Use of underground laboratory to reduce background in order to have better control of the background and reduce detection limits and robustness. (ii) Use of two separate HPGe-detectors optimised for determination of low energy and high energy gamma-rays, or alternatively.
(iii) to make use of one large volume p-type detector with thin deadlayer with two chains of electronic with high amplification for low energies and low amplification for high energy gamma-rays.
The problems with quantifying238U discussed in this paper are of course more severe at even lower energies like the 59.5 keV from241Am and 46.5 keV from 210Pb. This was manifested e.g.in a recent IAEA intercomparison on 210Pb in soil [28]. All in all, one needs to exercise great care when analysing
data below 100 keV and investigate any automatic peak fitting and interfer-ence correction carefully. Note also the abundant uncertain decay data in use in different laboratories. The discrepant decay data is to some extent a consequence of all the other sources of errors at low energies mentioned in this paper.
Acknowledgements
The work was carried out as part of the IAEA Research Agreement No. 15085 between the IAEA and EC-JRC-IRMM. Matthias K¨ohler (VKTA-Rossendorf) and Werner Preuße (Staatliche Betriebsgesellschaft f¨ur Umwelt und Landwirtschaft, Chemnitz) are acknowledged for valuable input to this study.
References
[1] Sa¨ıdou, Bochud F., Laedermann J.P., Kwato Njock M.G. and Froide-vaux P.,Appl. Radiat. Isot.,66(2) (2008) 215-222.
[2] Luca A., Table de Radionucl´eides, 234Th, LNE-LNHB, CEA, 2009,
http://www.nucleide.org/DDEP WG/DDEPdata.htm (accessed 22
No-vember 2010).
[3] Browne E. and Tuli J.K., inNuclear Data Sheets for A= 234, Nuclear Data Sheets,108 (2007) 681–772.
[4] Laboratoire National Henri Becquerel, Mini Table de Radionucl´eides (EDP Sciences) 2007.
[5] Wahl W., αβγ-Table, Radionuclide Handbook for Laboratory workers in Spectrometry, Radiation Protection and Medicine, version 4.3.2 (Isus Publications, Schliersee, Germany) 2010.
[6] Laboratoire National Henri Becquerel, Nucl`eide 2000, version 30 June 2004.
[8] Longworth G. et al., The Radiochemical Manual, ISBN 0-7058-1768-7 (AEA Technology plc, Harwell, Oxfordshire, OX11 0RA) 1998.
[9] Schoetzig U. and Schrader H., PTB-Bericht Ra-16/3, errata 1991 (PTB, Braunschweig) 1989.
[10] Schoetzig U. and Schrader H., PTB-Bericht Ra-16/5 (PTB, Braun-schweig) 1998.
[11] National Nuclear Data Center (NNDC), Brookhaven National Labora-tory, Upton, NY,http://www.nndc.bnl.gov/ (accessed 22 November 2010).
[12] Abousahl S., Van Belle P., Lynch B. and Ottmar H., Nucl. Instrum. Methods Phys. Res. A,517 (2004) 211.
[13] Godart J. and Gazon A., Nucl. Phys. A,217 (1973) 159-176.
[14] Chu Y.Y. and Scharff-Goldhaber G., Phys. Rev. C, 17 (1978) 1507-1509.
[15] Wahl W.et al.,Nucl. Instrum. Methods Phys. Res. A,369(1996) 627-633.
[16] Johnston P.N., Hult M. and Gasparro J.,Appl. Radiat. Isot.,64(2006) 1323-1328.
[17] El-Daoushy F. and Hernandez F.,Analyst,127(7)(2002) 981-989.
[18] Papachristodoulou C.A., Assimakopoulos P.A., Patronis N.E. and Ioan-nides K.G.,J. Environ. Radioact.,64(2-3)(2003) 195-203.
[19] Y¨ucel H. et al.,Appl. Radiat. Isot.,67(11) (2009) 2049-2056.
[20] Kaste J.M., Bostick B.C. and Heimsath A.M., Analyst, 131(6)(2006) 757-763.
[21] Huy N.Q. and Luyen T.V.,Appl. Radiat. Isot.,61(6)(2004) 1419-1424.
[22] Garc´ıa-Talavera M.,Appl. Radiat. Isot.,59(2-3)(2003) 165-173.
[23] Gasparro J., Hult M., Johnston P.N. and Tagziria H., Nucl. Instrum. Meth. A,594(2008) 196-201.
[25] Hult M., Metrologia,44(2007) S87-S94.
[26] Hult M., Gasparro J. and Preusse W., Acta Chimica Slovenica, 87
(2005) 1-6.
[27] Andreotti E. et al., in Proceedings from 3rd International Conference “Current Problems in Nuclear Physics and Atomic Energy”(Publishing Department of KINR, Kiev, Ukraine) 2011, pp. 601-605.