UNIVERSITY COLLEGE LONDON
Multivariate Money
A statistical analysis of Roman Republican coin hoards with
special reference to material from Romania
Kris Lockyear
A thesis submitted for the degree of Doctor of Philosophy
in the
Institute of Archaeology University College London
Abstract
The aim of this thesis is assess the usefulness of the statistical analysis of coin hoards for the examination of aspects of ancient societies including coin use and exchange. Special attention was paid to various aspects of ‘formation processes.’ The thesis was divided into three parts.
Part I — Background. This Part initially reviews the history of the project and then goes on to examine the concept of money in the light of anthropological and economic work. A brief discussion of types of exchange (gift, barter, commodity exchange) in societies is offered. The Part is concluded with a review of previous statistical analyses of coin assemblages.
Part II — Analysing Hoards A large database of Roman Republican coin hoards was collected for this project. The problems with this type of data, its storage and retrieval are discussed. The database is then analysed in great detail in order to answer a series of numismatic, archaeological and statistical questions.
Correspondence analysis was used on twenty-two subsets of the data to reveal patterning in the data-set which is discussed. A new variant of cluster analysis was developed to subdivide the data set whilst minimising the time series element. The results are compared to principal co-ordinates and detrended correspondence analyses. The analyses reveal aspects of the use and supply of Roman coinage over Europe and show clearly the unique nature of the Romanian data.
An attempt is made to estimate the speed of circulation of coin in Italy. It is shown that the nature of coin supply leads to variation between periods which is the result of simple probability and sampling theory, not changes in the speed of circulation of coin as has been suggested by other authors.
Simulation studies are used to examine the validity of estimates of coin production and annual coin loss.
The results are summarised. The usefulness of the techniques used is discussed. In the light of the formation processes examined, the patterns in coin hoard data are tentatively interpreted.
Consequently whether we are speaking of money in simple, so-called primitive communities or in much more advanced, complex and sophisticated societies, it is not enough merely to examine the narrow economic aspects of money in order to grasp its true meaning. To analyse the significance of money it must be broadly studied in the context of a particular society concerned. It is a matter for the heart as well as for the head: feelings are reasons too.
Contents
Cuvˆınt ˆInainte 21
I Background 23
1 Introduction 25
1.1 Aims and content . . . 25
1.2 The theoretical perspective . . . 27
1.3 Archaeology, numismatics, and the study of hoards . . . 30
1.4 The rˆole of statistics in archaeology . . . 30
2 Money 35 2.1 Introduction . . . 35
2.2 What is money? . . . 38
2.2.1 Value . . . 46
2.2.2 Gifts and commodities . . . 47
2.3 Some anthropological examples . . . 49
2.3.1 Cattle as money . . . 49
2.3.2 The Tiv . . . 50
2.3.3 The Huaulu . . . 51
2.3.4 Summary . . . 53
2.4 The ancient economy . . . 54
3 Statistical and numerical approaches to the study of ancient coinage 57 3.1 Introduction . . . 57
3.2 Thordeman and the structure of hoards . . . 58
3.3 Volk’s re-examination of ‘Thordeman’s Law’ . . . 59
3.4 Reece and the analysis of hoards and assemblages . . . 61
3.4.1 Numerical aspects of Roman coin hoards in Britain . . . 61
3.4.2 Analysing coin assemblages I — ratio based methods . . . 62
3.4.3 Britain and the continent . . . 64
3.4.4 ‘The Normal Hoard’ — analysis method II (standard deviations) . . . 64
3.4.5 Analysing coin assemblages III — an alternative to standard deviations . . 66
3.4.6 Portchester, 140 sites, and the use of rank ordering (method IV) . . . 67
3.4.7 Analysing assemblages V — cumulative proportions . . . 69
3.4.8 Summary . . . 70
3.5 Lockyear’s computer simulation and further analysis of hoard structure . . . 72
3.6 Carradice and the coinage of Domitian . . . 73
3.7 Patterson and the decay rate . . . 75
3.9 Rogers and the analysis of coin weights . . . 77
3.10 The work of Duncan-Jones . . . 77
3.10.1 Speed of coin circulation . . . 77
3.10.2 Regional supply patterns . . . 78
3.11 Ryan, computing and the coinage of fourth century Britain . . . 79
3.12 The work of J. D. Creighton . . . 80
3.12.1 Introduction . . . 80
3.12.2 PCA of hoard data . . . 81
3.12.3 Coin wear and the velocity of coin circulation . . . 85
3.12.4 The creation of a benchmark . . . 86
3.12.5 Use of contingency coefficients . . . 86
3.12.6 Comparing hoards to the benchmark . . . 88
3.12.7 Hoard size . . . 89
3.12.8 Site finds and the coinage pool . . . 90
3.12.9 Case studies . . . 91
3.12.10 Summary . . . 92
3.13 Estimating the size of coin issues . . . 92
3.13.1 Introduction . . . 92
3.13.2 The use of die-links and estimation formulæ . . . 93
3.13.3 How many coins were struck per die? . . . 95
3.13.4 Crawford’s method . . . 97
3.13.5 Initial criticisms of Crawford . . . 100
3.13.6 Lockyear’s use of regression . . . 101
3.13.7 Preston and the decay rate . . . 102
3.13.8 The Buttrey critique . . . 103
3.13.9 Summary . . . 104
3.14 Crawford’s die estimates and the supply of coinage to Romania . . . 104
3.15 Numerical and statistical techniques — summary and conclusions . . . 106
II Analysing hoards 107 4 Aims and methods of analysis 109 4.1 Introduction . . . 109
4.2 Aims and Methods . . . 109
5 The Data 113 5.1 Introduction . . . 113
5.2 Roman Republican Coin Hoards and theCHRRdatabase . . . 113
5.2.1 Categories of data . . . 113
5.2.2 Sources of data . . . 115
5.2.3 Problems with the data . . . 117
5.2.4 Storage and data manipulation strategies . . . 120
5.2.5 The coverage of the database . . . 127
5.2.6 Future development . . . 127
Contents 11
6 Models of coin supply and circulation 129
6.1 Introduction . . . 129
6.2 The life of a coin . . . 129
6.3 Supply and distribution within a discrete area . . . 132
6.4 Types of supply . . . 133
6.5 Inter-regional patterns . . . 135
6.6 Other factors . . . 136
6.7 Summary . . . 136
7 The Incidence of Hoards 137 7.1 Introduction . . . 137
7.2 Testing the coverage . . . 138
7.2.1 Italy . . . 138
7.2.2 Spain and Portugal . . . 138
7.2.3 Romania . . . 138
7.2.4 Other regions . . . 140
7.3 The pattern . . . 141
7.4 Conclusions . . . 143
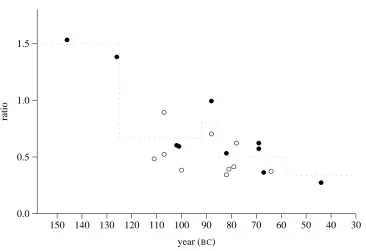
8 Comparing Hoards — Correspondence Analysis 145 8.1 Aims and methods . . . 145
8.1.1 Introduction . . . 145
8.1.2 Techniques . . . 146
8.1.3 Software . . . 147
8.2 Correspondence analysis and the analysis of hoards . . . 148
8.2.1 Introduction . . . 148
8.2.2 The ‘horseshoe curve’ or ‘Guttman effect’ . . . 149
8.2.3 Dividing the data — selecting hoards for analysis . . . 149
8.2.4 CA — a worked example and further problems . . . 151
8.2.5 Principal Components Analysis and CA — an empirical comparison . . . . 162
8.2.6 A usable methodology . . . 165
8.3 The analyses . . . 165
8.3.1 Introduction . . . 165
8.3.2 Hoards closing 147–118 BC . . . 166
8.3.3 Hoards closing 118–108 BC . . . 170
8.3.4 Hoards closing 105–97BC . . . 171
8.3.5 Hoards closing 92–87BC . . . 178
8.3.6 Hoards closing 87–81BC . . . 183
8.3.7 Hoards closing 80–79BC . . . 188
8.3.8 Hoards closing 78–75BC . . . 192
8.3.9 Hoards closing in 74BC . . . 192
8.3.10 Hoards closing 72–69BC . . . 199
8.3.11 Hoards closing 63–56BC . . . 199
8.3.12 Hoards closing 56–54BC . . . 205
8.3.13 Hoards closing 51–47BC . . . 207
8.3.14 Hoards closing 46BC. . . 211
8.3.15 Hoards closing 45–43BC . . . 214
8.3.16 Hoards closing 42BC. . . 216
8.3.17 Hoards closing 41–40BC . . . 220
8.3.19 Hoards closing 32BC . . . 227
8.3.20 Hoards closing 29BC . . . 230
8.3.21 Hoards closing 19–15BC. . . 234
8.3.22 Hoards closing 15–11BC. . . 237
8.3.23 Hoards closing 8–2BC . . . 240
8.4 Summary, conclusions and problems . . . 246
8.4.1 Regional patterns . . . 246
8.4.2 Numismatic aspects . . . 260
8.4.3 Further comments on the CA of hoard data . . . 262
9 Cross-period comparisons and the speed of coin circulation 267 9.1 Introduction . . . 267
9.2 The methodology . . . 268
9.3 Results . . . 270
9.3.1 The first analysis — hoards from 87–81BC . . . 270
9.3.2 The second analysis — hoards from 74BC . . . 275
9.4 Issue size and inter-hoard variability . . . 276
9.5 Ramifications . . . 283
10 Comparing hoards — cluster analysis 285 10.1 Introduction . . . 285
10.2 The analysis . . . 287
10.3 Discussion of results . . . 299
10.4 Comparing hoards — principal co-ordinates analysis . . . 302
10.5 Comparing hoards — detrended correspondence analysis . . . 303
10.5.1 Analysis one — ‘ordinary’ CA . . . 305
10.5.2 Analysis two — detrended CA . . . 307
10.5.3 Analysis three — down-weighting rare variables . . . 311
10.5.4 Global detrended CA . . . 311
10.5.5 Discussion of the results . . . 311
10.6 Conclusions and discussion . . . 314
10.6.1 Archaeological and numismatic results . . . 314
10.6.2 The statistical methods . . . 316
11 Modelling coinage supply and loss 317 11.1 Introduction . . . 317
11.2 Testing Crawford’s die estimates and the model . . . 318
11.2.1 Introduction . . . 318
11.2.2 Modelling the coinage pools . . . 319
11.2.3 Comparing the results . . . 320
11.2.4 Testing Crawford’sRISCfigures () . . . 320
11.2.5 Examining the decay rate () . . . 324
11.2.6 Examining the introduction delay () . . . 327
11.2.7 Testing the regression-based RISCfigures . . . 331
11.3 Implications and conclusions . . . 332
12 Summary and Conclusions from Part II 339 12.1 Introduction . . . 339
12.2 Computer-based and statistical methods . . . 339
Contents 13
12.4 Archaeological conclusions . . . 341
III Coins in Context: Republican denarii from Romania 343 13 Coins in context 345 13.1 Introduction . . . 345
13.2 Romanian physical and political geography . . . 347
13.3 An outline of Romanian history . . . 349
13.3.1 From the Romans to the Ottoman Empire . . . 349
13.3.2 The region under the Ottoman Empire . . . 352
13.3.3 The Twentieth Century . . . 356
13.3.4 History and the Iron Age . . . 359
13.4 The evidence for the late Iron Age in Romania . . . 360
13.4.1 Introduction . . . 360
13.4.2 Written sources . . . 360
13.4.3 Archaeology . . . 365
13.5 Past and Present — interpretations of the evidence from Pˆarvan to the present . . . 375
13.6 Republican Coinage in Dacia . . . 378
13.7 Summary . . . 379
14 Coinage in Dacia 381 14.1 Introduction . . . 381
14.2 Non-Roman coinage . . . 381
14.3 Roman Republican coins in Dacia . . . 384
14.3.1 Introduction . . . 384
14.3.2 Supply, structure and distribution . . . 385
14.3.3 Denarii and the pre-Roman coinages . . . 393
14.3.4 The site find evidence . . . 393
14.3.5 Coin finds and silverware . . . 401
14.4 Copies of Roman Republican denarii . . . 401
14.4.1 The evidence . . . 401
14.4.2 Identifying copies — die-links . . . 408
14.4.3 Identifying copies — metallurgical analyses . . . 408
14.4.4 Composition by date . . . 421
14.4.5 Bi- and multivariate analyses — the pilot study . . . 425
14.4.6 Bi- and multivariate analyses — the full data set . . . 429
14.4.7 Identifying copies — coin weights . . . 442
14.4.8 Comparison to previous analyses . . . 442
14.5 Coinage in Dacia — summary and conclusions . . . 443
15 State, swindle or symbol? 445 15.1 Introduction . . . 445
15.2 The coins . . . 445
15.3 State? . . . 447
15.4 Swindle? . . . 447
A The Hoards 451
A.1 Introduction . . . 451
A.2 The data . . . 451
B Concordances 485 B.1 Introduction . . . 485
B.2 Database codes . . . 485
B.3 Roman Republican Coin Hoards . . . 487
C Supplementary data for the simulation study 489 C.1 Introduction . . . 489
C.2 TheSIM2 program . . . 489
C.3 Crawford’s and Lockyear’sRISCfigures . . . 493
D Late Iron Age sites in Romania 495 D.1 Introduction . . . 495
D.2 Survey of the counties of Alba, Hunedoara and Sibiu . . . 495
D.2.1 Alba . . . 495
D.2.2 Hunedoara . . . 508
D.2.3 Sibiu . . . 526
D.2.4 Other minor findspots in Munt¸ii Or˘as¸tiei . . . 534
D.3 Other sites of interest outside the three counties . . . 536
D.4 Sites of special interest . . . 545
D.4.1 Rectangular sanctuaries . . . 545
D.4.2 Circular Sanctuaries . . . 546
D.4.3 Murus dacicus wall construction . . . 546
E Metallurgical data and analyses 549 E.1 Introduction . . . 549
E.2 Pre-processing of the data . . . 549
E.3 The availability of theMETALdatabase . . . 550
E.4 Database structure . . . 550
E.5 dBASEprograms and other files . . . 554
Bibliography 555
List of Figures
2.1 Money as a symbolic system . . . 43
3.1 140 sites from Roman Britain: phases B v. D . . . . 63
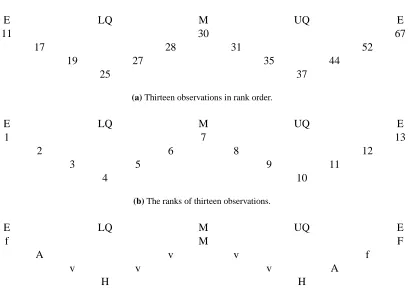
3.2 Explanation of rank ordering and boxplots . . . 68
3.3 Object loading map from PCA of Creighton’s data . . . 83
3.4 Variable plot from PCA of Creighton’s data . . . 84
3.5 Ratio of hoard specimens to obverse dies . . . 100
3.6 Regression of ratio against year . . . 102
3.7 Poenaru and Cojoc˘arescu’s analysis of Transylvanian hoards . . . 105
6.1 Model of coin circulation I . . . 130
6.2 Model of coin circulation II . . . 132
6.3 Idealised coin distribution between two mints . . . 134
6.4 Down the line movement model . . . 134
7.1 Denarius hoards per annum . . . 141
7.2 Denarius hoards per annum from Spain and Portugal . . . 142
8.1 Horseshoe curves . . . 150
8.2 Sample score map from CA of 241 hoards . . . 151
8.3 Species score map from CA of 241 hoards . . . 152
8.4 Maps from CA of data set48bctest.dat . . . 154
8.5 Maps from second CA of data set48bctest.dat . . . 155
8.6 Species score map from third CA of data set48bctest.dat . . . 156
8.7 Sample map from third CA of data set48bctest.dat . . . 157
8.8 Cumulative percentage curves for 12 hoards closing 46BC. . . 158
8.9 Maps from third CA of data set48bctest.dat . . . 159
8.10 Cumulative percentage plots of hoards by 3rd principal axis . . . 161
8.11 Object loading map from PCA of data set48bctest.dat. . . 163
8.12 Maps from PCA of data set48bctest.dat . . . 164
8.13 Cumulative percentage graph of hoards in data setfin147.dat . . . 167
8.14 Species map from CA of data setfin147.dat . . . 168
8.15 Sample map from CA of data setfin147.dat . . . 169
8.16 Cumulative percentage graph of hoards in data setfin118.dat . . . 172
8.17 Hoards in Spain, 118–108BC . . . 172
8.18 Maps from CA of data setfin118.dat. . . 173
8.19 Cumulative percentage graphs of hoards in data setfin105.dat . . . 176
8.20 Maps from CA of data setfin105.dat. . . 177
8.21 Five figure summaries . . . 178
8.22 Cumulative percentage graph of hoards in data setfin92.dat. . . 179
8.24 Species map from second CA of data setfin92.dat. . . 181
8.25 Sample map from second CA of data setfin92.dat . . . 182
8.26 Cumulative percentage graphs of hoards in data setfin87.dat . . . 184
8.27 Species map from CA of data setfin87.dat. . . 185
8.28 Sample map from CA of data setfin87.dat . . . 186
8.29 Location map of hoards in data setfin87.dat. . . 187
8.30 Cumulative percentage graphs of hoards in data setfin80.dat . . . 189
8.31 Maps from CA of data setfin80.dat . . . 190
8.32 Location map of Italian hoards in data setfin80.dat. . . 191
8.33 Cumulative percentage graph of hoards in data setfin78.dat. . . 193
8.34 Maps from CA of data setfin78.dat . . . 194
8.35 Cumulative percentage graphs of hoards in data setfin74.dat . . . 196
8.36 Maps from CA of data setfin74.dat . . . 197
8.37 Maps from CA of data setfin74.dat . . . 198
8.38 Cumulative percentage graphs of hoards in data setfin72.dat . . . 200
8.39 Maps from CA of data setfin72.dat . . . 201
8.40 Cumulative percentage graphs of hoards in data setfin63.dat . . . 203
8.41 Maps from CA of data setfin63.dat . . . 204
8.42 Cumulative percentage graphs of hoards in data setfin56.dat . . . 206
8.43 Maps from CA of data setfin56.dat . . . 207
8.44 Cumulative percentage graphs of hoards in data setfin51.dat . . . 209
8.45 Maps from CA of data setfin51.dat . . . 210
8.46 Cumulative percentage graphs of hoards in data setfin46.dat . . . 212
8.47 Maps from CA of data setfin46.dat . . . 213
8.48 Cumulative percentage graph of hoards in data setfin45.dat. . . 215
8.49 Maps from CA of data setfin45.dat . . . 216
8.50 Cumulative percentage graph of hoards in data setfin42.dat. . . 217
8.51 Maps from CA of data setfin42.dat . . . 218
8.52 Cumulative percentage graphs of hoards in data setfin41.dat . . . 221
8.53 Maps from CA of data setfin41.dat . . . 222
8.54 Maps from CA of data setfin41.dat, 2nd and 3rd axes . . . 223
8.55 Cumulative percentage graph of hoards in data setfin39.dat. . . 225
8.56 Maps from CA of data setfin39.dat . . . 226
8.57 Cumulative percentage graph of hoards in data setfin32.dat. . . 228
8.58 Maps from CA of data setfin32.dat . . . 229
8.59 Cumulative percentage graphs of hoards in data setfin29.dat . . . 232
8.60 Maps from CA of data setfin29.dat . . . 233
8.61 Cumulative percentage graph of hoards in data setfin19.dat. . . 235
8.62 Maps from CA of data setfin19.dat . . . 236
8.63 Cumulative percentage graph of hoards in data setfin15.dat. . . 238
8.64 Maps from CA of data setfin15.dat . . . 239
8.65 Cumulative percentage graph of hoards in data setfin8.dat . . . 241
8.66 Maps from first CA of data setfin8.dat . . . 242
8.67 Maps from first CA of data setfin8.dat, 2nd. v. 3rd axes . . . 243
8.68 Maps from second CA of data setfin8.dat . . . 245
8.69 Incidence of hoards in Spain and Italy . . . 254
8.70 Spanish and Portuguese hoards from 118–100BC . . . 254
9.1 Proposed zones within coin hoards . . . 269
List of Figures 17
9.3 Partial CAs of datasetfin87.dat. . . 272
9.4 Partial CAs of datasetfin87.dat. . . 273
9.5 Partial CAs of datasetfin87.dat. . . 274
9.6 Line graph of scores from CA of data setfin74.dat . . . 276
9.7 Comparison of the size of issues from 90 and 74BC . . . 277
9.8 Coin distributions over time . . . 280
10.1 Dendrogram from cluster analysis using the single link method . . . 289
10.2 Dendrogram from cluster analysis using Ward’s method . . . 290
10.3 Dendrogram from cluster analysis using the average link method . . . 291
10.4 Cluster analysis groups b, f and g . . . 298
10.5 PCO analysis plot — 1st and 2nd axes . . . 303
10.6 PCO analysis plot — 2nd and 3rd axes . . . 304
10.7 Species map from ordinary CA of data setdetrend.dat . . . 306
10.8 Sample map from ordinary CA of data setdetrend.dat . . . 307
10.9 Maps from CA detrended by segments of data setdetrend.dat . . . 309
10.10 Maps from CA detrended by polynomials of data setdetrend.dat. . . 310
10.11 Cumulative percentage curves forBPT,SEI,SPN, CR1,BOR, &CR2 . . . 312
10.12 Cumulative percentage curves for eight hoards from cluster group b . . . 312
10.13 Sample map from CA with rare species down-weighted . . . 313
10.14 Sample map from detrended CA of 241 hoards . . . 314
11.1 Simulated population for 72BC . . . 322
11.2 Simulated population for 50BC . . . 323
11.3 Simulated population for 100BC . . . 324
11.4 Simulated populations for 72BC . . . 325
11.5 Simulated populations for 82BC . . . 328
11.6 Simulated populations for 82BC . . . 328
11.7 Simulated populations for 82BC . . . 329
11.8 Simulated populations for 82BC . . . 329
11.9 Simulated populations for 87BC . . . 332
11.10 Results of simulation usingRISCfigures from regression . . . 334
11.11 Total numbers of denarii in circulation . . . 336
13.1 Physical geography of Romania . . . 348
13.2 Political geography of Romania . . . 350
13.3 Location of the counties of Alba, Hunedoara and Sibiu . . . 367
14.1 Hoarding by date in Romania . . . 388
14.2 Distribution map of Roman Republican hoards in Romania . . . 390
14.3 Distribution map of Class 1 and Class 2 hoards in Romania . . . 392
14.4 Hoards of late Iron Age silver-work from Romania . . . 402
14.5 Sample size effects on estimated readings . . . 413
14.6 Stem-and-leaf plot of sample weights (25ml.) . . . 413
14.7 Sample size effects on estimated readings . . . 414
14.8 Stem-and-leaf plot of sample weights (10ml.) . . . 414
14.9 Dot plot for silver values . . . 418
14.10 Dot-plot for copper concentration, all samples . . . 418
14.11 Dot-plot for lead concentration, all samples . . . 418
14.12 Dot-plot for gold concentration, all samples . . . 420
14.14 Dot-plot for antimony concentration, all samples . . . 420
14.15 Dot-plot for cobalt concentration, all samples . . . 420
14.16 Dot-plot for bismuth concentration, all samples . . . 421
14.17 Dot-plot for zinc concentration, all samples . . . 421
14.18 Copper and lead values against date . . . 423
14.19 Gold and bismuth values against date . . . 424
14.20 Sample map from PCA of pilot metallurgical study . . . 426
14.21 Biplot from PCA of pilot metallurgical study . . . 427
14.22 Biplot from PCA of pilot metallurgical study . . . 428
14.23 Scattergrams of Cu v. Pb & Au v. Bi . . . 431
14.24 KDE contour plots of bivariate scattergrams . . . 432
14.25 Map from PCA of metallurgical data . . . 434
14.26 Biplot from PCA of metallurgical data . . . 435
14.27 KDE contour plots of PCA map . . . 436
List of Tables
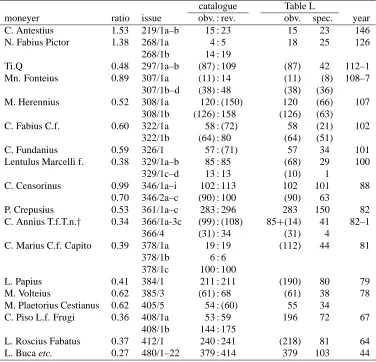
3.1 Issues used to calculate specimen to obverse ratios . . . 98
3.2 Issues with paired control-marks . . . 99
3.3 Crawford’s ratios used to calculate obverse die numbers . . . 99
3.4 Preston’s regression results . . . 103
5.1 Meaning of the various query codes used in theCHRRdatabase . . . 126
7.1 Number of hoards by region in theCHRRdatabase . . . 139
7.2 Number of denarii in hoards by region . . . 140
7.3 Total numbers of denarius hoards by region. . . 140
8.1 Hoards in data set48bctest.dat . . . 153
8.2 Eigenvalues etc. from CA and PCA of data set48bctest.dat . . . 153
8.3 Details of 3rd axis from CA of data set48bctest.dat . . . 160
8.4 Eigenvalues from CA analyses . . . 166
8.5 Hoards in data setfin147.dat . . . 167
8.6 Hoards in data setfin118.dat . . . 171
8.7 Hoards in data setfin105.dat . . . 174
8.8 Hoards in data setfin92.dat. . . 179
8.9 Hoards in data setfin87.dat. . . 184
8.10 Hoards in data setfin80.dat. . . 189
8.11 Hoards in data setfin78.dat. . . 193
8.12 Hoards in data setfin74.dat. . . 195
8.13 Hoards in data setfin72.dat. . . 200
8.14 Hoards in data setfin63.dat. . . 202
8.15 Hoards in data setfin56.dat. . . 206
8.16 Hoards in data setfin51.dat. . . 208
8.17 Hoards in data setfin46.dat. . . 211
8.18 Hoards in data setfin45.dat. . . 215
8.19 Hoards in data setfin42.dat. . . 217
8.20 Percentages for sub-groups of selected hoards in data setfin42.dat . . . 219
8.21 Diagnostic statistics from CA of data setfin42.dat. . . 220
8.22 Hoards in data setfin41.dat. . . 221
8.23 Hoards in data setfin39.dat. . . 225
8.24 Hoards in data setfin32.dat. . . 228
8.25 Hoards in data setfin29.dat. . . 231
8.26 Period percentages forSEI, CDA, &ALA . . . 231
8.27 Hoards in data setfin19.dat. . . 235
8.28 Hoards in data setfin15.dat. . . 238
8.30 Hoards with Roman Republican & Iberian denarii . . . 251
8.31 Ten hypothetical coin hoards . . . 265
9.1 Eigenvalues etc. from partial CAs . . . 271
9.2 Coins of 90BCas a percentage of the ‘good total’ . . . 278
9.3 Coins of 74BCas a percentage of the ‘good total’ . . . 279
10.1 Summary of cluster analysis results . . . 292
10.2 Detailed cluster analysis results . . . 293
10.3 Cluster analysis date ranges . . . 300
10.4 Cluster analysis ‘supergroups’ . . . 301
10.5 Hoards in data setdetrend.datfor CA . . . 305
10.6 Eigenvalues etc. from CA of data setdetrend.dat . . . 308
11.1 Hoards used in simulation study . . . 321
11.2 Dsum comparisons, 72BC . . . 326
11.3 Dsum comparisons, 51BC . . . 326
11.4 Dsum comparisons, 100BC . . . 326
11.5 Dsum comparisons, 82BC . . . 326
11.6 Results of simulations using Lockyear’s and Crawford’sRISC figures compared . 333 11.7 Total numbers of denarii in circulation . . . 336
14.1 Association of coin series in hoards . . . 387
14.2 Class 1 and 2 hoards plotted in Fig. 14.3 . . . 391
14.3 Hoards from Romania . . . 394
14.4 Coin finds from Dacian settlements—Moldavia . . . 397
14.4 Coin finds from Dacian settlements (continued) — Muntenia and Oltenia . . . 398
14.4 Coin finds from Dacian settlements (continued) — Transylvania and Cris¸ana . . . 399
14.4 Coin finds from Dacian settlements (continued) — Totals . . . 400
14.5 Hybrid coins from Romania . . . 404
14.6 Evidence for copies of denarii from Romania . . . 408
14.7 Objects sampled for metallurgical analysis . . . 409
14.8 Romanian hoards sampled May 1992 . . . 410
14.9 Summary statistics from metallurgical analyses . . . 416
14.10 Samples with extreme elements . . . 422
14.11 Results of pilot study . . . 425
14.12 Eigenvalues etc. from PCA of full metallurgical data set . . . 433
Cuvˆınt ˆInainte
Whilst working on this thesis, friends and colleagues have often asked, why Roman coins? Why use statistics? Why the Roman Republic? My interest in Roman coins stems from the teaching of John Casey at Durham, particularly his coinage course which I took in 1986–7. My interest in coins, however, is not the interest of a collector—I am interested in what coins can tell us about the societies which used them, not in the individual objects as such. In this regard, the numerical work of Richard Reece appealed greatly. During 1988–9 I undertook the M.Sc. course in archaeological computing at the University of Southampton. It became quickly obvious that the most efficient method for handling large quantities of coinage data was the construction of a relational database. As part of the M.Sc. I also took courses in statistics taught by Stephen Shennan, during which I was taken with the beauty of multivariate statistics, and their applicability to coinage studies. For my M.Sc. dissertation Richard Reece suggested that I examine the so-called Crawford-Buttrey debate, a topic which had the advantage that a body of good quality data was available in the form of Table L in Roman Republican Coinage. At the end of this dissertation, it was clear that further work would be profitable, and thus the present work. Whether I have been successful in using computing and statistical techniques to study coins in order to examine past societies is the privilege of the reader.
For those interested in such matters, this thesis was typeset in 11pt Times-Roman using the LATEX 2
"typesetting system and the BIBTEX bibliography system. TheUKTUGdistribution of
Eber-hart Mattes’EMTEXsystem for DOSmachines was used, mainly running on a 50mhz 486PC. The final top-copy was printed on a Hewlett-Packard 4MP POSTSCRIPT printer from files generated by Thomas Rockiki’s DVIPS. The primary editor was Ulrich Jahnz’s Eddi4TEX, and the BIBTEX
files were manipulated using Eyal Doron’s BIBDB for DOS. A large number of packages were down-loaded from the Cambridge CTAN archive. Those used in this thesis were:doubles2(double spacing), moreverb(extended verbatim environments), times(POSTSCRIPT Times-Roman font), vmargin(page layout),chicago(Harvard bibliography style),epsfig(POSTSCRIPT graphics inclu-sion), longtable (multipage tables), xspace(elegant space handling), fancyheadings(page head-ers and foothead-ers), rotating (rotating figures and text), calc(calculation in TEX),lgreek (full Greek fonts),afterpage(inclusion routines),dcolumn(decimal point justification in tables),amstext(text in maths),amssymb(maths symbols), multicol (multiple columns),caption(customise figure and table captions) and a slightly modified version of the subfigure package (subfigures and tables) calledsubfigkl. A number of custom-written packages were also used. All the figures in this thesis were stored in POSTSCRIPT format and included using theepsfigpackage. All the.tex,.bib,
.dviand non-standard.styfiles have been placed on the attachedCD-ROM. Additionally, all the
figures, and the POSTSCRIPTfiles used to print this thesis, are on theCD.
Funding for this thesis was primarily provided by the Science and Education Research Council to whom my thanks are due. The metallurgical project, which was conducted as a result of my doc-toral research, was funded by the Fund for Applied Science in Archaeology, the Royal Numismatic Society, and the UK Numismatic Trust.
I would like to thank my supervisors, Clive Orton and Stephen Shennan for all their help and en-couragement. I would also like to thank: Michael Crawford for allowing me to use his archives and data, now stored in the British Museum; the staff of the Dept. of Coins and Medals, primarily Andrew Burnett and Roger Bland, for allowing me such easy access both to those archives and to the library of the Department, and for allowing samples to be taken from silver denarii in the Museum’s collection; Richard Reece, who kindly provided the original idea for my M.Sc. disserta-tion and spent much time discussing my ideas and work; Matthew Ponting for so enthusiastically agreeing to undertake the metallurgical analyses, including accompanying me to Romania in May 1992 to collect the samples; John Merkell for allowing the analyses to be conducted on the Insti-tute’s equipment; Peter Guest for discussing my ideas and sharing his own with me; Christopher Howgego for allowing me to sample coins from the Ashmolean; Terrence Volk and Ted Buttrey, both from Cambridge, for providing off-prints and discussing my work; Warren Esty for a long and highly productive conversation in Oxford and subsequent discussions by e-mail; Mike Baxter, Christian Beardah, Richard Wright and Morven Leese for discussing and helping with the statisti-cal aspects of my work; Nick Ryan for his help with the database and for so promptly sending me copies of his article and book, and Sebastian Rahtz for acting as my unpaid, unofficial but willing LATEX guru. Frank Martin printed the photographs from my rather poor negatives, for which I am
immensely grateful.
In Southampton, I would like to acknowledge the Department of Archaeology at the University for kindly allowing me access to both their hardware and software upon which much of the work was undertaken. I would particularly like to thank: Timothy Sly for all his help and patience, especially in matters regarding computing; Dale Serjeantson for proof-reading almost everything, and for her patience; Sophie Jundhi for pasting-up the plates and Kathryn Knowles for her help in this matter; and Keith Westcott for digitising the maps. I also wish to express my deepest gratitude to Jenny Coy for allowing me to continue to use my room in Southampton as an office until the completion of my thesis.
Many people have helped me cope with the large numbers of languages involved in this work, including Federica Massagrande (Italian, Spanish), Rosemary Burton (Spanish), Dale Serjeantson (French), Genevieve Stone (Russian) and Doina Whitaker (Romanian).
My work in Romania could not have taken place, and certainly would not have been so pleasant, without the kind help and co-operation of a great many people to whom my thanks are willingly given, foremost of whom are Gh. Poenaru Bordea and Adrian Popescu of the Institutul de Arhe-ologie “Vasile Pˆarvan” in Bucures¸ti, and Virgil Mih˘ailescu-Bˆırliba of the Institutul de ArheArhe-ologie, Ias¸i. I would particularly like to thank Adrian’s and Virgil’s families for their repeated hospital-ity over the years. I would also like to thank: Constant¸a S¸tirbu (Muzeul de Istorie al Romˆania), Radu Oches¸eanu (Severeanu Museum, Bucharest), Catalin and Geta Bort¸un (Muzeului Judet¸ean Teleorman, Alexandria), Ecaterina T¸ ˆınt¸˘areanu (Muzeului Judet¸ean Teleorman, Alexandria), Aniko Mitruly, Lili Ardea and Doina Coms¸a, (Medias¸ Museum), Ioan Capros¸u (Universitatea Al. I. Cuza, Ias¸i), Dan Gh. and Silvia Teodor, Victor Spinei, Costel Chiriac, Ion Ionit¸a, and all the researchers and staff at the Institutul de Arheologie, Ias¸i, and Nicu Bolohan and Marius Alexianu and their families (Piatra Neamt¸).
Part I
Chapter 1
Introduction
1.1
Aims and content
Archaeology is an interdisciplinary subject. Although it is usually classed as one of the human or social sciences it uses in large measure techniques and methods developed both in the hard sciences and in the arts. This aspect of the subject has been its strength and its weakness. One weakness is that it has created a plethora of specialists, and while this is not in itself a problem, it becomes one when communication and mutual understanding is poor.
A second weakness is to lose sight of the discipline’s aims. Defining archaeology is probably impossible. Wheeler wrote:
What in fact is archaeology? I do not myself really know. Theses have been written to demon-strate that it is This or That or not the Other Thing. . . (Wheeler 1954, p. 16)
He did know, however, that:
. . . the archaeological excavator is not digging up things, he is digging up people; however much he may analyse and tabulate and desiccate his discoveries in the laboratory, the ulti-mate appeal. . . is from mind to intelligent mind, from man to sentient man. Our graphs and schedules mean nothing if they do not ultimately mean that. Of our scraps and pieces we may say, with Mark Antony in the market place, ‘You are not wood, you are not stones, but men.’ (Wheeler 1954, p. 17)
If the soil micromorphologist or the hermeneuticist does not show the importance of their particular piece of work for the understanding of the human past, then they are not ‘doing’ archaeology, although we must be aware that identifying what we cannot say is also an important contribution.
How is the archaeologist to overcome this weakness? One possibility is to have generalists, as well as specialists; synthesisers who combine the diffuse threads of evidence to weave them into their own tapestry, their own broad picture of the past. Another solution is to become a middle man. In statistics, Clive Orton (1992) has suggested a model of practice whereby an archaeologist with training in statistics — a parastatistician — acts as communicator between ‘real’ statisticians and other archaeologists, and this is the approach followed here.
Why is a chapter containing descriptions of the various ‘money-objects’ in various societies in the same volume as a discussion of 20th century political history in Romania? What has either to do with the statistical analysis of Roman Republican coin hoards? It would have been easy to have written this thesis from the narrow perspective of the analysis of coin hoards but I felt the necessity of standing back and examining what I was trying to do. Starting from the point I had reached in my masters dissertation (Lockyear 1989) I firstly looked at the broader themes: what is money? What sorts of economies are there? How does money function in different societies? From these broad themes, I then examined one type of money: Roman Republican coins, and primarily silver
denarii. What can we learn from hoards of such coins? Can we identify the causes of variation in
coin hoards? Can we develop valid statistical techniques for the analysis of this material? Further, I felt a need to put flesh back onto the subject, to situate the analysis in an archaeological and social context. Therefore, a case study was chosen: Republican coins as found in Dacia, approximately modern Romania. This case study uses the insights gained from the wider background research presented in Part I, and the results of the research presented in Part II. However, to put the coins into their archaeological context, that context has to be understood. To understand the archaeology of Dacia in the present in turn requires an understanding of the study of Dacia in its modern context,
i.e., in the 20th century, and even the history of the area from late antiquity. I hope that the reader
will see, despite the seeming vastness between topics, that they are all relevant to the overall task. I have often felt inadequate to the task I have set myself. Specialists may find my forays into their fiefdoms na¨ıve and simplistic. Statisticians could argue my techniques were not optimal; anthropologists may ask why I chose this society and not that; Romanian archaeologists may argue that I have not examined all the available evidence. In a project such as this, comprehensiveness is not an obtainable goal. For example, a published bibliography of the La T`ene in Romania up to 1981 contained 4890 entries (Coms¸a 1993). Consulting a fraction of these references, almost entirely in languages other than English, has been extremely time consuming. I have, therefore, used the techniques, examples and data available to me, and make no apologies.
To summarise, this thesis contains three parts: Part I contains this general introduction (Chapter 1), Chapter 2 contains a discussion of the nature of money, and some of the debates that surround it, including anthropological and ancient historical perspectives, and Chapter 3 contains a detailed discussion of numerical and statistical techniques as applied to coinage studies. Part II (chapters 4– 12) is the analytical section of this thesis, including two case studies examining specific problems. Part III contains the principal case study: it starts with an overview of many relevant aspects of the problem and presents a discussion of some aspects of the archaeological evidence for this period (Chapter 13). This is followed by a more detailed discussion of the coinage (Chapter 14) which includes an attempt to solve the problem of copies (section 14.4). Chapter 15 attempts to join the many threads of evidence from all three Parts to create a coherent picture of the late Iron Age of Romania. There then follows a series of Appendices.
What is not presented, at least in printed form, is a detailed listing of the data used in Part II. This data is detailed information of the contents of coins hoards of the Roman Republic dating from 211BC(the start of the denarii coinage) to 2BC. This information, in the form of comma delimited
1.2. The theoretical perspective 27
rear cover of this thesis. It would be a huge task for anyone to re-input the data used in this thesis from printed lists in order to assess or re-analyse the data sets. By including the data in digital format this enables future scholars to use and re-examine the data without needless replication of work already undertaken. TheCD-ROM also contains tables with the results of various queries (primarily the data sets referred to in Part II), files for input to various statistics packages, the graphs in POSTSCRIPT format, and dBASE programs, or other files which might be of use including the text of this thesis in LATEX 2
"format, and as.dviand POSTSCRIPTfiles. Updated versions of the
primary coin hoards of the Roman Republic (CHRR) database, which forms the core of this work,
will also be available from sources over the InterNet, initially from the University of Southampton’s WWW server (http://avebury.arch.soton.ac.uk/Lockyear/chrr.html), and hopefully in the near future from the Humanities Data Service.
1.2
The theoretical perspective
This thesis is not, primarily, theoretical in that it does not explicitly examine theoretical issues with a view to the advancement of archaeological theory. However, it is impossible to be atheoretical — whatever we do is influenced by our theoretical stance, or to put it another way, what we believe is the correct or best way to ‘do’ archaeology. In the development of archaeology over the last 150 years a number of different schools of thought have emerged (Trigger 1989), some of which could be classed as significant paradigm shifts (Kuhn 1970). In the initial stages of each development, the ‘new’ school often adopts a combative stance (e.g., Shanks & Tilley 1992) which leads to conflict, stalemate and eventually stagnation; a classic example in economic anthropology being the formalist-substantavist ‘debate’ (Plattner 1989), and a more recent example in archaeology being the processual/post-processual debate (Preucel 1991b; Yoffee & Sherratt 1993). Such conflict is counter-productive. An example is site formation processes (Schiffer 1987). The Schiffer school of thought gives primacy to the investigation of these processes and see an understanding of them as a bridge between the archaeological record and the past (Schiffer 1987). In contrast, Shanks & Tilley (1992), argue that as the past is constructed in the present, there is no one ‘true’ past’, and a research program centred solely on formation processes is misguided:
However, we would strongly criticise the view that there is a mechanical, albeit indirect, relation between material culture and the contexts of its production. The aim of a science of material culture, a science of the archaeological record, is a mistaken one, a futile search for scientific objectivity. As we hope to show, there can be no objective link between patterning in material culture and processes which produced that patterning. (Shanks & Tilley 1992, p. 10).
Recently, many have recognised that the conflict between processual and post-processual archae-ology is counter-productive, and that if not co-operation, at least tolerance would be more fruitful (Preucel 1991a).
interaction of past human behaviour, physical processes, and the recovery and recording of that record by archaeologists. An investigation of the processes which lead to the formation of the record (in which I would include the training and beliefs of the archaeologists involved) can only enhance and improve the interpretation of that record. However, there is never only one possible interpretation of the record, and this is not only a result of imperfect data — there can be multiple versions of the past (Shanks & Tilley 1992, p. 11).
To clarify this, a good example would be a recent televised discussion examining the effect of the Second World War on the class structure of Britain, primarily the idea that the war brought the people together in a common purpose. This debate included historians, and people involved at the time. No consensus was reached — one discussant who had worked in the east end of London during the war clearly showed that the Government was slower to provide suitable shelters here than elsewhere, whereas another involved in looking after evacuees had a somewhat different perspective. Neither was ‘wrong’, in that their individual experiences were true, but nor was either ‘right’ in that their experiences could not be generalised to the whole population. In this case, neither version of the past is correct or false, in that each individuals’ experiences have validity. We can argue that each version is incomplete, which is another matter. We can contrast this with attempts by contemporary right-wing extremists to show that the holocaust did not happen but was an enormous Jewish fraud. We can easily demonstrate that this version of the past is false. Generalising this to the archaeological debate, we cannot prove that one particular version of the past is ‘true’, and in some ways even ostensibly conflicting versions of the same past can both be valid, but we can reject a particular version of the past as being demonstrably untrue.
The fact that there are demonstrably false pasts does not, however, mean that we must adhere to an empiricist or positivist form of interpretation. To use the catch-phrase of the 1989 Newcastle TAG, we can be ‘empirical without being empiricist.’ If, within archaeology, we only present interpretations or conclusions that we can ‘prove’ from the available evidence, our versions of the past will be impoverished. The schema presented by Shennan (1993), following the sociologist Runciman, has much to merit it. Runciman makes a distinction between reportage, explanation, description and evaluation. Shennan sums this up succinctly as follows:
Reportage corresponds in certain respects to the concerns of “middle range theory.” It refers to the process of reporting an event, process or state of affairs as having occurred. Such reports are not, of course, presuppositionless, but they should as far as possible be theory-neutral, in the sense that holders of rival theories should be able to agree on them; reports should not imply or pre-empt particular theoretical positions at the level of explanation. (Shennan 1993, p. 54)
1.2. The theoretical perspective 29
on our theoretical perspectives, our own preoccupations, and even our non-archaeological, perhaps political, aims. If, however, we wish to work towards a holistic view of a particular past society, essential insights can often be gained from different explanations based on different perspectives of the same set of data, an approach which is similar in spirit to the Annales school of history (Bintliff 1991, especially n. 1, pp. 26–7). For example, whilst as a discipline we might reject crude environ-mental determinism, this is not to say that environment has no influence on the development of past societies: environment without the social is as misguided as social with the environment.
The majority of Parts II and III of this work can mainly be classed as reportage, whereas Chapter 15 is primarily explanation, which I have attempted to make concordant with the data previously presented.
Within this work, and primarily within Part III, a number of topics which have generated a large literature have been encountered. For example, the assertion that the polity controlled by Burebista was a state leads to the question: what is a state? The assertion that part of the evidence for this state was the appearance of towns leads in turn to the debate concerning urbanism. The explicitly marxist evolutionary schema within which the late Iron Age of Dacia has usually been examined (Stahl 1992) presents one with the problem of social evolutionism (cf. Sanderson 1990). The most thorny question of all is the identification of certain elements of material culture as being evidence of ethnic groups, the Dacians, the Celts, the germanic Bastarnae, and so on (cf. Shennan 1989). As the aim of Part III of this work is primarily to examine the function of coinage in one particular society, no detailed discussion of these topics has been presented. For example, rather than defining what a ‘town’ is, and then looking for archaeological correlates for this in the excavated evidence (and incidentally running the risk of affirming the consequent; Shennan 1993, p. 54), I have attempted to characterise the settlements from the evidence, and have used the neutral term ‘settlement.’ Likewise, when referring to, for example, a ‘Dacian cup’ (ceas¸ca dacic˘a) this should be understood as a label for a particular ceramic form, and no ethnic attribution should be inferred. By using this ‘bottom-up’ approach, I hope to be able to discuss the problems in hand without, at least at this stage, becoming overly embroiled in topics which have commanded theses in their own right.
The only broad topic which has been extensively examined is that of the nature of ‘money’, see Chapter 2. Even in this case, it was found that a top-down theory-to-archaeology approach was difficult to follow, and that a more satisfactory route was to examine the rˆole of coinage in a particular society, without pre-judging whether this use was ‘monetary’ or not.
is those of use living in a western European capitalist society) can be divided into four organisational cultures Handy (1995). When members of organisations with different cultures meet, without prior warning of the differences in culture, mutual misunderstanding and confusion, and even conflict, arise. The members of each organisation cannot imagine how else an organisation could function. If we generalise this to societies, we can see how easily ethnocentrism can occur. This is particularly true of coinage studies where many scholars presume that we all ‘know’ how coinage and money operates, whereas in fact we know only how it operates within the narrow confines of our own culture. For example, western European delegates at the Computer Applications in Archaeology conference held in Ias¸i, Romania, 1996, found the sight of the conference organiser carrying large bundles of notes around in his rucksack in order to pay for various items highly amusing — most delegates had never operated within a cash dominated system.
Use of anthropological and historical studies, therefore, enable us to view the data from other angles, and to produce interpretations that are less ethnocentric, although still confined by our knowledge and experience. An interesting variant of this problem is encountered in studies of the Roman period: a number of scholars work within the belief that we know what the Roman world was like and all we are doing is infilling the details — an approach I would call ‘romocentrism.’ This could, arguably, be true for late Republican Italy but is an unfortunate straightjacket to which studies of, for example, Roman Britain have been confined (Reece 1988c).
1.3
Archaeology, numismatics, and the study of hoards
Numismatics, especially the use of numismatic evidence for archaeological or historical purposes, is a complex subject. Many general introductions exist for Roman coinage, numismatics and ar-chaeology and it is not proposed to repeat this material here; the reader is referred to Burnett (1991), Casey (1980, 1986), Crawford (1983), Creighton (1992a, chapter 1), Grierson (1975), Haselgrove (1987, chapter 1), Lockyear (1989, chapter 1), Reece (1987a) and Ryan (1988, chapter 1), as well as various papers in Coins and the archaeologist (Casey & Reece 1988). A detailed discussion of numerical techniques used in the study of coin hoards is presented in Chapter 3.
1.4
The rˆole of statistics in archaeology
1.4. The rˆole of statistics in archaeology 31
numerical techniques, what should the rˆole of statistics in archaeology be, and why is this not being fulfilled?
Statistics can perform two primary functions: to influence what we do, and to influence what we think. The former includes answering essentially straightforward questions, although the answers may be less than straightforward to obtain. They include: how many radiocarbon dates should I have done to assess if these two phases are contemporary? How many holes should I dig to assess the archaeological potential of this site? How many coins should I sample to estimate the number of copies? This function mainly concerns the collection of data. The second function is the investigation of existing data: are these two phases contemporary? Is the silver content between group A coins and group B coins significantly different? Is there any patterning in the contents of these hoards? Often, these questions form a cycle with the results of the data collection stage being processed by investigative statistics, which in turn lead to fresh questions and more data collection (Orton 1980, pp. 19–24).
Why, then, are statistics not used as much as they might to fulfil these functions? The answer is threefold:
1. there is a misunderstanding of what statistics can and cannot do and say; 2. statistics have been misused in the past;
3. there is a mistaken association of statistics with a particular theoretical standpoint.
A common complaint voiced is that statistics can be used to ‘prove anything.’ This is wrong: statis-tics cannot prove anything. Many statistical techniques provide one with further information, often in the form of a statement of probability, which influences one’s beliefs and decisions. Decisions, for example, will often be based on non-statistical criteria as well, usually the consequences of mak-ing a mistake (Shennan 1988, pp. 51–3). As an example, the probability of winnmak-ing the National Lottery is 1 in approximately 14,000,000. These are huge odds, so why does anyone bet on it? They bet because the consequences of being wrong, losing £1, are negligible, whereas the consequences of being right, winning in excess of £8,000,000, are substantial. If we reverse the situation and analyse the odds of the O-ring seals on the fuel tanks of a space shuttle failing, we would probably wish to reverse the acceptable odds to 14,000,000 to 1 as the consequences of being wrong would be the death of the astronauts.1 In archaeology, and in the human sciences generally, the odds used are usually 1 in 20; there is nothing magical in this figure and in every case one needs to assess the consequences of being right or wrong.
If one moves away from the idea that statistics can prove something right or wrong, and per-haps towards the use of statistics in an exploratory, investigative way, a way of playing with ideas, or simplifying complex patterns, as being part of an investigative cycle, then many of the misunder-standings of what can be achieved are dissipated.
Secondly, there are two ways in which statistics have been misused. Statistics have often been used as a weapon to be used to ‘prove’ or ‘disprove’ another’s theories: ‘application of the
2
1As happened, the statistical analysis of O-ring failure in the case of Challenger was flawed as only the data about
test demonstrates that no such relationship exists.’ In fact, the test probably demonstrated that at a probability level of 1 in 20, two samples were not statistically significantly different, which is not the same statement at all. Secondly, statistics sometimes appear to be used to obfuscate: after a general introduction, pages of complicated formulæ and graphs are followed by: ‘as can be seen. . . ’ Few question the conclusions, if they even get that far.
Finally, the association of statistics with a particular archaeological theoretical standpoint is a result of the association between processual archaeology and statistics (Shennan 1988, pp. 1–6). In response to Orton’s (1980, p. 13) belief that mathematics can be used as ‘a tool for organising one’s thoughts and data’, Shanks & Tilley (1992, pp. 59) argue that:
Here reason is explicitly reduced to instrumentalism. It is an organ of calculation, of coor-dination, of planning. Reason becomes detached from decision as mathematical reason itself decides the means of approach to the past. The purpose, the aims of a study of the past are attributed to the calculating subject. Reason is detached from the decision to apply reason, the electronic calculator or computer from the creative impulse behind model building, from justifications. The latter can only be detail, subjective and arbitrary. As mathematics is purely formal, it can only become meaningful when meaning itself has been discarded. . . . Yet the self-contained formalism of mathematical explanation is related to its totally opposite, totally and equally meaningless empiricism, the attempt to merely record all facts without any subjective content or bias.
This is utterly to misunderstand Orton’s position and the rˆole that statistics and mathematics can play. ‘Mathematical reason’ does not replace human reason, it can only influence it; mathematical models may describe aspects of the past, but the archaeologist must interpret them. A statistical technique has no (archaeological) theoretical stance2 — the software for correspondence analysis on my hard-disk is not inherently ‘processual’ or ‘post-processual’ but, as soon as I (the researcher) select data for analysis by CA, and even more so when I interpret the results, the analysis gains a theoretical aspect. The technique is atheoretical in terms of archaeology; the analysis, particularly the interpretation of the results, is inherently theoretical. Despite their criticisms of the use of mathematics in archaeology, when faced with a mass of data, e.g., in their study of beer cans, they turn to exploratory statistical methods such as Principal Components Analysis and Principal Co-ordinates Analysis, for help in simplifying that data (Shanks & Tilley 1992).
Statistical methods do, however, have a statistical theoretical basis. To grossly oversimplify, there are two main schools of statistical thought: classical statistics and Bayesian statistics. In the former, the analysis usually proceeds from the position that we know nothing except for the data input into the analysis. If we do know something, perhaps from having plotted a graph, we can be accused of ‘data-snooping’, a grievous sin. Bayesians, however, argue that we do know something in the vast majority of cases, and that this prior knowledge should be incorporated into the analysis, to produce posterior knowledge (Litton & Buck 1995). The practicalities of this were such that Bayesian analyses of any usefulness have only really been possible in recent years with the advent of high-power computers.
1.4. The rˆole of statistics in archaeology 33
In theory, therefore, we could take the ‘expert’ knowledge of a number of archaeologists, and use them as the prior knowledge in the analysis, and obtain a series of possibly different posterior knowledges. Even the ultimate sceptic who would deny validity of either any prior knowledge, or even the validity of the procedure of including such knowledge, can be accommodated. The analysis can be run from a position of ‘great prior uncertainty’, i.e., our prior knowledge is that we do not have any! Such a way of working should appeal to many adherents of the newer theoretical schools.
Given the attractiveness of the idea, why has Bayesian statistics not seen widespread applica-tion? Firstly, the mathematical procedures are non-trivial and Bayesian analyses have to be run in collaboration with specialists in the field. Secondly, as noted above, only recently have techno-logical and theoretical advances been made which enable worthwhile analyses to be undertaken. Lastly, a great majority of statisticians are of the classical school, and of these many view Bayesian methods with some scepticism. Despite this, there has been a recent growth in the application of these methods in archaeology (Litton & Buck 1995).
Given these problems, what future has statistics in archaeology? It is unrealistic to expect every archaeologist to have a good working knowledge of statistics. What would be more useful is if archaeologists had at least some idea of what could be achieved through statistics, and when it would be useful to consult either a parastatistician, or a ‘real’ statistician. Archaeologists innate inability to ask for advice, and to attempt to do things alone, at best results in the re-invention of the wheel, or at worst poor statistical analyses which have had huge financial implications. A similar situation exists, for example, in the design and implementation of databases.
Chapter 2
Money
Underlying a rich diversity of form, money is a single phenomenon. But its nature is not easy to understand, for money gives no information about itself, except that it is money. In revealing itself as money, it is nothing more than a cultural tautology. (Crump 1981, p. 1)
2.1
Introduction
The stimulus for looking at the theory of money, and at anthropological work on money, was two discussions in Coinage and Money under the Roman Republic (Crawford 1985). It is worth citing them at length here. The first discussion occurs in Chapter Two on the early Republic. It begins promisingly:
Absence of coinage, however, does not mean an absence of money, and much of what I have to say here relates to the role of money in the early Republic. But any attempt to discuss the subject must face the problem of the sources. Relentlessly modernising, they persistently discuss the Republic in terms of the monetary conventions of their own times, including, of course, the use of coinage. . . (p. 17)
Crawford then goes on to discuss some of the sources and the use of anachronistic monetary terms and conventions in them. He then states:
It is as true for the Roman world as for the Greek that the most important stage in the early history of money is the designation by the state of a fixed metallic unit. . . (p. 18)
He then states:
As far as the designation of a fixed monetary unit is concerned, there is an alternative tradition, at first sight of considerable plausibility. Romans of the late Republic and after believed that wealth in Rome in early times consisted largely of cattle, whence the word pecunia. . . it was believed that fines in early times were in cattle and sheep and that two laws in the course of the fifth century provided for their conversion into fines of bronze.
Crawford then discusses some more inconsistencies in the historical record concerning the various laws before going on to state:
Quite apart from all the incoherences, I find it incredible that fines were ever levied in Rome in cattle and sheep. Just as in the Homeric world the fact that wealth was thought of as consisting in part of cattle and evaluated in terms of cattle does not mean that cattle were ever used as money for purposes of payment, so for Rome it does not follow from the existence of wealth in the form of cattle that cattle were ever levied as fines. (p. 20)
Crawford then goes on to discuss the creation of a metallic unit designated as ‘a certain weight of bronze’ (p. 20), and for a ‘state designated metallic monetary unit [that] existed at Rome from the middle of the sixth century.’ (p. 21).
It is interesting to contrast this with his discussion of the various large bronze bars such as those with the ‘ramo secco’ pattern found in Eturia, the Po valley and elsewhere in Italy during the late archaic and classical Eturian periods. Here he states:
Yet despite the spread and duration of the fashion, these bars were never more than bullion passing by weight. (p. 6).
Before commenting on this I would like to contrast these statements with his discussion of coinage in modern Romania, roughly ancient Dacia. Crawford reveals his preconceptions in the first para-graph:
It is time to turn from the slave-using to the slave-producing areas of the Balkan peninsula. One of the most remarkable phenomena within the pattern of monetary circulation in antiquity is the presence of large numbers of Roman Republican denarii. . . on the soil of present day Romania. . . the total comes to something like 25,000 pieces. (pp. 226–7)
This total is made more remarkable by the lack of coin hoards in neighbouring areas although in Bulgaria this is more likely to be due to the lack of publication. Crawford (1980) dismisses the possibility of large numbers of these coins being copies despite the cast coins from Breaza and the dies from Tilis¸ca and Ludes¸ti known at that time (Lupu 1967; Stoicovici & Winkler 1971; Chit¸escu 1980; Chit¸escu 1981). Crawford believes that the presence of these coins in this area is due to the slave trade (here he summarises Crawford 1977a). He goes on to state:
If one turns to consider the social and economic significance of these finds, it seems likely that the presence of a variety of coinages. . . has little to do with the operation of a money economy. . .
The virtual absence of any small denominations means that none of the coinages. . . can have functioned very effectively as a means of exchange in a market economy. And the readi-ness. . . to use coins of. . . differing weight standards without any consistent attempt to produce its own suggests that the coinages functioned perhaps only in a rather rough and ready way as a measure of value.
The answer lies. . . with coinage being used rather for the exchange of gifts. . . its function was presumably to define and enhance the status of a local aristocracy. . .
Coinage is in fact to be envisaged as for the most part a fashionable form in which to hold and display wealth. . . the origin of the fashion perhaps lies in a perception of the power of money in the civilised world. . . there of course the power derived from a real economic
2.1. Introduction 37
Crawford then contrasts this view with that of some Romanian scholars (such as Chit¸escu) who would like to see the existence of a unified state under Burebista with a monetary economy. Most of the last quotation is entirely plausible, perhaps more so than the opposing views expressed by Romanian scholars before the fall of Ceaus¸escu.1 It is interesting to note that throughout this discussion no reference is made to the large amount of work on ‘gift economies’, including Mauss’ seminal work The Gift originally published in 1925 (Mauss 1990). Crawford’s one reference is to a numismatist’s warnings about the difficulty in interpreting coin evidence (Grierson 1959). His arguments about the slave trade are entirely dependent on his assertion that all but a few of the coins are genuine, and that there were no other imports into Italy from Romania. His real prejudices are revealed in footnote 43 (p. 233) which it is worth quoting at length:
I note in passing that, grosso modo, amphoras and pots (and their imitations) predominate outside the mountains which surround Transylvania, silver-ware, bronze-ware and coins (and their imitations) predominate within; there is not enough evidence for glass-ware and other assorted objects to detect a pattern;. . . I suppose the difference to correspond to a difference of fashion; within the mountains one threw silver around, without them one got drunk. Burebista eventually attempted to ban wine, Strabo vii, 3, 1 (303–4), and he may have also tried to stop or reduce the slave trade. (n. 42, p. 233, emphases Crawford’s)
In a work entitled Coinage and Money it is surprising that there is no discussion at all as to what money is; no definition is offered, nor are there any references that this author can find to the literature on the theory of money. In the first discussion quoted above it is hard to see the difference between his ‘money as weights of metal’ concept, and the ‘ramo secco’ bars he discusses earlier.
His discussion of the rˆole of cattle in the ancient world is fascinating. Only two reasons are really given for dismissing them as money:
1. that the sources are contradictory 2. his own incredulity
There is a considerable literature on the cattle economies of Africa (e.g., Neale 1976, pp. 41–44), and good evidence for the use of cattle in payments in early Medieval Ireland. This topic will be discussed in more detail (section 2.3.1). Most definitions of money include its function as a store of value and a unit of account (see below), as well as a means of payment. Crawford seems at this point to believe that money’s primary rˆole is as a means of payment but it is not discussed here.2 As to the contradictory sources, it would be more worrying if they were in total agreement as this would suggest one common source.
With the Romanian evidence Crawford plays lip service to more sophisticated interpretations of the rˆole of value items in societies but does not attempt to analyse them at all. In the footnote quoted above he is seemingly unaware of some of the problems of using archaeological data. It is
1
It is clear that the influence of the modern Romanian state has led to work being constrained to fit Party ideology. The question of Burebista and his ‘state’ is one of these. For example, see Cris¸an (1979). Conversations with Romanian scholars have revealed their acute awareness of this problem (Mih˘ailescu-Bˆırliba 1994a; Mih˘ailescu-Bˆırliba 1994b).
2Crawford (1970) does argue that coinage primarily represents a means of payment in the Republican period, and that