Performance Analysis of Cure and Rock
Algorithms on Constructing a New Attribute
with Mixed Datasets
Sagunthaladevi.S1, Dr.Bhupathi Raju Venkata Rama Raju2
Research Scholar, Dept. of Computer Science,Mahatma Gandhi University, Meghalaya, India1
Professor, Dept. of Computer Science, IEFT College of Engineering, Villupuram, Tamilnadu, India2
ABSTRACT: Classification is one of the important data mining forms which are used to classify the data in different forms. As databases are rich with hidden information which can be used for intelligent decision making, Classification can be used to extract models describing important data classes. According to the computational learning theory, sample size in machine learning problems has a major outcome on the learning performance. Faced with this issue, adding some artificial data to the system in order to accelerate acquiring learning stability and to increase learning accuracy is one effective approach. To build a correct classification model, sufficient amount of training data is required. But, In the real world, there are many situations when organizations must work with small data sets. How to extract more effective information from a small data set is thus of considerable interest. Constructing a new attributes provides a better and faster data classification. In this work constructs a new attributes for both numerical and categorical attributes for improve the performance of the classification with the help of CURE and Rock algorithms.
KEYWORDS: Classification, Clustering, Prediction, CURE algorithm, ROCK algorithm.
I. INTRODUCTION
Classification consists of predicting a certain outcome based on a given input. In order to predict the outcome, the classification algorithm processes a training set containing a set of attributes and the respective outcome, usually called goal or prediction attribute. The algorithm tries to discover relationships between the attributes that would make it possible to predict the outcome. Next the algorithm is given a data set not seen before, called prediction set, which contains the same set of attributes, except for the prediction attribute – not yet known. The algorithm analyses the input and produces a prediction. The prediction accuracy defines how “good” the algorithm is. To build a correct classification model sufficient amount of training data is required. But In the real world, there are many situations when organizations must work with small data sets. For example, with the pilot production of a new product in the early stages of a system, dealing with a small number of VIP customers, and some special cancers, such as bladder cancer for which there are only a few medical records. In the early time of a new system development, data on hand are not enough, hence, data characteristics such as data distribution, mean, and variance are unknown. As well as a decision is hard to make under the limit data condition.
II. RELATEDWORK
A novel framework of learning the unified kernel machines for both labeled and unlabeled data developed by Hoi et al. [2006]. This framework includes semi supervised learning, supervised learning and active learning. Also, a spectral kernel is proposed, where it classifies the given labeled data and unlabeled data efficiently. Though the kernel methods have many interesting features, reducing the training time and classification time are the two major issues concerned with practitioners and researchers. To speed up the training time and classification performance, many techniques have been proposed in the literature. Support Vector Machine is originally used to symbolize popular and modern classifiers that have a well-defined theoretical foundation to provide some enviable performances.
Reproducing kernel Hilbert space framework for information theoretic learning was proposed by Xu et al. [7]. The framework uses the symmetric nonnegative definite kernel function i.e. cross information potential. Though this framework gives better result than the previous RKHS frameworks, still there is an issue to choose an appropriate kernel function for a particular domain.
Shilton and Palaniswami [8] defined a unified approach to support vector machines. This unified approach is formulated for binary classification and later on extended to one - class classification and regression. Some of the techniques that have been proposed to speed up the training time are sequential minimal optimization, modified
sequential minimal optimization, decomposition method and low rank kernel matrix construction method. The classification time of SVM primarily depends on the number of Support Vectors (SVs) involved in the system. So, it is necessary to minimize the number of support vectors that can improve the efficiency and minimize the computation time of the classification process.
Kumar et al. [9] explored a binary classification framework for two stage multiple kernel learning. The distinct advantage of this binary classification framework is that it is easier to leverage research in binary classification and to develop scalable and robust kernel based algorithms. However, kernel methods are processed by operations to the kernel function (such as Gaussian and polynomial kernels) for the data, ignoring both the structure of the input data and the dimensionality problem, and thus cannot always guarantee that the transformed space is useful for classification. The commonly used kernels are the so-called all-function or general purpose ones, such as the Gaussian and polynomial.
Takeda et al. [10] proposed a unified robust classification model that optimizes the existing classification models like SVM, Min-Max probability machine and fisher discriminant analysis. It provides several benefits like well - defined theoretical results extends the existing techniques and clarifies relationships among existing models. Basically, Support vector machines (SVM) are considered as a must try it offers one of the most robust and accurate methods among all well-known algorithms. It has a sound theoretical foundation, requires only a dozen examples for training, and is insensitive to the number of dimensions. In addition, efficient methods for training SVM are also being developed at a fast pace. In a two-class learning task, the aim of SVM is to find the best classification function to distinguish between members of the two classes in the training data. The metric for the concept of the best classification function can be realized geometrically.
III.METHODOLOGY
An attribute is a property or characteristic of an object. Each object is described by a collection of attributes. There are two different types of attributes. Numerical attributes: It can be ordered by numbers. Categorical attributes: It cannot be ordered by their values, but can be separated into groups. Dataset can be classified into two different types, such as numerical dataset and categorical dataset. Numerical dataset values or observations can be measured. Scatter plots and line graphs are used to graph numerical data. Categorical Dataset values or observations can be sorted into groups or categories. Bar charts and pie graphs are used to graph categorical data.
The sample data set is small as it is having only five records in it. There are three attributes available in the data set and this data set contains two class labels as A and B. It contains both numerical and categorical attributes. This insufficient data will not lead to a robust classification performance. So this project constructs a new attributes for both numerical and category attribute to improve the performance of the classification.
IV.IMPLEMENTATION
To get a better feel for how CURE and ROCK performs in practice must run these on real-life as well as synthetic data sets. We use real-life data sets to compare the quality of clustering due to CURE and ROCK with the clusters generated by a traditional centroid-based hierarchical clustering algorithm [DH73, JD88]. The synthetic data sets, on the other hand, are used primarily to demonstrate the scalability properties of CURE and ROCK. For CURE and ROCK, in all the experiments, we used the similarity function for categorical data. In the traditional algorithm, we handle categorical attributes by converting them to boolean attributes with 0/1 values. For every categorical attribute, we define a new attribute for every value in its domain. The new attribute is 1 if and only if the value for the original categorical attribute is equal to the value corresponding to the boolean attribute. Otherwise, it is 0. We use euclidean distance as the distance measure between the centroids of clusters. Also, outlier handling is performed even in the traditional hierarchical algorithm by eliminating clusters with only one point when the number of clusters reduces to 1/3 of the original number. Five data sets are employed in this section. The Bach Chorales, CALIT2 Building People Counts, Dodgers Loop Sensor, Servo and Teaching Assistant Evaluation data sets are downloaded from the UCI Machine Learning Repository database for analysis.
BACH CHORALES DATA SET
Time-series data based on chorales; challenge is to learn generative grammar; data in Lisp.
Data Set Information:
Sequential domain, Single- line melodies of 100 Bach chorales (originally 4 voices). The melody line can be studied independently of other voices. The grand challenge is to learn a generative grammar for stylistically valid chorales (see references and discussion in "Multiple Viewpoint Systems for Music Prediction").
Attribute Information:
Number of Attributes: 6 (nominal) per event
(1) start-time, measured in 16th notes from chorale beginning (time 0) (2) pitch, MIDI number (60 = C4, 61 = C#4, 72 = C5, etc.)
(3) duration, measured in 16th notes
(4) key signature, number of sharps or flats, positive if key signature has sharps, negative if key signature has flats (5) time signature, in 16th notes per bar
(6) fermata, true or false depending on whether event is under a fermata Attribute domains (all integers):
(c) {1,...,16} (d) {-4,...,+4} (e) {12,16} (f) {0,1}
CALIT2 BUILDING PEOPLE COUNTS DATA SET
Data comes from the main door of the CalIt2 building at UCI.
Data Set Information:
Observations come from 2 data streams (people flow in and out of the building), over 15 weeks, 48 time slices per day (half hour count aggregates). The purpose is to predict the presence of an event such as a conference in the building that is reflected by unusually high people counts for that day/time period.
Attribute Information:
1. Flow ID: 7 is out flow, 9 is in flow 2. Date: MM/DD/YY
3. Time: HH:MM:SS
4. Count: Number of counts reported for the previous half hour
Rows: Each half hour time slice is represented by 2 rows: one row for the out flow during that time period (ID=7) and one row for the inflow during that time period (ID=9)
Attributes in events file ("ground truth") 1. Date: MM/DD/YY
2. Begin event time: HH:MM:SS (military) 3. End event time: HH:MM:SS (military) 4. Event name (anonymized)
DODGERS LOOP SENSOR DATA SET
Loop sensor data was collected for the Glendale on ramp for the 101 North freeway in Los Angeles.
Data Set Information:
This loop sensor data was collected for the Glendale on ramp for the 101 North freeway in Los Angeles. It is close enough to the stadium to see unusual traffic after a Dodgers game, but not so close and heavily used by game traffic so that the signal for the extra traffic is overly obvious.
Attribute Information:
1. Date: MM/DD/YY
2. Time: (H)H:MM (military time)
3. Count: Number of cars measured for the previous five minutes Rows: Each five minute time slice is represented by one row For .events file:
1. Date: MM/DD/YY
2. Begin event time: HH:MM:SS (military) 3. End event time: HH:MM:SS (military) 4. Game attendance
SERVO DATA SET:
Data is taken from a simulation of a servo system.
Data Set Information:
Ross Quinlan: This data was given to me by Karl Ulrich at MIT in 1986. I didn't record his description at the time, but here's his subsequent (1992) recollection: "I seem to remember that the data was from a simulation of a servo system involving a servo amplifier, a motor, a lead screw/nut, and a sliding carriage of some sort. It may have been on of the translational axes of a robot on the 9th floor of the AI lab. In any case, the output value is almost certainly a rise time, or the time required for the system to respond to a step change in a position set point."
(Quinlan, ML'93) "This is an interesting collection of data provided by Karl Ulrich. It covers an extremely non-linear phenomenon - predicting the rise time of a servomechanism in terms of two (continuous) gain settings and two (discrete) choices of mechanical linkages."
Attribute Information:
1. motor: A,B,C,D,E 2. screw: A,B,C,D,E 3. pgain: 3,4,5,6 4. vgain: 1,2,3,4,5 5. class: 0.13 to 7.10
TEACHING ASSISTANT EVALUATION DATA SET
The data consist of evaluations of teaching performance; scores are "low", "medium", or "high".
Data Set Information:
The data consist of evaluations of teaching performance over three regular semesters and two summer semesters of 151 teaching assistant (TA) assignments at the Statistics Department of the University of Wisconsin-Madison. The scores were divided into 3 roughly equal-sized categories ("low", "medium", and "high") to form the class variable.
Attribute Information:
1. Whether of not the TA is a native English speaker (binary); 1=English speaker, 2=non-English speaker 2. Course instructor (categorical, 25 categories)
3. Course (categorical, 26 categories)
4. Summer or regular semester (binary) 1=Summer, 2=Regular 5. Class size (numerical)
6. Class attribute (categorical) 1=Low, 2=Medium, 3=High
V. RESULTS&DISCUSSION
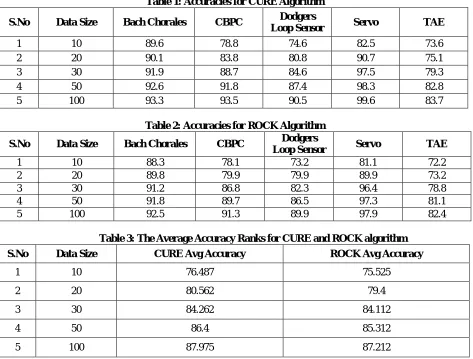
Table 1: Accuracies for CURE Algorithm S.No Data Size Bach Chorales CBPC Dodgers
Loop Sensor Servo TAE
1 10 89.6 78.8 74.6 82.5 73.6 2 20 90.1 83.8 80.8 90.7 75.1 3 30 91.9 88.7 84.6 97.5 79.3 4 50 92.6 91.8 87.4 98.3 82.8 5 100 93.3 93.5 90.5 99.6 83.7
Table 2: Accuracies for ROCK Algorithm S.No Data Size Bach Chorales CBPC Dodgers
Loop Sensor Servo TAE
1 10 88.3 78.1 73.2 81.1 72.2 2 20 89.8 79.9 79.9 89.9 73.2 3 30 91.2 86.8 82.3 96.4 78.8 4 50 91.8 89.7 86.5 97.3 81.1 5 100 92.5 91.3 89.9 97.9 82.4
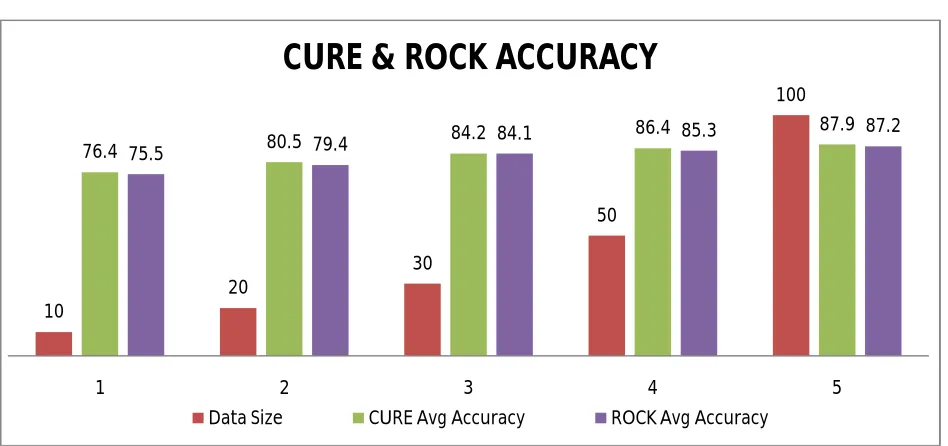
Table 3: The Average Accuracy Ranks for CURE and ROCK algorithm S.No Data Size CURE Avg Accuracy ROCK Avg Accuracy
1 10 76.487 75.525
2 20 80.562 79.4
3 30 84.262 84.112
4 50 86.4 85.312
5 100 87.975 87.212
Figure 1: Average Accuracy Graph for both CURE and ROCK Algorithm
VI. CONCLUSION
This paper discussed about a novel technique to solve attribute construction problem. First, the original mixed dataset is divided into two sub datasets: the pure categorical dataset and the pure numeric dataset. Next, apply CURE clustering algorithm on Numerical Dataset and apply ROCK clustering algorithm on Categorical Dataset. Finally, the clustering results on the categorical and numeric dataset are combined as a categorical dataset, on which the designed for one type of features to handle numeric and nonnumeric feature values. Our main contribution on this thesis is to provide an algorithm framework for the mixed attributes classification problem, on which existing clustering algorithms can be easily integrated, the capabilities of different kinds of clustering algorithms and characteristics of different types of datasets could be fully exploited.
REFERENCES
[1] Qasem A. Al-Radaideh, Eman Al Nagi, “Using Data Mining Techniques to Build a Classification Model for Predicting Employees Performance”, (IJACSA) International Journal of Advanced Computer Science and Applications, Vol. 3, No. 2, 2012.
[2] Mohd. Mahmood Ali, Mohd. S. Qaseem, Lakshmi Rajamani, A. Govardhan, “Extracting Useful Rules through Improved Decision Tree Induction Using Information Entropy”, International Journal of Information Sciences and Techniques (IJIST) Vol.3, No.1, January 2013.
[3] Andreas G.K. Janecek, Wilfried N. Gansterer, “On the Relationship between Feature Selection and Classification Accuracy”, JMLR: Workshop and Conference Proceedings 4: 90-105, 2008.
[4] P.Niyogi, F.Girosi, and P.Tomaso, “Incorporating Prior Information in Machine Learning by Creating Virtual Examples,” Proc. IEEE, vol. 86, no. 11, pp. 2196-2209, Nov. 1998.
[5] Limère A, Laveren E, and Van Hoof, K. “A classification model for firm growth on the basis of ambitions, external potential and resources by means of decision tree induction”, Working Papers 2004 027, University of Antwerp, Faculty of Applied Economics.
[6] Hoi, S. C., Lyu, M. R, Chang, E. Y. (2006). “Learning the unified kernel machines for classification, In Proceedings of the 12th ACM SIGKDD international conference on Knowledge discovery and data mining”, pp. 187-196.
[7] Xu, J. W., Paiva, A. R., Park, I., and Principe, J. C. (2008). A reproducing kernel Hilbert space framework for information-theoretic learning, IEEE Transactions on Signal Processing, Volume 56, Issue 12, pp.5891-5902.
[8] Shilton, A., and Palaniswami, M. (2008). “A Unified Approach to Support Vector Machines”, In B. Verma, & M. Blumenstein (Eds.), Pattern Recognition Technologies and Applications: Recent Advances, pp. 299-324.
10
20
30
50
100
76.4 80.5 84.2
86.4 87.9
75.5 79.4 84.1
85.3 87.2
1 2 3 4 5
CURE & ROCK ACCURACY
[9] Seema Maitrey, C. K. Jha, Rajat Gupta, Jaiveer Singh, “Enhancement of CURE Clustering Technique in Data Mining”, National Conference on Development of Reliable Information Systems, Techniques and Related Issues (DRISTI), Proceedings published in International Journal of Computer Applications (IJCA), 2012.
[10] Takeda, A., Mitsugi, H., and Kanamori, T. (2012). “A unified robust classification model”,arXiv preprint arXiv:1206.4599. J. Han and M. Kamber, Data Mining: Concepts and Techniques, Morgan Kaufmann Publish, 2001
[11] Raj Kumar, Dr. Rajesh Verma, “Classification Algorithms for Data Mining: A Survey”, International Journal of Innovations in Engineering and Technology (IJIET), Vol. 1 Issue 2 August 2012, ISSN: 2319 – 1058, pg: 7-14
[12] C. Kim and C.H. Choi, “A Discriminant Analysis Using Composite Features for Classification Problems,” Pattern Recognition, vol. 40, no. 11, pp. 2958-2966, 2007
[13] Introduction to Data Mining and Knowledge Discovery, Third Edition ISBN: 1-892095-02-5, Two Crows Corporation, 10500 Falls Road, Potomac, MD 20854 (U.S.A.), 1999.
[14] Data Mining Concepts and Techniques, Third Edition ISBN: 978-0-12-381479-1, Morgan Kaufmann Publishers, 225Wyman Street, MA 02451 (USA), 2012.
[15] Muhammad Husnain Zafar and Muhammad Ilyas, “A Clustering Based Study of Classification Algorithms”, International Journal of Database Theory and Application Vol.8, No.1, pp.11-22, 2015.
[16] Yogita Rani, Manju & Harish Rohil, “Comparative Analysis of BIRCH and CURE Hierarchical Clustering Algorithm using WEKA 3.6.9”, The SIJ Transactions on Computer Science Engineering & its Applications (CSEA), Vol. 2, No. 1, January-February 2014.
[17] Mierswa, I, “Evolutionary learning with kernels: a generic solution for large margin problems”, In Proceedings of the 8th annual conference on Genetic and evolutionary computation, ACM, New York,pp. 1553-1560, 2006.
[18] Sivaramakrishnan K.R, Karthik K. and Bhattacharyya, “Kernels for Large Margin Time-Series Classification, International Joint Conference on Neural Networks, pp. 2746-2751, 2007.
[19] Hofmann T, Schölkopf B, and Smola A.J, “Kernel Methods in Machine Learning, the Annals of Statistics”, Volume 36, pp. 1171-1220, 2008. [20] Kuo-Ping Wu and Sheng-De Wang, “Choosing the kernel parameters for support vector machines by the inter-cluster distance in the feature space, Pattern Recognition”, Volume 42, Issue 5,pp. 710-717, ISSN 0031-3203, 2009.
[21] Y.Muto and Y.Hamamoto, “Improvement of the Parze n Classifier in Small Training Sample Size Situations,” Intelligent Data Analysis, vol. 5, no. 6, pp. 477-490, 2001.
[22] D.C. Li and C.W. Liu, “A Neural Network Weight Determination Model Designed Uniquely for Small Data Set Learning,” Expert Systems with Applications, vol. 36, pp. 9853-9858, 2008.
[23] Mrs.Sagunthaladevi.S and Dr.Bhupathi Raju Venkata Rama Raju, “Classification Techniques in Data Mining: An Overview”, Global Journal of Engineering Science and Researches, Volume 3, Issue 7, July 2016.