Selective Constraints on Intron Evolution in Drosophila
John Parsch
1Department of Biology II, Section of Evolutionary Biology, University of Munich (LMU), Munich 80333, Germany Manuscript received May 5, 2003
Accepted for publication August 11, 2003
ABSTRACT
Intron sizes show an asymmetrical distribution in a number of organisms, with a large number of “short” introns clustered around a minimal intron length and a much broader distribution of longer introns. In Drosophila melanogaster, the short intron class is centered around 61 bp. The narrow length distribution suggests that natural selection may play a role in maintaining intron size. A comparison of 15 orthologous introns among species of theD. melanogastersubgroup indicates that, in general, short introns are not under greater DNA sequence or length constraints than long introns. There is a bias toward deletions in all introns (deletion/insertion ratio is 1.66), and the vast majority of indels are of short length (⬍10 bp). Indels occurring on the internal branches of the phylogenetic tree are significantly longer than those occurring on the terminal branches. These results are consistent with a compensatory model of intron length evolution in which slightly deleterious short deletions are frequently fixed within species by genetic drift, and relatively rare larger insertions that restore intron length are fixed by positive selection. A comparison of paralogous introns shared among duplicated genes suggests that length constraints differ between introns within the same gene. ThejanusA,janusB, andocnusgenes share two short introns derived from a common ancestor. The first of these introns shows significantly fewer indels than the second intron, although the two introns show a comparable number of substitutions. This indicates that intron-specific selective constraints have been maintained following gene duplication, which preceded the divergence of theD.melanogasterspecies subgroup.
I
NTRONIC sequences, which interrupt exons and are suggest that intron size is subject to natural selection. removed through splicing, are nearly universal in For example, the distribution of intron lengths in Dro-eukaryotes (Nixonet al. 2002;Simpsonet al. 2002). How- sophila melanogaster and several other organisms with ever, the general functional and evolutionary importance well-characterized genomes is asymmetrical, with many of introns remains unclear. Large-scale comparisons of introns falling into a narrow distribution around a “min-intron sequences within genomes indicate that only a imal” intron length and the remaining introns showing small fraction of their sequence contains information a much broader distribution of lengths ranging from necessary for proper splicing (Mountet al. 1992). Aside hundreds to thousands of base pairs (Mountet al. 1992; from GT and AG dinucleotides at the 5⬘and 3⬘splice sites, DeutschandLong1999;Yuet al. 2002). InD. melanogas-respectively, and an A nucleotide required for branchpoint ter, minimal introns have lengths centered around 61⫾ formation, there are no intronic sequences under absolute 10 bp (Yuet al. 2002), although the boundary separating constraint. Preferred consensus sequences providing infor- introns into the “short” and “long” classes is not discrete mation for splice site and branchpoint selection are (ComeronandKreitman2000). The relatively narrow limited to a few nucleotides surrounding those positions length distribution of short introns suggests that natural and show a relatively high level of variation among in- selection may be involved in the maintenance of intron trons (Mount et al. 1992; Longand Deutsch1999). size.In addition, interspecific comparisons of orthologous Over evolutionary time, transitions from the short introns indicate that there is little constraint on nucleo- to the long intron size class appear to be rare events tide sequence, as introns undergo nucleotide substitu- (Stephanet al. 1994;Moriyamaet al. 1998).Stephan tions at rates comparable to pseudogenes and fourfold et al. (1994) compared 17 intron sequences available degenerate codon positions (GraurandLi2000). This from at least two species of the D. melanogasterspecies suggests that introns evolve neutrally (or nearly so) at subgroup and observed no changes in length class. In the level of DNA sequence. Despite this apparent lack comparisons between more distantly related species (i.e., of primary sequence constraint, several observations D.melanogaster vs.D.pseudoobscuraorD.melanogaster vs. D.virilis) transitions between size classes were observed, although these transitions were typically accompanied 1Address for correspondence:Department of Biology II, Section of
Evo-by an increase in polypyrimidine content just upstream lutionary Biology, University of Munich (LMU), Luisenstrasse 14,
of the 3⬘splice site in the longer intron (Stephanet al. Munich 80333, Germany.
E-mail: [email protected] 1994). This observation is consistent with the proposal
that different splicing mechanisms are used for short nine different genes across species of theD.melanogaster species subgroup. The advantage of comparing introns and long introns (Mountet al. 1992) and suggests that
multiple compensatory mutations may be necessary for from within this species group is that they are divergent enough (at least 10 million years) for many changes to a size transition to occur.
Further evidence for natural selection acting on in- have occurred, yet similar enough to allow for reliable alignment. Because the phylogenetic relationship of tron size comes from the relationship between intron
length and recombination rate.CarvalhoandClark these species is known, it is possible to classify indels as either insertions or deletions in most cases. In addition, (1999) reported a significant negative correlation
be-tween intron length and recombination rate inD.mela- the observed sequence changes are those that have been fixed between species and thus are changes that are nogaster. This observation can be explained by natural
selection, which is expected to be stronger in regions positively selected, neutral, or only very slightly deleteri-ous. The results indicate that, in general, short introns of high recombination, favoring shorter introns. In
ad-dition, introns in the size range of 60–80 bp occur on are not under greater sequence or length constraints than long introns. There is an overall indel bias toward average more in regions of higher recombination than
do introns shorter than 60 bp or introns longer than short deletions. However, intron length is relatively well conserved across species, suggesting the selective fixa-80 bp, suggesting weak natural selection for both
mini-mal and maximini-mal intron length (CarvalhoandClark tion of less-frequent, longer insertions. Finally, a com-parison of paralogous introns shared among duplicated 1999).ComeronandKreitman(2000) found a similar
negative correlation between intron length and recom- genes suggests that length constraints may be intron-specific and can differ between introns within the same bination inD.melanogaster, although they did not find
evidence for weak natural selection against very short gene. introns (⬍60 bp). These authors proposed that introns
act as modifiers of recombination. Longer introns
in-MATERIALS AND METHODS crease the probability of recombination between weakly
selected sites in adjacent exons and thus reduce interfer- Intron-containing sequences that were available from at ence selection. Since interference between selected sites least seven of the eight species of theD.melanogasterspecies subgroup (D. melanogaster, D. simulans, D. sechellia, D. mauri-is expected to be greater in regions of low
recombina-tiana,D.yakuba, D. teissieri,D. erecta, orD.orena) were down-tion, this model also predicts a negative correlation
be-loaded from GenBank. A recently described member of the tween intron length and recombination rate.
species group, D. santomea (Lachaise et al. 2000), was not Finally, there is growing evidence for a functional link included in this study due to the paucity of available sequences. between intron length and gene expression.Castillo- The final data set consisted of 15 introns from nine different genes:Alcohol dehydrogenase(Adh),Amylase-related(Amyrel),
An-Daviset al. (2002) reported a strong negative
correla-dropin(Anp),Cecropin C(CecC),janusA(janA),janusB(janB), tion between intron length and expression level in
geno-ocnus(ocn),roughex(rux), andSuperoxide dismutase(Sod). The mic surveys of both Caenorhabditis elegans and Homo
GenBank accession numbers for each gene are as follows: sapiens. This can be explained by a negative fitness cost Adh (M17827, M36582, X04672, M19264, X54120, X54118, associated with the transcription of long introns. Since X54116, Z00032), Amyrel (U69607, U96159, AF039558, U96157, AF280878, AF280879, AF039562, U96158), Anp the transcription of apparently unnecessary intronic
se-(X56726, AB047040–AB047045), CecC (Z11167, AB047056– quences costs the organism both time and energy (in the
AB047062), janA (M27033, AY013339–AY013344), janB form of ATP), natural selection is expected to minimize
(M27033, AY013345–AY013351),ocn(AF231190, AY013352– intron length in genes that are transcribed at high levels. AY013358), rux (AE003436, AF327884–AF327890), and Sod Further evidence suggests that introns of minimal length (X13780, X15685, AF127155–AF127160).
To construct a phylogenetic tree of theD.melanogaster spe-may be selectively maintained in genes due to a
syner-cies subgroup, protein-encoding sequences from a subset of gistic relationship between RNA processing and RNA
the above genes for which orthologous sequences were avail-export from the nucleus (Yuet al. 2002). A number of
able from the outgroup species,D. pseudoobscura, were used. experimental studies in yeast, mice, and Drosophila have The accession numbers for theD.pseudoobscurasequences are indicated that the presence of a short intron leads to X64489 (Adh), U82556 (Amyrel), S77099 (janAandjanB), and U47871 (Sod). A 50% majority-rule consensus parsimony tree higher levels of gene expression relative to an intronless
based on the concatenated protein-encoding sequences was gene (Choiet al. 1991;Palmiteret al. 1991;Holstege
generated using PAUP* (Swofford2000). All nodes of this et al. 1998; Llopart et al. 2002). However, selection
tree were supported by bootstrap values of at least 68%, with may not always favor the presence of short introns that the exception of those connecting species of theD.simulans increase gene expression. In the case of thejingweigene, clade (D.simulans,D.sechellia, andD.mauritiana), which could not be resolved with ⬎50% support. In this case, the three which shows an intron presence-absence polymorphism
species were assumed to be equally related to each other, withinD.teissieri, population genetics data suggest that
descending from a common polytomic node. the intronless form is favored by selection (Llopartet
Intron sequences were aligned using a hierarchical
ap-al. 2002). proach. That is, the sequences were first aligned within three
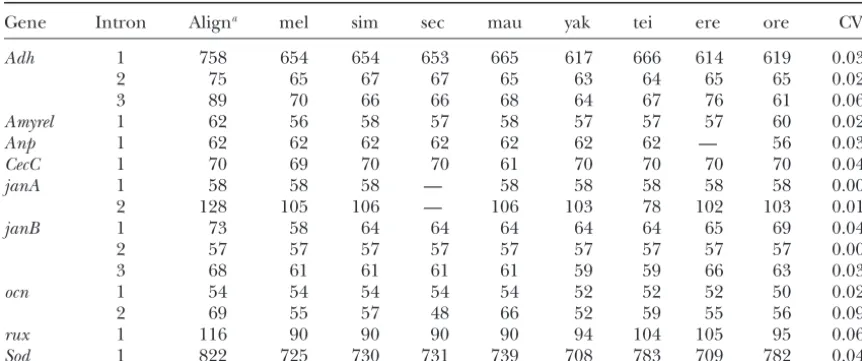
TABLE 1
Intron lengths (in base pairs) in species of theD.melanogastersubgroup
Gene Intron Aligna mel sim sec mau yak tei ere ore CVb
Adh 1 758 654 654 653 665 617 666 614 619 0.035
2 75 65 67 67 65 63 64 65 65 0.021
3 89 70 66 66 68 64 67 76 61 0.066
Amyrel 1 62 56 58 57 58 57 57 57 60 0.021
Anp 1 62 62 62 62 62 62 62 — 56 0.037
CecC 1 70 69 70 70 61 70 70 70 70 0.046
janA 1 58 58 58 — 58 58 58 58 58 0.000
2 128 105 106 — 106 103 78 102 103 0.010
janB 1 73 58 64 64 64 64 64 65 69 0.047
2 57 57 57 57 57 57 57 57 57 0.000
3 68 61 61 61 61 59 59 66 63 0.037
ocn 1 54 54 54 54 54 52 52 52 50 0.028
2 69 55 57 48 66 52 59 55 56 0.094
rux 1 116 90 90 90 90 94 104 105 95 0.067
Sod 1 822 725 730 731 739 708 783 709 782 0.040
mel,D. melanogaster; sim,D. simulans; sec,D. sechellia; mau,D. mauritiania; yak,D. yakuba; tei,D. tessieri; ere, D. erecta; ore,D. orena.
aTotal base pairs (including gaps) in the sequence alignment.
bCoefficient of variation for intron length among species.
D. mauritiana; (2)D. yakubaandD.teissieri; and (3) D. erecta able from all eight species of the subgroup, with the andD.orena. Initial alignments were performed using ClustalX exception of the twojanAintrons (which were unavail-(Thompsonet al. 1997) with a gap opening penalty of 15 and
able fromD. sechellia) and the Anp intron (which was a gap extension penalty of 5. A complete alignment of all
unavailable from D. erecta). The total length of the species was then generated by aligning the subsets using the
gap penalties given above and without resetting gaps. For aligned intron sequences was 2561 bp. This includes 981 some of the introns, the computer-generated alignments were bp from short introns and 1580 bp from long introns. A adjusted by eye. In these cases, the general strategy was to
summary of the intron lengths is given in Table 1. The favor mismatches to minimize the number of gaps, while
en-two long introns show greater length changes among suring that the 5⬘(GT) and 3⬘(AG) splice signals and other
species in terms of numbers of base pairs, but there is conserved sequence blocks remained aligned. The complete
alignments are presented in supplemental Figure 1 available not greater variance in intron length in long introns at http://www.genetics.org/supplemental/. The numbers of after correcting for intron size. The average coefficient substitutions, insertions, and deletions that have occurred in
of variation (CV) for short intron length is 4.3% and the each intron were inferred by parsimony, assuming the
phylo-average CV for long intron length is 3.9%. Thus there genetic relationship indicated by the protein-encoding
se-quences. In the case of theD. simulansspecies complex, for is no evidence for greater length constraints on short which the phylogenetic relationship was unclear, a conserva- introns. If anything, the short introns show greater tive approach was used. That is, a substitution or indel shared length variation, although this is not significant, given by any two of the three species was assumed to have a single
the limited sample size of long introns. origin. In the case of ambiguous indels (those that could not
Comparison of nucleotide substitutions and indels: be classified as insertions or deletions due to the lack of an
appropriate outgroup sequence), the indel was assigned the A consensus parsimony tree of the D. melanogaster minimum length possible under parsimony. A complete list species subgroup based on the concatenated protein-of all indels and their lengths is provided in supplemental
encoding sequences of theAdh,Amyrel,janA,janB, and Figure 2 available at http://www.genetics.org/supplemental/.
Sodgenes is shown in Figure 1. These genes were chosen due to the availability of an orthologous sequence inD.
RESULTS pseudoobscura, which was used as an outgroup. The same
general topology was produced using the concatenated
Intron length variation in theD.melanogasterspecies
intron sequences of all nine genes used in this study
subgroup:The data set consists of 15 introns from nine
(not shown), although an outgroup sequence could not different genes (Table 1). Of the 15 introns, 13 fall into
be used for the introns due to either the lack of an the short-size class (average length range is 53–100 bp),
available sequence or ambiguity of alignment. There is and 2 fall into the long-size class (average lengths are
some uncertainty as to the relationship of the species of 643 and 738 bp). Consistent with previous reports (
Ste-theD.simulanscomplex (D.simulans,D.sechellia, and D.
phanet al. 1994), there are no changes from the short
mauritiana). This uncertainty is likely due to shared an-to the long intron class within the D. melanogaster
fol-generated by maximum likelihood (Huelsenbeckand
Ronquist2001). Using this method, the posterior prob-ability of the above clade is 64%. None of the above methods support the traditional phylogeny with proba-bilities ⬎15%. If each gene is considered separately (instead of using a concatenated sequence), only Adh provides consistent support for the traditional phylog-eny. ThejanAandjanBgenes each support the phylog-eny shown in Figure 1. Sodsupports a third tree that placesD.erectaandD.orenain a clade withD.melanogaster and theD.simulanscomplex. TheAmyrelsequence does not support any of the above trees with bootstrap values
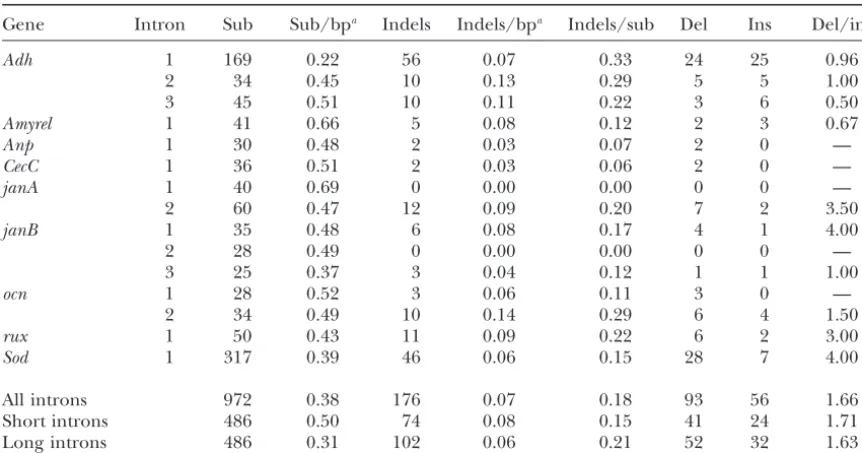
⬎50%. A recent phylogenetic study of theD.melanogaster subgroup using DNA sequences of the Adh,Adhr,Gld, andrygenes and more closely related outgroup species also strongly supports the tree shown in Figure 1 (Ko et al. 2003). On the basis of these results, the relationship depicted in Figure 1 was used to infer the numbers of base substitutions and indels occurring in the intron sequences by parsimony (seematerials and methods). For the entire intron data set, 972 nucleotide substitu-tions and 176 indels were inferred. The 13 short introns had 486 substitutions and 74 indels, while the 2 long introns had 486 substitutions and 102 indels. The differ-ence in the substitution/indel ratio between short and Figure 1.—Bootstrap 50% majority-rule consensus clado- long introns is significant (2 ⫽ 3.8; P ⫽ 0.05). This
gram of theD.melanogasterspecies subgroup. The tree is based
difference could be due to either an increased rate of on concatenated protein-encoding sequences of the Adh,
indels or a decreased rate of substitutions in long introns Amyrel, janA, janB, andSodgenes. mel,D. melanogaster; sim,
relative to short introns. The latter explanation is better D.simulans; sec,D.sechellia; mau,D.mauritiana; yak,D.yakuba;
tei,D.tessieri; ere,D.erecta; ore,D.orena.D.pseudoobscura(pse) supported by the data. Indel rates (corrected for intron was used as an outgroup to root the tree. Bootstrap values length) are very similar between the short and long (1000 replicates) are given at each node. This topology was introns, with short introns showing 0.08 indels/bp and used to infer numbers of substitutions and indels occurring
long introns showing 0.06 indels/bp. However, substitu-within introns. Branches connecting the two major clades
tion rates differ significantly between the two intron within the species subgroup were considered internal, while
those within each clade were considered terminal. classes, with 0.50 substitutions/bp in short introns and 0.31 substitutions/bp in long introns (2⫽ 39.7; P ⬍ 0.001). It should be noted that the above comparison lowing speciation (Klimanet al. 2000;Tinget al. 2000). of substitution rates is conservative, due to the fact that To be conservative, a tree in which these three species three of the short intron sequences were available from coalesce at a common, polytomic ancestral node was only seven of the eight species compared in this study. assumed for this article (Figure 1). The total number of substitutions inferred by parsimony The “two-clade” structure of the D. melanogasterspe- from an alignment of seven sequences will necessarily cies subgroup presented in Figure 1 differs slightly from be less than (or equal to) that inferred from an align-the traditionally assumed phylogeny for this group, ment of eight sequences. This result suggests greater which placesD.yakubaandD.teissieriin a clade withD. selective constraint on the DNA sequence of long in-melanogasterand theD.simulanscomplex species (Ash- trons, perhaps because they contain additional
regula-burner1989;Powell1997). It should be noted, how- tory sequences that are subject to purifying selection. ever, that this traditional phylogeny was based on non- However, this interpretation is inconsistent with the ob-molecular data or on DNA sequence from a single gene, servation that conserved intronic regions with presumed Adh. The phylogenetic relationship presented here is regulatory function experience far fewer indels than sub-based on DNA sequences from Adh, plus four other stitutions in comparisons betweenD.melanogasterandD. genes. The same topology is generated using maximum- virilis(BergmanandKreitman2001). More sequences likelihood and distance methods, which support the of long introns from across theD.melanogaster species D. yakuba, D.teissieri, D.erecta, and D. orena clade with subgroup are needed to confirm the substitution rate bootstrap values of 66 and 97%, respectively. This clade difference between short and long introns.
fied as deletions and 56 (32%) could be classified as insertions. The remaining 27 (15%) of the indels were ambiguous. This is due mainly to cases where the indels differed between the two clades within the species sub-group (Figure 1). That is, D. melanogaster,D. simulans, D. sechellia, and D. mauritiana all shared an indel not present in D. yakuba, D. teissieri, D. erecta, or D. orena. For the entire data set, there is a significant excess of deletions relative to insertions (2 ⫽ 9.2; P ⫽ 0.002), with a deletion/insertion ratio of 1.66. This pattern holds for both the short and long intron classes. For the short introns, the deletion/insertion ratio is 1.71 (2⫽4.5;P⫽0.035); for the long introns, it is 1.63 (2⫽ 4.8; P ⫽ 0.029). The above estimate is in reasonable agreement with the 1.35 deletion/insertion ratio re-ported for indel polymorphisms withinD.melanogaster introns (ComeronandKreitman2000).
The indel size distribution is also in good agreement with that observed byComeronandKreitman(2000), with 57% of the deletions and 48% of the insertions being either 1 or 2 bp in length (Figure 2). Ninety percent of the deletions and 94% of the insertions were
⬍10 bp. In general, deletions tended to be slightly longer than insertions, with average lengths of 4.59 and 3.50 bp, respectively, although this difference is not significant (Mann-Whitney test,P⫽0.70). For the short introns, deletions and insertions averaged 3.54 and 3.63 bp, respectively (Mann-Whitney test,P⫽0.28); for long introns, deletions and insertions averaged 5.42 and 3.41 bp, respectively (Mann-Whitney test,P⫽0.67).
Lengths of indels occurring along internal and termi-nal branches:As mentioned above, 15% of the indels were classified as “ambiguous,” because they could not be polarized as either insertions or deletions. It is likely, however, that many of these events represent insertions, because the total intron length is well conserved among species (Table 1) and deletions are predominant among the indels that could be classified (Table 2). In general, the ambiguous indels are longer than those that could be classified as insertions or deletions (Figure 2). The average length of the ambiguous indels is 7.22 bp, while
Figure 2.—Size distribution of insertions, deletions, and the average length of all other indels (insertions and
ambiguous indels in (A) all introns, (B) short introns, and deletions combined) is 4.18 bp. The length difference
(C) long introns. between the two classes is highly significant
(Mann-Whit-ney test, P ⫽ 0.008). This pattern holds for both the
short and long introns: 7.11 bp for ambiguousvs. 3.57 lack of an appropriate outgroup sequence. However, bp for all other indels within the short introns and 7.28 some indels are classified as ambiguous if they overlap bp for ambiguousvs. 4.65 bp for all other indels within with other indels occurring within a particular clade. the long introns. The length difference is marginally sig- Of the 27 ambiguous indels, 24 fall into the first category nificant within both the short (Mann-Whitney test,P⫽ (average length is 7.88 bp) and 3 fall into the second 0.066) and long (Mann-Whitney test,P⫽0.062) intron category (average length is 2.00 bp). When the indels
classes. are classified as either internal branch or terminal
TABLE 2
Numbers of substitutions and indels in introns
Gene Intron Sub Sub/bpa Indels Indels/bpa Indels/sub Del Ins Del/ins
Adh 1 169 0.22 56 0.07 0.33 24 25 0.96
2 34 0.45 10 0.13 0.29 5 5 1.00
3 45 0.51 10 0.11 0.22 3 6 0.50
Amyrel 1 41 0.66 5 0.08 0.12 2 3 0.67
Anp 1 30 0.48 2 0.03 0.07 2 0 —
CecC 1 36 0.51 2 0.03 0.06 2 0 —
janA 1 40 0.69 0 0.00 0.00 0 0 —
2 60 0.47 12 0.09 0.20 7 2 3.50
janB 1 35 0.48 6 0.08 0.17 4 1 4.00
2 28 0.49 0 0.00 0.00 0 0 —
3 25 0.37 3 0.04 0.12 1 1 1.00
ocn 1 28 0.52 3 0.06 0.11 3 0 —
2 34 0.49 10 0.14 0.29 6 4 1.50
rux 1 50 0.43 11 0.09 0.22 6 2 3.00
Sod 1 317 0.39 46 0.06 0.15 28 7 4.00
All introns 972 0.38 176 0.07 0.18 93 56 1.66
Short introns 486 0.50 74 0.08 0.15 41 24 1.71
Long introns 486 0.31 102 0.06 0.21 52 32 1.63
Sub, substitutions; del, deletions; ins, insertions.
aTotal base pairs (including gaps) in the sequence alignment.
significant for both the short and long introns. For short paralogy is supported by their conserved location within the aligned protein-encoding regions and by the phase introns, internal branch indels average 7.88 bp and
ter-minal branch indels average 3.53 bp (Mann-Whitney with which they interrupt codons. In all three genes the first intron is located between a first and a second codon test,P⫽0.019). For long introns, internal branch indels
average 7.88 bp and terminal branch indels average 4.60 position, while the second intron is located between a third and a first codon position. ThejanBgene has an bp (Mann-Whitney test, P⫽0.033).
Length constraints on paralogous introns:ThejanA, additional 5⬘intron that is not present in janAor ocn (Figure 3). In comparisons among species of the D. janB, andocngenes arose through two separate gene
dupli-cation events, both of which predate the divergence of melanogaster species subgroup, the two parlogous in-trons show comparable numbers of base substitutions, the D. melanogaster species subgroup (Yanicostas et al.
1995; Parschet al. 2001b). The three genes share two but differ markedly in numbers of indels. For the three genes combined, the first paralogous intron has 96 sub-paralogous introns derived from a common ancestral
gene (Figure 3). Although these introns are too diver- stitutions and 3 indels, while the second has 119 substitu-tions and 25 indels. This difference in indel/substitu-gent among genes to be aligned by DNA sequence, their
tion ratios is highly significant (2⫽11.8;P⬍ 0.001), indicating different rates of indel accumulation in the two introns. The difference is unlikely to be explained by indel-specific mutational differences, because the in-trons are only 125 bp apart within each gene and the three genes lie in tandem within a 2.5-kb region of chromosome arm 3R. Thus it appears that selective con-straints with regard to indels may differ among short introns within the same gene. In the case ofjanA,janB, andocn, the first paralogous intron appears to be under much stronger selective constraints to maintain length than the second.
Figure 3.—(A) Genomic organization of the janA, janB,
DISCUSSION andocngenes. InD.melanogaster, the three genes lie in tandem
in a 2.5-kb region of chromosome arm 3R. (B) Schematic
A comparison of 15 orthologous intron sequences from alignment of the three paralogous genes. Protein-encoding
revealed a total of 176 indels that have occurred since the minimum will be disfavored by natural selection. However, since the vast majority of deletions are of very the divergence of the species subgroup ⵑ10 million
years ago. Of the indels that could be classified as either short length (Figure 2), they may be only very slightly deleterious and can become fixed in a species through insertions or deletions, there was a significant excess of
deletions (deletion/insertion ratio is 1.66). Further- genetic drift. A general mutational bias toward small deletions and their successive fixation by drift may result more, the vast majority of the indels were ⬍10 bp in
length (90% for deletions, 94% for insertions). These in a “ratchet” effect in which intron length decreases by small steps. Because the length change is small at results are comparable to those reported byComeron
and Kreitman (2000) for indel polymorphisms oc- each step, the effect on relative fitness may be negligible. Eventually, a rare, large insertion may occur. Since this curring within introns ofD.melanogaster. Those authors
reported a deletion/insertion ratio of 1.35, with 77% insertion is longer than the previous deletions that have gone to fixation in the species, it may have a larger of the deletions and 84% of the insertions ⬍10 bp.
This suggests that the intronic indels segregating within effect on fitness, and if it restores the minimal intron length, it will be driven to fixation by positive selection. species closely reflect those that become fixed between
species. In the more distantly relatedD. pseudoobscura, The above model is supported by the observation that internal branch indels are significantly longer than a slightly different pattern of indel polymorphism has
been observed. Schaeffer (2002) surveyed polymor- terminal branch indels. The former are indels that occur on the branches separating the two major clades of the phism in theAdh and Adhr genes and found a slight
excess of insertions (deletion/insertion ratio is 0.83), D.melanogasterspecies subgroup (Figure 1) and cannot be classified as either insertions or deletions due to the with 77% of the deletions and 94% of the insertions⬍10
bp. Although this survey was based on a small number of lack of an appropriate outgroup sequence. However, the observation that intron length is well conserved between introns, it suggests that there may be mutational and/
or selective differences betweenD. melanogasterandD. the two clades (Table 1) and is generally well conserved between more distantly related species (Stephanet al. pseudoobscura that may contribute to the genome and
intron size differences between these two species (Mori- 1994;Moriyamaet al. 1998) suggests that many of these indels represent insertions. Otherwise, the observed
de-yamaet al. 1998).
A bias toward deletions has been observed in studies letion bias would lead to a persistent decrease in intron length over time. Thus, the data are consistent with the of “dead-on-arrival” non-LTR retrotransposons in the
D.melanogaster andD.virilisspecies groups (Petrovet relatively frequent occurrence and fixation of small de-letions (within each of the two major clades) and with al. 1996;Petrov andHartl1998) and in a survey of
five different transposable elements in the completeD. the less-frequent occurrence and fixation of larger inser-tions (between clades). Since the same pattern is ob-melanogastergenome (Blumenstiel et al. 2002). These
results suggest that there is a relatively high rate of served in the two large introns, a similar process may also occur in introns of this size class. In this case, the spontaneous DNA loss within these species, with
dele-tion/insertion ratios ranging fromⵑ4 to 8. The same fixation of large insertions may be selectively favored not to maintain a minimal intron length for efficient qualitative pattern is also seen for the introns examined
in this study (Table 2), although the deletion bias is not splicing, but to reduce interference between selected sites in adjacent exons (ComeronandKreitman2000). More as extreme. This is likely due to the fact that introns
are under constraints for proper splicing and that indel orthologous sequences from long introns are needed to investigate this possibility.
mutations that disrupt splicing and alter the protein
sequence encoded by a gene will quickly be eliminated The process described above should be continuous and not limited to only the internal branches of the phylogeny. from the population by purifying selection (Ptakand
Petrov2002). However, it may be difficult to detect such an effect
from the terminal branch indels, especially with a lim-There is an overall bias toward deletions relative to
insertions in introns (Table 2), but there is not a signifi- ited sample size of introns. This is because the ratchet model requires the successive fixation of multiple small cant difference between deletion and insertion lengths.
This suggests that, in general, introns should evolve deletions before a large insertion is favored by selection. The terminal branch species used in the current analysis toward shorter lengths. However, it is clear that introns
maintain relatively constant lengths over evolutionary typically differ by 5% or less in noncoding DNA se-quence. Since indel rates areⵑ15–20% of substitution time (Table 1; Stephan et al. 1994; Moriyama et al.
1998). How can this be explained? A possible explana- rates (Table 2), only one indel is likely to occur along a particular terminal branch in a short intron. Thus tion based on compensatory evolution is as follows.
As-suming that natural selection maintains a minimal there is little opportunity for the ratchet process to function over relatively short time scales. It should also length for short introns, as is indicated by the tight
distribution of short intron lengths observed in many be noted that the model does not require that all dele-tions be deleterious and all inserdele-tions beneficial. Selec-genomes (Mountet al. 1992;DeutschandLong1999;
length falls below a minimum required for efficient paralogous intron and 30 in the second. The number of splicing. As can be seen from Figure 2, large deletions indels observed within species was too low to be informa-(⬎10 bp) do become fixed within the short intron class. tive, with one indel in the first intron and two in the However, it is noteworthy that the three large deletions second.
detected within this sample occur within three of the Comparison of the lengths of the two introns among larger introns of this size class (23 bp injanAintron 2, the three paralogous genes suggests that the difference 11 bp injanBintron 1, and 11 bp inrux). in selective constraint most likely predates the diver-Indels were partitioned into three categories (inser- gence of theD.melanogaster species subgroup. Among tion, deletion, and ambiguous) using parsimony and the three genes, the first intron shows relatively little assuming the relationship shown in Figure 1. This tree length variation, ranging from 50 bp (ocninD.orena) is strongly supported by several methods of phylogenetic to 58 bp (janAin all species). The second intron shows reconstruction used in this article (see results) and much greater length differences among the paralogs, by other recent molecular analyses (Ko et al. 2003), ranging from 48 bp (ocninD.sechellia) to 106 bp (janA but differs slightly from the relationship traditionally inD.simulansandD.mauritiana). The conservation of assumed for theD.melanogasterspecies subgroup (Ash- intron length across the paralogs is surprising, given that burner1989;Powell1997). Assuming the traditional the selective constraints on protein-encoding sequences relationship, however, does not alter the major results appear to differ among the three genes. ThejanA,janB, reported here. For example, there is still a significant and ocn genes show significant differences from each bias toward deletions (deletion/insertion ratio is 1.96) other in their nonsynonymous/synonymous substitution and no significant difference between deletion and in- rates, indicating that they have likely undergone func-sertion sizes (average lengths of 4.11 and 3.58 bp, respec- tional divergence following duplication (Parsch et al. tively). Because the traditional tree allows theD.erecta/ 2001b).
D.orena clade to be used as an outgroup to all other The observation that two short introns within the same species, there are fewer ambiguous indels under this gene are under different length constraints is difficult assumption. However, the ambiguous indels do not dif- to explain. Could it be that intron order plays a role? fer significantly in size from classified indels (average Perhaps the first intron of a gene is under stronger lengths of 3.83 and 3.93 bp, respectively). Thus, assum- length constraints than are subsequent introns. This ing the traditional phylogeny also predicts that intron
possibility is not supported by the limited data that are length should consistently decrease over time, but does
available. Aside fromjanA,janB, and ocn, only one of not suggest a process by which length can be restored
the other genes surveyed,Adh, contains multiple short and maintained relatively constantly over evolutionary
introns (considering the two short introns of the adult timescales.
transcriptional unit). InAdh, the first short intron shows Comparison of indel rates in the paralogous introns
10 indels and 34 substitutions, while the second short of thejanA,janB, andocngenes indicates that the level of
intron shows 10 indels and 45 substitutions. The differ-selective constraint on intron length may vary between
ence in the indel/substitution ratio is not significant introns within the same gene. Of the two paralogous
(2 ⫽ 0.31; P ⫽ 0.58). Furthermore, the janB gene introns shared among these three genes, the first shows
contains a 5⬘intron that is not present injanAor ocn significantly fewer length changes than the second when
(Figure 3). This intron does not appear to be under compared among species of theD.melanogasterspecies
stronger length constraints than the two subsequent subgroup. Several observations indicate that this
differ-janBintrons. The length of the firstjanBintron ranges ence cannot be explained by different mutational
pro-from 58 bp inD.melanogasterto 69 bp inD.orena. This cesses in the two introns. First, the introns are only 125
intron shows an indel/substitution ratio of 0.17, which bp apart within each gene and all three genes lie in
is comparable to that of the third intron (0.12 indels/ tandem within a genomic region of 2.5 kb. It is
ex-substitution), but much greater than that of the second tremely unlikely that mutation rates could vary so
exten-intron, which is invariant in length across the entire sively over a very small portion of the genome. Second,
species subgroup. Additional interspecific comparisons the two paralogous introns show similar numbers of
of paralogous and other genes containing multiple in-nucleotide substitutions among species (Table 2),
sug-trons are needed to determine if the pattern seen in gesting equal mutation rates with respect to single base
thejanA,janB, andocngenes is common. If so, it would changes. Finally, a comparison of intraspecific
polymor-indicate that intron-length evolution cannot be accu-phism (which is expected to be less sensitive to weak
rately modeled as a general process in which all introns selection than interspecific divergence) in these introns
within a particular size or recombination class are under suggests equal mutation rates (Parschet al. 2001a; C.
the same selective constraints, but rather that unique
Meiklejohn, personal communication). A survey of
poly-constraints applying to individual introns must also be morphism in thejanA,janB, andocngenes in 36 alleles
taken into account. Further studies of substitution and ofD.simulansand in 8 alleles ofD.melanogasterrevealed
differ-conservation at splice site sequences and evolution of spliceoso-ences in selective constraint between introns of the two
mal introns. Mol. Biol. Evol.16:1528–1534.
size classes. Moriyama, E. N., D. A. PetrovandD. L. Hartl, 1998 Genome
size and intron size inDrosophila.Mol. Biol. Evol.15:770–773. I thank Tina Hambuch, David de Lorenzo, Wolfgang Stephan, Colin
Mount, S. M., C. Burks, G. Hertz, G. D. Stormo, O. Whiteet Meiklejohn, and Justin Blumenstiel for constructive comments on the al., 1992 Splicing signals inDrosophila: intron size, information manuscript. This work was supported by funds from the University content, and consensus sequences. Nucleic Acids Res.20:4255–
of Munich (LMU). 4262.
Nixon, J. E., A. Wang, H. G. Morrison, A. G. McArthur, M. L. Soginet al., 2002 A spliceosomal intron inGiardia lamblia.Proc. Natl. Acad. Sci. USA99:3701–3705.
Palmiter, R. D., E. P. Sandgren, M. R. Avarbock, D. D. Allen
LITERATURE CITED
andR. L. Brinster, 1991 Heterologous introns can enhance
Ashburner, M., 1989 Drosophila: A Laboratory Handbook. Cold Spring expression of transgenes in mice. Proc. Natl. Acad. Sci. USA88:
Harbor Laboratory Press, Cold Spring Harbor, NY. 478–482.
Bergman, C. M., and M. Kreitman, 2001 Analysis of conserved Parsch, J., C. D. MeiklejohnandD. L. Hartl, 2001a Patterns of noncoding DNA in Drosophilareveals similar constraints in in- DNA sequence variation suggest the recent action of positive tergenic and intronic sequences. Genome Res.11:1335–1345. selection in thejanus-ocnusregion ofDrosophila simulans.Genetics
Blumenstiel, J. P., D. L. HartlandE. R. Lozovsky, 2002 Patterns 159:647–657.
of insertion and deletion in contrasting chromatin domains. Mol. Parsch, J., C. D. Meiklejohn, E. Hauschteck-Jungen, P. Hunziker
Biol. Evol.19:2211–2225. andD. L. Hartl, 2001b Molecular evolution of theocnusand
Carvalho, A. B., andA. G. Clark, 1999 Intron size and natural janusgenes in theDrosophila melanogasterspecies subgroup. Mol. Biol. Evol.18:801–811.
selection. Nature401:344.
Petrov, D. A., andD. L. Hartl, 1998 High rate of DNA loss in the
Castillo-Davis, C. I., S. L. Mekhedov, D. L. Hartl, E. V. Koonin
Drosophila melanogasterandDrosophila virilisspecies groups. Mol. and F. A. Kondrashov, 2002 Selection for short introns in
Biol. Evol.15:293–302. highly expressed genes. Nat. Genet.31:415–418.
Petrov, D. A., E. R. Lozovskaya andD. L. Hartl, 1996 High
Choi, T., M. Huang, C. GormanandR. Jaenisch, 1991 A generic
intrinsic rate of DNA loss in Drosophila. Nature384:346–349. intron increases gene expression in transgenic mice. Mol. Cell.
Powell, J. R., 1997 Progress and Prospects in Evolutionary Biology: The Biol.11:3070–3074.
Drosophila Model. Oxford University Press, New York.
Comeron, J. M., andM. Kreitman, 2000 The correlation between
Ptak, S. E., andD. A. Petrov, 2002 How intron splicing affects the intron length and recombination in Drosophila: dynamic
equilib-deletion and insertion profile inDrosophila melanogaster.Genetics rium between mutational and selective forces. Genetics 156:
162:1233–1244. 1175–1190.
Schaeffer, S. W., 2002 Molecular population genetics of sequence
Deutsch, M., andM. Long, 1999 Intron-exon structures of
eukaryo-length diversity in the Adh region of Drosophila pseudoobscura. tic model organisms. Nucleic Acids Res.27:3219–3228.
Genet. Res.80:163–175.
Graur, D., andW.-H. Li, 2000 Fundamentals of Molecular Evolution,
Simpson, A. G., E. K. MacQuarrieandA. J. Roger, 2002 Eukaryotic Ed 2. Sinauer Associates, Sunderland, MA.
evolution: early origin of canonical introns. Nature419:270.
Holstege, F. C., E. G. Jennings, J. J. Wyrick, T. I. Lee, C. J.
Stephan, W., V. S. Rodriguez, B. ZhouandJ. Parsch, 1994
Molecu-Hentgartneret al., 1998 Dissecting the regulatory circuitry of
lar evolution of the metallothionein geneMtnin themelanogaster a eukaryotic genome. Cell95:717–728.
species group: results fromDrosophila ananassae.Genetics138:
Huelsenbeck, J. P., and F. Ronquist, 2001 MRBAYES: Bayesian
135–143. inference of phylogeny. Bioinformatics17:754–755.
Swofford, D. L., 2000 PAUP*: Phylogenetic Analysis Using Parsimony (*and
Kliman, R. M., P. Andolfatto, J. A. Coyne, F. Depaulis, M.
Kreit-Other Methods), Version 4. Sinauer Associates, Sunderland, MA.
man et al., 2000 The population genetics of the origin and
Thompson, J. D., T. J. Gibson, F. Plewniak, F. JeanmouginandD. G.
divergence of theDrosophila simulanscomplex species. Genetics
Higgins, 1997 The CLUSTAL_X windows interface: flexible
156:1913–1931.
strategies for multiple sequence alignment aided by quality
analy-Ko, W.-Y., R. M. DavidandH. Akashi, 2003 Molecular phylogeny sis tools. Nucleic Acids Res.25:4876–4882.
of theDrosophila melanogasterspecies subgroup. J. Mol. Evol.57: Ting, C. T., S. C. TsaurandC.-I Wu, 2000 The phylogeny of closely
562–573. related species as revealed by the genealogy of a speciation gene,
Lachaise, D., M. Harry, M. Solignac, F. Lemeunier, V. Benassiet Odysseus.Proc. Natl. Acad. Sci. USA97:5313–5316.
al., 2000 Evolutionary novelties in islands:Drosophila santomea, Yanicostas, C., P. Ferrer, A. Vincent andJ.-A. Lepesant, 1995 a newmelanogastersister species from Sao Tome. Proc. R. Soc. Separatecis-regulatory sequences control expression ofserendipity Lond. B Biol. Sci.267:1487–1495. andjanus A, two immediately adjacentDrosophilagenes. Mol.
Llopart, A., J. M. Comeron, F. G. Brunet, D. LachaiseandM. Gen. Genet.246:549–560.
Long, 2002 Intron presence-absence polymorphism inDrosoph- Yu, J., Z. Yang, M. Kibukawa, M. Paddock, D. Passeyet al., 2002 iladriven by positive Darwinian selection. Proc. Natl. Acad. Sci. Minimal introns are not “junk.” Genome Res.12:1185–1189. USA99:8121–8126.