Manuscript received September 16, 2003 Accepted for publication December 2, 2003
ABSTRACT
Nonindependent evolution of duplicated genes is called concerted evolution. In this article, we study the evolutionary process of duplicated regions that involves concerted evolution. The model incorporates mutation and gene conversion: the former increasesd, the divergence between two duplicated regions, while the latter decreasesd. It is demonstrated that the process consists of three phases. Phase I is the time untildreaches its equilibrium value,d0. In phase IIdfluctuates aroundd0, anddincreases again in
phase III. Our simulation results demonstrate that the length of concerted evolution (i.e., phase II) is highly variable, while the lengths of the other two phases are relatively constant. It is also demonstrated that the length of phase II approximately follows an exponential distribution with mean, which is a function of many parameters including gene conversion rate and the length of gene conversion tract. On the basis of these findings, we obtain the probability distribution of the level of divergence between a pair of duplicated regions as a function of time, mutation rate, and. Finally, we discuss potential problems in genomic data analysis of duplicated genes when it is based on the molecular clock but concerted evolution is common.
T
O understand the evolutionary importance of gene few, examples include several pairs of duplicated genes in Drosophila (Inomataet al.1995;King1998;Lazzaroduplication, it is critical to know when duplication
andClark 2001;BettencourtandFeder2002), hu-events occurred. This is not very difficult as long as two
man (Innan2003b), plants (Satoet al.2002;
Charles-duplicated genes have accumulated mutations
indepen-worthet al.2003), andPlasmodium falciparum(Nielsen
dently, because we can estimate the time to the
duplica-et al.2003). tion event from the level of nucleotide divergence between
The action of gene conversion can also be suggested two duplicates. The idea that nucleotide divergence has
from phylogenetic studies. For example, suppose that a linear correlation with time is known as the “molecular
duplicated genes I and II exist in species A and B. This clock.” However, the molecular clock hypothesis does
means the gene duplication event predates the specia-not always hold for duplicated genes because of the
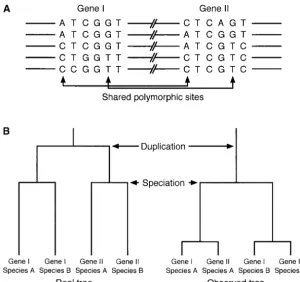
tion (Figure 1B). Without gene conversion, it is ex-phenomenon called “concerted evolution” (reviewed
pected that we observe a tree that is consistent with inOhta1980, 1983; Arnheim1983; Li1997). Under
the real tree. However, if these genes have undergone concerted evolution, the level of divergence between
concerted evolution, the observed tree might be incon-two duplicated genes is maintained very low, so that the
sistent with the real tree. That is, the two duplicated observed divergence is usually much lower than the
genes in each species are more closely related (Figure expectation when the molecular clock is assumed.
1B, right tree). On the basis of this idea, recently,Rozen
Gene conversion has been considered as the most
im-et al. (2003) reported that there are abundant gene portant mechanism for this homogenization in
dupli-conversions between several pairs of duplicated regions cated genes (i.e., a small multigene family with copy
on the Y chromosome of human and chimpanzee. number of 2), although unequal crossing over could
Thus, there are many lines of evidence for gene con-also be important for large- or middle-size multigene
version between duplicated genes. However, the effect families. Clear evidence for gene conversion is seen when
of gene conversion on the divergence between dupli-DNA polymorphism data are available for both of the
du-cated genes has not been well understood theoretically. plicated genes, because gene conversion creates “shared
The purpose of this article is to investigate the behavior polymorphic sites” (Innan2003a), at which both of the
of the divergence between duplicated genes after gene two corresponding sites in the duplicated genes are
duplication. We modify gene conversion models of polymorphic (Figure 1A). Although such data sets are
Walsh (1987). In our model, gene conversion occurs such that a certain length of DNA fragment is trans-ferred from one gene to the other, although gene
con-1Corresponding author: Human Genetics Center, School of Public
version tracts cover the entire gene in Walsh’s models.
Health, University of Texas Health Science Center, 1200 Hermann
Pressler, Houston, TX 77030. E-mail: [email protected] In our general model, we investigate the effect of the
Figure1.—(A) Shared polymorphic sites cre-ated by gene conversion. (B) Real tree (history) of gene duplication and speciation (left) and ob-served tree under concerted evolution (right).
MODEL AND SIMULATION mutation and gene conversion rates and the length of
gene conversion tract on the divergence between dupli- The evolutionary process of a pair of duplicated re-cated genes by simulations, and we attempt to formulate gions is considered. We study the behavior of d, the the probability distribution of the divergence as a func- number of nucleotide differences between duplicated tion of time. Then, we discuss potential problems in regions after their birth (
i.e., duplication). The process genomic data analysis of duplicated genes on the basis
involves mutation and gene conversion; the former in-of the molecular clock when concerted evolution is
creases the level of divergence while the latter decreases common.
it. Parameters used in this section are summarized in Table 1.
Suppose a duplication event creates two identical se-quences in a genome at timeT⫽0. In this article, we
TABLE 1
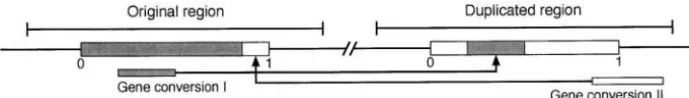
consider the evolutionary process of a pair of subregions
Summary of parameters that are within the duplicated regions as illustrated in
Figure 2. Each considered region is represented by a Nucleotide mutation rate per region
large box and assigned to an interval of (0, 1). After
m Terminator mutation rate per region
the duplication event, the regions start accumulating
L Number of nucleotides in the simulated region
c Gene conversion rate per site mutations and gene conversion works to homogenize
g Rate that gene conversion initiates per region variation. Mutation occurs independently in the two 1/q Average length of gene conversion tract in base pairs
regions at rateper region per generation, so that the 1/Q Average length of gene conversion tract in units of the
number of mutations in each region follows a Poisson length of the simulated region
S1(x) Probability that the two regions make pairing in distribution with mean. For each mutation, its position
meiosis, givenx is determined as a random variable between 0 and 1
x Number of nucleotide differences between the two (i.e., infinite-site model). regions
Gene conversion transfers a DNA fragment from one
S2(y) Probability that gene conversion successfully occurs,
to the other. Figure 2 shows two examples of gene con-giveny
y Number of nucleotide differences in a gene conversion version events. Gene conversion I transfers a DNA
seg-tract ment between positions 0.2 and 0.5 from the original
region to the duplicated region, so that the correspond-See Figure 4 for other parameters related to divergence (d)
original sequence. Note that shaded boxes represent when the two regions make pairing when the divergence is less thans1.
the sequence of the original region before gene
conver-sion and open boxes show the duplicated region. Gene The other is the probability that a gene conversion event is successfully completed. LetS2(y) be this
proba-conversion could involve regions outside of the interval
bility, which is given by a function ofy, the divergence (0, 1). Gene conversion II in Figure 2 consists of a
in a gene conversion tract. One example is that gene region from position 0.85 to 1 and a fragment outside
conversion occurs only whenyis smaller than a certain of position 1.
threshold,s2. That is,
Gene conversion is simulated assuming the length of the conversion tract follows a geometric distribution in
a finite length of DNA region. This assumption is from S2(y)⫽
冦
1 wheny⬍s2
0 whenyⱖs2. (3)
WiufandHein(2000), who studied homologous gene
conversion (in this study, we consider interlocus gene Another example might be thatS2(y) linearly decreases conversion that occurs between two duplicated regions). asyincreases:
Although the mechanism of interlocus gene conversion
is not well understood, it might be reasonable to assume S
2(y)⫽
冦
1⫺y/s3 wheny⬍ s3
0 whenyⱖ s3. (4)
that it may be similar to that of homologous gene
conver-sion. FollowingWiufandHein(2000), simulating gene Note thatS
1(x) depends on the divergence in the whole
conversion events involves two parameters,g and q. g region,x, whileS
2(y) is given for each gene conversion
represents the rate that a gene conversion event initiates tract and
yrepresents the level of divergence in a tract. andqis the geometric distribution parameter to deter- Similar models are used in Walsh (1987). Note that mine the length of the gene conversion tract. The geo- Walsh(1987) defined only one probability because all metric distribution for the length of the converted tract gene conversion tracts cover the whole region in his in base pairs, z, is given by q(1 ⫺ q)z⫺1. Suppose that
model, where the two probabilities mean the same each of the simulated regions isLbp long. If we assume thing. SeeWalsh(1987) andLi(1997) for the molecu-L is very large and q is very small (i.e., infinite-sites lar genetic background behind this sequence-depen-model), the distribution of the length of a tract (see dent gene conversion model.
Figure 2) is given by an exponential distribution with In addition to nucleotide mutations,Walsh(1987) also parameterQ⫽qL, and the average length of a conver- considered mutations that block gene conversion. Such sion tract is 1/Q (the unit of length is L bp). In this mutations are called “terminator mutations.” Large indels model, the rate that a particular site of one region is and transposable elements might belong to terminator
transferred to the other is given by mutations. We assume such mutations occur at ratemper
region per generation. The position of mutation is given c⫽ g
Q, (1) as a random variable between (0, 1). Gene conversion is
assumed to be completely suppressed if a conversion tract includes the position of the terminator mutation. which corresponds to the gene conversion rate per site
Note that the numbers of mutations and gene conver-per generation defined in Innan (2002, 2003a). The
sion events per generation follow Poisson distributions. algorithm to simulate gene conversion tracts follows
When the expected numbers of these events are very
WiufandHein(2000).
small, we can obtain essentially the same simulation In this study, we consider another two probabilities.
results by an approximate method, in which the Poisson One is the probability that determines whether the two
processes are simulated everykgeneration with the pa-regions make pairing in meiosis, which is considered to
rameters multiplied byk. be required for gene conversion to occur. This probability,
S1(x), should be a function ofx, the divergence between
the two regions. For example,S1(x) is defined as RESULTS
The behavior of the divergence between duplicated S1(x)⫽
冦
1 whenx⬍s1
Figure3.—Traces ofdover time under concerted evolution. We as-sume a gene conversion rate⫽{0, 1, 3, 5, 10}⫻10⫺8from top to bottom. Four independent traces are shown for each gene conversion rate.
Throughout this study ⫽10⫺6/region is assumed: the sion rate (Innan 2002, 2003a). In phase II, d keeps
fluctuating around d0. Then, the process enters phase
simulated region corresponds to a 1-kb region if we
assume that a standard mutation rate⫽10⫺9/site/gen- III, in which the two regions start accumulating
muta-tions independently. Note that there are not clear bor-eration. Also, k⫽ 105 is assumed. We assume 1/Q ⫽
0.1, s1 ⫽ 100 in (2), ands2 ⫽100z⬘in (3), wherez⬘ is ders between the three phases. The definition of the
three phases is intuitively understood such that the di-the gene conversion tract length in di-the interval (0, 1).
The results are in Figure 3, which shows four indepen- vergence approximately follows a molecular clock if phase II is removed. The length of phase II approxi-dent realizations of the trace of d for c ⫽ {0, 1, 3, 5,
10}⫻10⫺8from top to bottom. Without gene conversion mately represents the length of concerted evolution.
To study the length of concerted evolution, we con-(top),dincreases linearly with increasing time (i.e.,
mo-lecular clock). Whenc⫽10⫺8, a little delay is observed siderT
d1, the waiting time for the first hit ofd⫽d1,d1Ⰷ
d0.Td1is divided into three parts,t1,t2, andt3, according
in the increasing function, and the delay gets bigger as
cincreases. Whenc⫽5⫻10⫺8,dfluctuates around an to the phases (see Figure 4). We expect thatT
d1is directly related to the length of concerted evolution,t2, because
equilibrium value for a quite long time, and then d
starts increasing linearly. The bottom indicates thatc⫽ t2 ⬇Td1⫺ d1/(2). The effect of gene conversion rate
on Td1 is investigated by simulation. We assume d1 ⫽
10⫺7is so high that the fluctuation time ofdis extremely
long (but the fluctuation does not continue forever). 200. Table 2 summarizes the results of simulations for c⫽ {1, 2, 3, . . . , 10}⫻10⫺8when 1/Q⫽∞,s
1⫽100,
Thus, the evolutionary process of duplicated regions
involves a long fluctuation time of d unless the gene andS2is given by (3) withs2⫽100. It is demonstrated
that ascincreases, the average ofTd1increases exponen-conversion rate is small. Figure 4 illustrates a typical
behavior ofd, which consists of three phases: phase I is tially. The variance ofTd1is huge, indicating thatTd1is
highly variable. Similar results are obtained for the case the time untildreaches its equilibrium value,d0, which
depends mainly on the mutation rate and gene conver- of 1/Q⫽0.1 (also see Figure 5A).
2 2.06⫻10 1.44⫻10 1.13⫻10
3 3.53⫻108 7.03⫻1016 6.42⫻1016
4 6.73⫻108 3.51⫻1017 3.28⫻1017
5 1.35⫻109 1.57⫻1018 1.56⫻1018
6 2.92⫻109 8.34⫻1018 7.95⫻1018
7 6.23⫻109 3.57⫻1019 3.76⫻1019
8 1.38⫻1010 1.88⫻1020 1.88⫻1020
9 3.11⫻1010 9.78⫻1020 9.60⫻1020
10 6.97⫻1010 4.89⫻1021 4.84⫻1021
aWhenc⫽0, the expectation and variance ofT
d1are given
byd1/(2) andd1/(42), respectively.
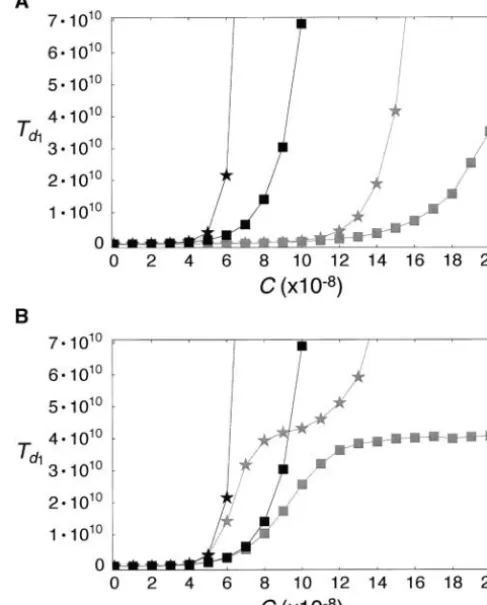
We also investigate the relationship between c and Td1 under various gene conversion models (Figure 5). First we assume 1/Q ⫽ 0.1, s1 ⫽ 100 in (2) and S2 is
given by (3) withs2⫽100z⬘. The result is presented by
solid stars in Figure 5A.Td1 is larger than that for 1/ Q⫽∞(solid squares), indicating that the gene conver-sion tract length has a significant effect on the length of concerted evolution (see below). Next we consider
Figure5.—The relationship betweencandTd1when 1/Q⫽ Td1for 1/Q⫽∞and 1/Q⫽0.1 in a model wheres1⫽ ∞(squares) and 0.1 (stars). (A) Solid squares and stars
repre-100 in (2) andS2 is given by (4) with s3⫽ 100z⬘. It is sent results of simulations in whichS
1andS2are given by (2)
shown that the increase of Td1 against c is slower in and (3) withs1⫽s2⫽100. Shaded squares and stars represent the case whereS1andS2are given by (2) and (4) withs1⫽
comparison with the previous model. This is expected
s3⫽ 100. (B) Results with terminator mutations are shown
because the effective gene conversion rate given by (4)
(shaded squares and stars).m⫽1.25⫻10⫺11is given. Solid is smaller than that given by (3) if c is the same and
squares and stars indicate the same as those in A. s2 ⫽s3.
In Figure 5B,Td1in a model with terminator mutation is shown. We assumem⫽1.25⫻10⫺11,s
1⫽100 in (2)
to occur (see Figure 4). That is, onced hitsdt, there is
andS2is given by (3) withs2⫽ 100z⬘. When 1/Q⫽∞,
no chance that the system returns to phase II. It is ascincreases,Td1saturates around 1/(2m)⫽ 4⫻ 1010
obvious that the larger the variance of d, the more because phase II is terminated with probability 2m. The
chance thatd hitsdt, creating the negative correlation
situation is complicated when 1/Q⫽ 0.1.Td1saturates
betweenTd1 and 1/Q. Note that 1/Q has no effect on
somehow around 1/(2m) when c ⬇ 8–9 ⫻ 10⫺8, but
the expectation ofdin phase II (Innan2002, 2003a). again starts increasing for c ⱖ 10 ⫻ 10⫺8. This is
be-Thus, the time of phase II, t2, might be considered
cause after a terminator mutation gene conversion is
as a waiting time for an event whendfirst hitsdt. Let
suppressed in a short region around the mutation when
be the expectation of this waiting time. It is expected 1/Q is small. That is, as c increases, in most regions
thatt2 approximately follows an exponential
distribu-phase II continues for a quite long time even after a
tion with meanwhen is large, and the variance of terminator mutation.
Td1 is approximately given by Figure 6A shows the effect of the length of gene
con-version tract onTd1whenc⫽3⫻10⫺8,m⫽0, ands1⫽
V(Td1)⫽V(t1⫹ t3)⫹ V(t2)⫽
d1
42⫹
2, (5)
100. As 1/Qdecreases, the average ofTd1increases dra-matically. This observation could be understood as
fol-because t1,t2, and t3 are almost independent. Table 2
lows. As shown in Figure 6B, 1/Qhas a positive
correla-demonstrates that Equation 5 holds quite well whencⱖ tion with the variance ofdin phase II. The variance of
3⫻10⫺8. This supports the hypothesis thatt
2
approxi-d is a very important factor to determine the time of
phase II because phase II is terminated whendhappens mately follows an exponential distribution.
Our simulation results have indicated that the rela-to exceed a threshold value ofd,dt.dtis defined as the
Pr(te|T)⫽
冦
exp[⫺(T⫺ t1)/] whente⫽ t1
1
exp[⫺(T⫺te)/] whent1 ⬍teⱕT.
(9)
Note thatt1is unknown here, but the numerical
calcula-tion of (9) can be done assumingt1⬇0 becauseTⰇt1.
Then, the pdf ofd is given by convolution:
Pr(d|T)⫽
冮
Pr(te|T)(2te)dexp(⫺2te)
d! dte. (10)
This equation works best fordⰇdt. The probability that
d⬍dtis almost identical with that in Equation 8.
We can also obtain the pdf ofTd1. That is,
Pr(Td1)⬇2Pr(d1⫺ 1 |Td1⫺1), (11)
whenis small.
DISCUSSION
The evolutionary process of a pair of duplicated re-gions is studied by simulations. The model incorporates mutation and gene conversion: the former increasesd, the divergence between two duplicated regions, while the latter decreasesd. It is demonstrated that the process consists of three phases. Phase I is the time until d reaches its equilibrium value,d0. In phase IIdfluctuates
around d0, and d increases again in phase III. These
Figure6.—(A) The effect of the length of the conversion
three phases are defined such thatdhas a positive linear tract, 1/Q, onTd1. (B) The effect of the length of the
conver-correlation with time if phase II is deleted. Phase II sion tract on the variance ofdin phase II.
approximately corresponds to the time under concerted evolution. The lengths of the three phases, t1, t2, and
t3, could be almost independent of each other.t1and
many parameters (c, 1/Q,s1,s2, andm) affect t2.
How-t3are relatively constant, whilet2is highly variable. Our
ever, the probability distribution function (pdf ) of d
simulations demonstrated thatt2approximately follows
might involve only three parameters, , , and T,
be-an exponential distribution becauset2is a waiting time
causesummarizes all parameters that affectt2. Here,
for a random event that initiates phase III. The rate we attempt to obtain the pdf ofdas a function of,,
that such events occur determines, the expectation of andT, assuming the pdf of t2 is given by
t2, which depends on the mutation rate (andm), gene
conversion rate (c together with S1 and S2), and the
1
exp(⫺t2/) . (6)
average length of gene conversion tract (1/Q). It seems extremely difficult to obtain an equation foras a func-We define teas the effective time that directly contrib- tion of these parameters, but we were able to obtain
utes to the linear accumulation of mutations, which is the pdf of
d given,, andT.
given by In this study, we considered mutations as only a
mech-anism to terminate phase II. However, strong selection te⫽t1⫹ t3⫽T⫺t2. (7)
could also be a factor to stop concerted evolution.Innan
We assumeTⰇ t1. If concerted evolution is still going (2003b) demonstrated that the gene conversion rate is
on atT(i.e., phase II),te⫽t1anddis somewhere around effectively reduced around the target site of selection,
d0. The probability that the system is in phase II atTis because selection works against gene conversion to keep
given by the variation between two regions. Evidence for such
selection is seen in exon 7 in the human RH genes (Innan2003b).
Pr(phase II|T)⫽
冮
∞T⫺t1
1
exp(⫺t/)dt
Recent genomic sequence data provide great opportu-nities to study the evolution of gene duplication (e.g.,
⫽ exp[⫺(T⫺t1)/] , (8)
LynchandConery2000;FriedmanandHughes2001;
problems in genomic data analysis of duplicated genes on the basis of the molecular clock, if concerted evolution is common. As an example, we use the data ofLynchand
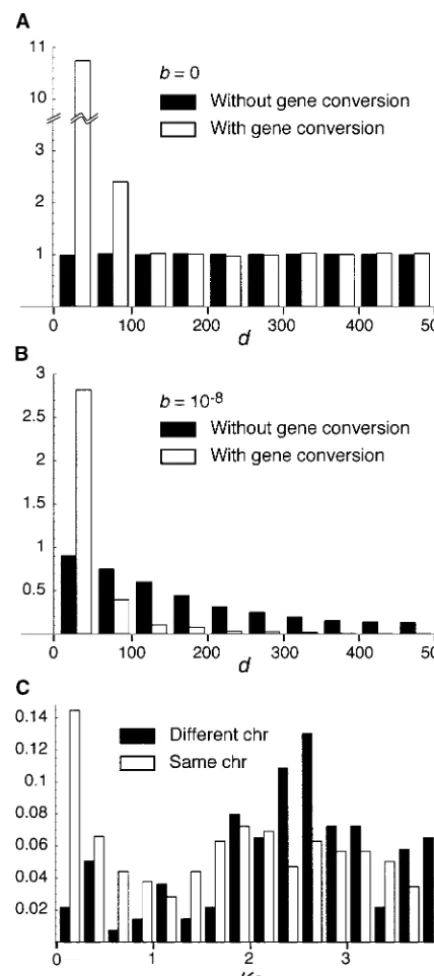
Conery(2000), who estimated the birth (duplication) and death (deletion or pseudogenization) rates on the basis of the molecular clock. Their estimation is based on the idea that the frequency distribution (spectrum) ofd is approximately given by an exponential distribu-tion when the birth and death rates (a and b, respec-tively) are constant over time. The solid bars in Figure 7B show this relationship whenb⫽ 10⫺8. It is obvious
that the spectrum is expected to be flat whenb⫽0 (solid bars in Figure 7A). The number of observed duplicated genes with very lowdin a genome reflects the duplica-tion rate,a.
Figure 7A shows the expected frequency distribution ofdwhenb⫽0 andc⫽3⫻10⫺8(open bars), indicating
that gene conversion createsⵑ10 times more duplicated genes with low divergence (d⬍50) than the case with-out gene conversion (solid bars) does becausedspends a long time aroundd0. The two distributions are
identi-cal ford⬎100 because gene conversion does not occur (i.e.,dt⫽100). It is indicated that gene conversion alone
can also create an exponential-like distribution ofdas well as the constant death process. The open bars in Figure 7B show that the frequency distribution under the joint effect of the death process and gene conversion is also similar to an exponential distribution. The peak of genes with low divergence is approximately three times higher than that of the case of the death process only, and the distribution decreases very quickly as d increases.
Thus, if concerted evolution of duplicated genes via gene conversion is common, the effect of gene
conver-sion on the frequency distribution of d cannot be ig- Figure7.—Expected and observed frequency distributions ofd. Expected distributions are obtained by simulations. 1/ nored. In such a case, it is indicated that the result of
Q⫽∞ands1⫽100 are assumed andS2is given by (3) with
duplicated gene analysis based on the molecular clock
s2⫽100z⬘.ais assumed to be constant, but not specified. The
should be biased. For example, suppose a and b are distributions are shown in adjusted frequencies relative to the estimated by fitting an exponential distribution. An esti- flat distribution of the caseb⫽c⫽0. (A) Solid bars represent mate ofadepends on the number of duplicated genes the distribution ofdforb⫽c⫽0, and open bars represent that forb⫽0 andc⫽3⫻10⫺8. (B) Solid bars are forb⫽
with very lowd: the more genes with lowd, the higher
10⫺8 and c⫽ 0, and open bars for b⫽ 10⫺8and c ⫽ 3 ⫻ the rate of gene duplication. If the number of
dupli-10⫺8. (C) Observed distributions ofKsfor theD. melanogaster
cated genes of low divergence is increased by gene con- genome. Data are fromLynchandConery(2000). version,ashould be overestimated. This excess of genes
of low divergence might also contribute to an
overesti-mation ofb because an estimate ofb depends on how sophila melanogastergenome. The data are fromLynch
andConery(2000). We chose this species as an exam-quickly the distribution decreases asd increases.
Figure 7C shows the observed frequency distributions ple because DNA polymorphism data for several pairs of duplicated genes exhibit clear evidence for frequent of the level of divergence measured byKs, the expected
Friedman, R., andA. L. Hughes, 2001 Pattern and timing of gene
classified into two groups, pairs on the same chromosome
duplication in animal genomes. Genome Res.11:1842–1847.
and those on different chromosomes, because gene con- Gu, X., Y. WangandJ. Gu, 2002 Age distribution of human gene
families shows significant roles of both large- and small-scale
version is expected to occur more frequently between
duplications in vertebrate evolution. Nat. Genet.31:205–209.
pairs of genes on the same chromosome. We find a
Innan, H., 2002 A method for estimating the mutation, gene
conver-clear difference in the distributions: an excess of pairs sion and recombination parameters in small multigene families.
Genetics161:865–872.
of low divergence is observed only in the former class.
Innan, H., 2003a The coalescent and infinite-site model of a small
If this difference is due to the difference in the gene
con-multigene family. Genetics163:803–810.
version rate, it might be suggested that the high peak of Innan, H., 2003b A two-locus gene conversion model with selection
and its application to the humanRHCEandRHDgenes. Proc.
low-divergence genes on the same chromosome might be
Natl. Acad. Sci. USA100:8793–8798.
a signature of frequent gene conversion rather than a
Inomata, N., H. Shibata, E. OkuyamaandT. Yamazaki, 1995
Evo-rapid birth-and-death process.LynchandConery(2000) lutionary relationships and sequence variation of␣-amylase vari-have also argued this possibility from the positive corre- ants encoded by duplicated genes in theAmylocus ofDrosophila
melanogaster.Genetics141:237–244.
lation betweenKsand physical distance between genes.
King, L. M., 1998 The role of gene conversion in determining
se-Our results suggest that analyzing duplicated genes quence variation and divergence in the Est 5 gene family in on the basis of the molecular clock might be misleading Drosophila pseudoobscura.Genetics148:305–315.
Lazzaro, B. P., andA. G. Clark, 2001 Evidence for recent
paralo-if concerted evolution is common. Therefore, before
gous gene conversion and exceptional allelic divergence in the
analyzing data, it is very important to test the molecular Attacingenes ofDrosophila melanogaster.Genetics159:659–671. clock hypothesis, which might require genomic infor- Li, W.-H., 1997 Molecular Evolution. Sinauer Associates, Sunderland,
MA.
mation from other related species. Unfortunately, such
Lynch, M., andJ. S. Conery, 2000 The evolutionary fate and
conse-data are few at this moment, but will be available in
quences of duplicate genes. Science290:1151–1155.
time. McLysaght, A., K. HokampandK. H. Wolfe, 2002 Extensive
geno-mic duplication during early chordate evolution. Nat. Genet.31:
J. S. Conery and M. Lynch kindly provided us information on their
200–204. data in Lynch andConery (2000). H.I. is supported by a grant
Nielsen, K. M., J. Kasper, M. Choi, T. Bedford, K. Kristianseet from the University of Texas and K.M.T. is supported by a grant to al., 2003 Gene conversion as a source of nucleotide diversity in R. Chakraborty. Plasmodium falciparum.Mol. Biol. Evol.20:726–734.
Ohta, T., 1980 Evolution and Variation of Multigene Families. Springer-Verlag, Berlin/New York.
Ohta, T., 1983 On the evolution of multigene families. Theor. Popul. LITERATURE CITED
Biol.23:216–240.
Rozen, S., H. Skaletsky, J. D. Marszalek, P. J. Minx, H. S. Cordum Arnheim, N., 1983 Concerted evolution of multigene families, pp.
et al., 2003 Abundant gene conversion between arms of palin-38–61 inEvolution of Genes and Proteins, edited by M.Neiand
R. K.Koehn. Sinauer Associates, Sunderland, MA. dromes in human and ape chromosomes. Nature423:873–876.
Bailey, J. A., Z. Gu, R. A. Clark, K. Reinert, R. V. Samonteet al., Sato, K., T. Nishio, R. Kimura, M. Kusaba, T. Suzukiet al., 2002 2002 Recent segmental duplications in the human genome. Coevolution of theS locus genesSRK, SLGandSP11/SCR in Science297:1003–1007. Brassica oleraceaandB. rapa.Genetics162:931–940.
Bettencourt, B. R., andM. E. Feder, 2002 Rapid concerted evolu- Walsh, J. B., 1987 Sequence-dependent gene conversion: Can dupli-tion via gene conversion at the Drosophilahsp70genes. J. Mol. cated genes diverge fast enough to escape conversion? Genetics
Evol.54:569–586. 117:543–557.
Charlesworth, D., B. K. Mable, M. H. Schierup, C. Bartolome´ Wiuf, C., andJ. Hein, 2000 The coalescent with gene conversion. andP. Awadalla, 2003 Diversity and linkage of genes in the Genetics155:451–462.
self-incompatibility gene family inArabidopsis lyrata.Genetics164: