50 | P a g e
Study of Variation in Physical and Optical Properties of
Aerosol over an urban area Varanasi
Himanshu Kumar Mishra
1, A.K. Shukla
2,
Mr. Amarendra Singh
3, Mr. Sunil Kumar
41
Department of Civil Engineering, Institute of Engineering and Technology, Lucknow,India
ABSTRACT
Earth’s energy budget is largely influenced by attenuation of solar radiation when it passes through earth’s
atmosphere and depends on how much extent atmosphere is clear due to presence of aerosol which causes scattering
and absorption of incoming radiation. In this paper, annual, seasonal and monthly variation in physical and optical
properties of aerosol like Aerosol Optical Depth, Angstrom Exponent and UV Aerosol Index, is analysedby using
data derived from the Ozone Monitoring Instrument (OMI) aboard NASA’s satellite. Here we have focused over an
urban area of Varanasi (25.3176°N, 82.9739°E), Uttar Pradesh, India which is a major holy place and has
importance for tourism purpose. The analysis is done on long term basis for the 2009 to 2018.Annual variation of
AOD shows its maximum value of 0.924 in 2016 and minimum of 0.7 in 2010, Angstrom exponent have maximum
value of 1.55 in 2013 and minimum of 1.2 in 2017 and UV Index have maximum of 1.45 in 2018 and minimum of
1.15 in 2013..Seasonal variation of AOD and angstrom exponent shows its maximum value in winter of 0.97 and
1.64 respectively due to hazy conditions and minimum value in pre-monsoon of 0.69 and 1.04 respectively. UV
Index shows its maximum value of 1.71 in pre monsoon due to absence of non-absorbing medium like clouds and
minimum value of 0.76 in monsoon. Monthly variation of AOD and Angstrom exponent shows its maximum value
in January of 1.07 and 1.7 respectively and minimum value of 0.5 in March and 0.86 in April. UV Index shows its
maximum value of 2.19 in May and minimum of 0.77 in August. During summer, wind transport causes the
increasing pattern of AOD and angstrom exponent.
51 | P a g e
1.
INTRODUCTION
All particles in state of liquid and solid suspended in air comes under category of aerosol. Aerosol particles not only
affect health of living organisms but it also affect the earh’s budget by trapping solar radiation due to effect of
scattering and absorption.
Since attenuation of radiation depends on denseness, fineness, and size of particles present in the atmosphere in the
form of aerosol, hence physical and optical properties like Aerosol optical depth, angstrom exponent and UV aerosol
index are having a significance in analysis of aerosol variation.
Aerosol optical depth is the degree which shows the extinction of solar radiation due to effect of absorption and
scattering. AOD is a dimensionless number which shows column integrated aerosol presence. The angstrom
exponent presents the fineness of aerosol particles in the atmosphere. More the value angstrom exponent more finer
will be particles present in the atmosphere UV index shows the presence of absorptive or non-absorptive type of
aerosol. Positive or more values of UV index shows absorptive nature and negative or less values shows non
absorptive nature of aerosol.
In this study, atmospheric aerosol optical properties are analysed for the city Varanasi which is located at an
elevation of 80.71 metres in the eastern part of the state of Uttar Pradesh, India.
2.
METHODOLOGY
Daily data of aerosol parameters (like aerosol optical depth, angstrom exponent and UV aerosol index) are taken in
the form of 1°×1° grid by OMI (Ozone measuring instrument) over Varanasi (25.3176°N,82.9739°E). All
parameters have time series area averaged aerosol data.OMR is NADIR viewing spectrometer which measures solar
reflected and backscattered light in UV visible range.
3.
DATA COLLECTION
The mean observed data obtained from Ozone measuring instrument over an urban area Varanasi is analysed in the
form of monthly mean data and its standard deviation. All collected area averaged data is shown with the help of
52 | P a g e
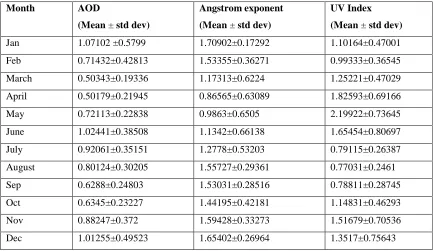
Table 1 provides the required data which is used to examine aerosol properties on the monthly basis which is further
used for graphical analysis.
Table 1.Monthly mean data using ozone measuring instrumentof all parameters
Month AOD
(Mean ± std dev)
Angstrom exponent
(Mean ± std dev)
UV Index
(Mean ± std dev)
Jan 1.07102 ±0.5799 1.70902±0.17292 1.10164±0.47001
Feb 0.71432±0.42813 1.53355±0.36271 0.99333±0.36545
March 0.50343±0.19336 1.17313±0.6224 1.25221±0.47029
April 0.50179±0.21945 0.86565±0.63089 1.82593±0.69166
May 0.72113±0.22838 0.9863±0.6505 2.19922±0.73645
June 1.02441±0.38508 1.1342±0.66138 1.65454±0.80697
July 0.92061±0.35151 1.2778±0.53203 0.79115±0.26387
August 0.80124±0.30205 1.55727±0.29361 0.77031±0.2461
Sep 0.6288±0.24803 1.53031±0.28516 0.78811±0.28745
Oct 0.6345±0.23227 1.44195±0.42181 1.14831±0.46293
Nov 0.88247±0.372 1.59428±0.33273 1.51679±0.70536
Dec 1.01255±0.49523 1.65402±0.26964 1.3517±0.75643
4.
RESULTS AND DISCUSSION
4.1
Variation of aerosol parameters
In the whole period of analysis (From 2009 to 2018) different parameters including AOD, angstrom exponent
and UV index are analysed.
4.1.1
Annual variation of AOD and angstrom exponent
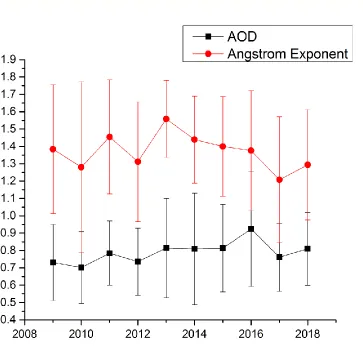
The pattern of variation of AOD and angstrom exponent is similar from 2009 to 2013 and from 2016 to
2018. Angstrom exponent shows a decreasing pattern from 2013 to 2017 and AOD shows almost
constant pattern from 2013 to 2015. This graph shows the clear dependency of AOD on angstrom
exponent. Approximately similar variation of AOD in the year of 2011,2012 and 2013 shows due to
53 | P a g e
Fig 1. Combined annual variation of AOD and α412-470
4.1.2
Monthly variation of AOD and angstrom exponent
Monthly variation of AOD and angstrom exponent similar pattern from January to April, April to June and
August to December. AOD shows a decreasing pattern from June to August due to decrease in temperature in
the study area which causes less convection of aerosols present near the earth. Angstrom exponent shows an
increasing pattern from June to Augustdue to increase in finer aerosol particles in the atmosphere.
Increasing pattern in AOD and angstrom exponent from October to December caused due to hazy and dense
54 | P a g e
Fig 2. Combined monthly variation of AOD and α412-470
4.1.3
Seasonal variation of AOD and angstrom exponent
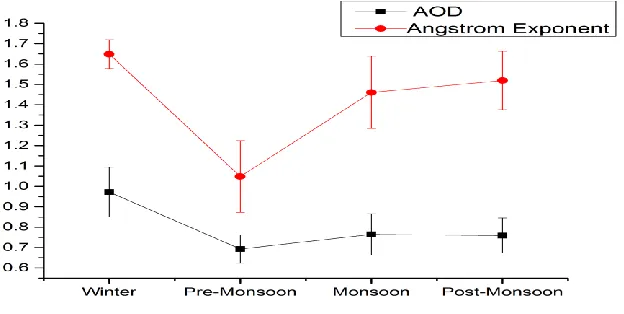
Seasonal variation of AOD and angstrom exponent shows similar trend in all seasons. There is a
decreasing pattern from Winter to Pre- Monsoon season and it is showing increasing pattern from Pre-
Monsoon to Post –Monsoon season. Both parameters are showing maximum mean value in winter
season due to hazy conditions.
55 | P a g e
4.1.4 Variation of UV aerosol index
Annual variation shows its maximum value in 2018 and minimum value in 2013. It shows peak value in the month
of May and minimum value in August. Monthly variation shows almost constant pattern from July to September.
Seasonal variation shows its peak in Pre-Monsoon season and lowest value in Monsoon season.Peak of UV index is
caused due to presence of absorbing aerosol.
5.
CONCLUSIONS
Aerosol optical properties in the city of Varanasi which is located at an elevation of 80.71 metres including AOD,
angstrom exponent and UV aerosol index are studied using data obtained by OMI.
The annual variation of AOD is between 0.70 and 0.92 for wavelength 550 nm. The maximum mean and standard
deviation of AOD is 0.92436± 0.33122 in 2016 whereas angstrom exponent have its maximum value of 1.55815±
0.22194 in 2013 and UV index have its maximum mean value of 1.45987± 0.60298 in 2018.
In the analysis of monthly variation AOD have its maximum value of 1.07102± 0.5799 in January. Angstrom
exponent varies from 0.86565± 0.63089 to 1.70902± 0.17292 having maximum value in January and minimum in
April. UV Index have its maximum value of 2.19922± 0.73645 in May and minimum value of 0.77031± 0.2461 in
August.
Seasonal variation shows that AOD have its maximum value of 0.9724± 0.12146 in winter due to very less
dispersion because of hazy atmosphere. Angstrom exponent is having maximum value of 1.64865± 0.07057 in
winter. An exponential dependence of α on AOD in winter and Pre-Monsoon indicates that the dust aerosols are
major contributors of atmospheric turbidity in Varanasi.
In seasonal variation analysis, UV aerosol index have its maximum value of 1.71764± 0.2173 in Pre-Monsoon
season due to presence of absorbing aerosol and it has minimum value of 0.76351± 0.05879 in Monsoon season due
56 | P a g e
References
[1]. Andreae, M.O. and Rosenfeld, D., 2008. Aerosol–cloud–precipitation interactions. Part 1. The nature and
sources of cloud-active aerosols. Earth-Science Reviews, 89(1-2), pp.13-41
[2]. Gopal, K.R., Reddy, K.R.O., Balakrishnaiah, G., Arafath, S.M., Reddy, N.S.K., Rao, T.C., Reddy, T.L. and
Reddy, R.R., 2016. Regional trends of aerosol optical depth and their impact on cloud properties over Southern
India using MODIS data. Journal of Atmospheric and Solar-Terrestrial Physics, 146, pp.38-48.
[3]. Janjai, S., Nunez, M., Masiri, I., Wattan, R., Buntoung, S., Jantarach, T. and Promsen, W., 2012. Aerosol optical
properties at four sites in Thailand. Atmospheric and Climate Sciences, 2(04), p.441.
[4]. Jose, S., Gharai, B., Niranjan, K. and Rao, P.V.N., 2016. Investigation on seasonal variations of aerosol
properties and its influence on radiative effect over an urban location in central India. Atmospheric Environment,
133, pp.41-48.
[5]. Khoshsima, M., Bidokhti, A.A. and Ahmadi-Givi, F., 2014. Variations of aerosol optical depth and Angstrom
parameters at a suburban location in Iran during 2009–2010. Journal of earth system science, 123(1), pp.187-199.
[6]. Prasad, A.K., Singh, R.P., Singh, A. and Kafatos, M., 2005, May. Seasonal variability of aerosol optical depth
over Indian subcontinent. In Analysis of Multi-Temporal Remote Sensing Images, 2005 International Workshop on
the (pp. 35-38). IEEE.
[7]. Qin, K., Wang, L., Wu, L., Xu, J., Rao, L., Letu, H., Shi, T. and Wang, R., 2017. A campaign for investigating
aerosol optical properties during winter hazes over Shijiazhuang, China. Atmospheric Research, 198, pp.113-122.
[8]. Ramachandran, S., Kedia, S. and Srivastava, R., 2012. Aerosol optical depth trends over different regions of
India. Atmospheric Environment, 49, pp.338-347.
[9]. Soni, K., Singh, S., Bano, T., Tanwar, R.S. and Nath, S., 2011. Wavelength dependence of the aerosol Angstrom