1071-412X/97/$04.0010
Copyright © 1997, American Society for Microbiology
Comparison of Two Different Methods for Inactivation of
Viruses in Serum
T. PREUSS,1† S. KAMSTRUP,1* N. C. KYVSGAARD,2P. NANSEN,2A. MILLER,3ANDJ. C. LEI1
The Danish Veterinary Institute for Virus Research, Lindholm, DK-4771 Kalvehave,1Danish Centre for Experimental
Parasitology, The Royal Veterinary and Agricultural University, DK-1870 Frederiksberg C,2and Risø High Dose
Reference Laboratory, Risø National Laboratory, DK-4000 Roskilde,3Denmark
Received 26 December 1996/Returned for modification 1 April 1997/Accepted 1 May 1997
In order to compare protocols for inactivation of viruses potentially present in biological specimens, three different model viruses were treated in bovine serum by two different inactivation methods: samples were subjected either to chemical inactivation with ethylenimine (EI) at concentrations of 5 and 10 mM at 37°C for periods up to 72 h or to electron-beam irradiation in frozen and liquid form with doses varying between 11 and 46 kGy. The chemical inactivation resulted in nonlinear tailing curves in a semilogarithmic plot of virus titer versus inactivation time showing non-first-order kinetics with respect to virus titer. The time for inactivation
of 7 log10units of porcine parvovirus (PPV) was about 24 h for both EI concentrations, whereas 5 log10units
of bovine viral diarrhea virus (BVDV) was inactivated in 2 h for both EI concentrations and 6 log10units of
porcine enterovirus (PEV) was inactivated within 3 h. The inactivation with electron-beam irradiation resulted in almost linear curves in a semilogarithmic plot of virus titer versus irradiation dose, reflecting a first-order inactivation. The rate of inactivation was almost twice as fast in the liquid samples compared to the rate in
frozen ones, giving values of the doses needed to reduce virus infectivity 1 log10unit for inactivation of PPV of
11.8 and 7.7 kGy for frozen and liquid samples, respectively, whereas the corresponding values for BVDV were 4.9 and 2.5 kGy, respectively, and those for PEV were 6.4 and 4.4 kGy, respectively. The nonlinear inactivation with EI makes it impossible to extrapolate the curves beyond the virus detection limit and thereby predict the necessary time for complete inactivation, i.e., to a level beyond the detection limit, of virus in a given sample. The first-order inactivation obtained with electron-beam irradiation makes such a prediction possible and justifiable. The two methods are discussed with respect to their different kinetics and applicability under different circumstances and criteria for inactivation, and considerations for choice of method are discussed.
The potential risk of introducing viruses not present in Den-mark via biological materials, most notably serum, received from various countries, including developing countries in the tropics, constitutes an obstacle to scientific collaboration be-tween scientists in these countries and in Denmark. In veteri-nary medicine this problem is especially relevant for countries with high zoosanitary status, where strict import control is required to avoid accidental introduction of unwanted patho-gens. Therefore, a standardized method for the inactivation of infectious agents, in particular viruses, is a prerequisite for joint research projects in which serum is exchanged between Denmark and various other countries. Alternatively, the ma-terial can only be handled in high-containment laboratories.
Because of the demand to inactivate any virus species po-tentially present in imported biological material, the method should be efficient for different types of viruses. We report here the testing of two different methods of virus inactivation: chemical inactivation with ethylenimine (EI) and physical in-activation by electron-beam irradiation. The viruses used were selected in order to represent different classes of viruses, e.g., naked or enveloped virus particles with a DNA or an RNA genome and with different degrees of resistance to physico-chemical treatments. Because viruses in general are protected from inactivation by protein and since serum is a common
sample material in a research context, we used sterile bovine serum as the suspension medium. The serum was spiked with three model viruses: porcine parvovirus (PPV), a nonenvel-oped DNA virus; porcine enterovirus (PEV), a nonenvelnonenvel-oped RNA virus; and bovine viral diarrhea virus (BVDV), an envel-oped RNA virus. The samples were subjected to chemical inactivation with EI or to electron-beam irradiation in frozen and liquid form.
In this article we focus on the differences in inactivation kinetics of the two methods for different classes of viruses and use this information to highlight some of the issues to be considered before choosing an inactivation method for a given sample.
MATERIALS AND METHODS
EI for virus inactivation.Fresh EI (0.1 M) was prepared as described by Bahnemann (2). Briefly, 0.2 M stock solutions of bromoethylamine hydrobro-mide (FLUKA 6670) in deionized water, stored frozen at220°C in small por-tions, were thawed and mixed with an equal amount of 0.4 M NaOH at 37°C for 1 h.
Serum.Sterile bovine serum was obtained from the donor herd at the Danish Veterinary Laboratory and was stored at220°C until use. This is a controlled herd which is tested and declared to be free of BVDV and BVDV antibodies twice a year. The serum was tested for BVDV antibodies by a serum neutral-ization test and for BVDV by propagation on susceptible cells followed by peroxidase-linked BVDV antibody staining.
Preparation of virus used for spiking.In order to study carefully the kinetics of inactivation, it is important that the inactivation be performed with high initial titers. Therefore, concentrated virus stocks were prepared as described below for each of the three viruses.
(i) PPV.Primary porcine kidney cells in 1-liter roller culture bottles were infected with PPV and incubated for 10 days at 37°C. They were then stored vertically at room temperature overnight, and the cells were shaken off into the growth medium and pooled. The virus was precipitated by adjusting the pH to 4.0 and was captured by filtration. The precipitate was extracted by stirring with 20
* Corresponding author. Mailing address: Danish Veterinary Insti-tute for Virus Research, Lindholm, DK-4771 Kalvehave, Denmark. Phone: 45 5586 0221. Fax: 45 5586 0300.
† Present address: Novo Nordisk A/S, Department for Molecular Biology and Virology, Mørkhøj Bygade 28-SMH2.23, DK-2860 Søborg, Denmark.
504
on August 17, 2020 by guest
http://cvi.asm.org/
mM glycine (pH 9.0; 5% of the original volume), and cell debris was removed by filtration. The extract was frozen and stored at220°C until use as virus for spiking (spike virus). The titer of the spike virus was 9.2 log10(50% tissue culture
infective doses [TCID50s]/50ml).
(ii) BVDV.Secondary calf kidney cells in 1-liter roller culture bottles infected with BVDV and incubated at 37°C for 3 days were frozen, and the cells were shaken off during thawing and pooled. Virus was precipitated by the addition of 23 g of NaCl per liter and 7% (wt/vol) polyethylene glycol 6000 (PEG) and stirring on ice for 4 h. After centrifugation (31,3003g, 15 min, 5°C) the pellet
was drained well and resuspended in growth medium that had been taken out before precipitation, equal to approximately 1% of the original volume of the pooled material, sonicated (three times for 15 s each time; 12-mm amplitude), and stirred overnight at 4°C. After stirring, the solution was centrifuged (9,8803 g, 15 min, 5°C) to remove the cell debris. The supernatant was frozen and stored
at250°C until use as spike virus. The titer of the spike virus was 6.7 log10
(TCID50s/50ml).
(iii) PEV.Secondary porcine kidney cells in 1-liter roller culture bottles in-fected with a Talfan disease isolate of PEV serotype 1 and incubated for 2 days at 37°C were frozen, and the cells were shaken off during thawing and pooled. The pH was adjusted to 7.0 with 0.1 M NaOH. PEG was added to 7% (wt/vol) and stirred magnetically on ice for 2 h before centrifugation at 31,3003g for 15
min at 5°C. The pellet was drained well and resuspended in Tris-EDTA (0.05 M Tris, 0.01 M EDTA [pH 8.86]) at 1% of the original volume, sonicated (three times for 15 s each time; 12-mm amplitude), and stirred overnight at 4°C. After stirring, the solution was centrifuged (9,8803g, 15 min, 5°C) to remove the cell
debris. The supernatant was frozen and stored at250°C until use as spike virus. The titer of the spike virus was 7.6 log10(TCID50s/50ml).
Inactivation with EI.The chemical inactivation of the viruses was carried out under constant stirring at 37°C. Mock-exposed (no EI) samples were included in all experiments. The 0-h value of the mock-exposed sample was used as the 0-h value for each EI concentration.
(i) PPV.The virus was diluted 1:10 in sterile bovine serum and filtered through a 0.2-mm-pore-size membrane filter before the addition of EI to final concen-trations of 5 and 10 mM or mock exposure (all in duplicate). Aliquots were taken at 0.5, 1, 3, 5, 10, 14.75, and 24 h, frozen in a dry ice-ethanol bath, and subse-quently freeze-dried to remove the EI. The dried samples were stored at 4°C, resuspended in sterile deionized water equal to the original volume, and titrated.
(ii) BVDV.The virus was diluted 1:40 in sterile bovine serum and filtered through a 0.2-mm-pore-size membrane filter before the addition of EI to final concentrations of 5 and 10 mM or mock exposure (all in duplicate). Aliquots were taken at 2, 5, 24, 48, and 72 h. Immediately after removal of the samples from the inactivation mixture, aqueous sodium thiosulfate (2.0 M) was added to the samples to a final concentration of 0.02 M to quench the EI. The samples were chilled on ice, and in order to remove EI and sodium thiosulfate, they were dialyzed (1 liter/10-mL sample; dialysis was with Medicell Visking tubes; cutoff value, 12,000 to 14,000 Da) overnight at 4°C against Earle’s balanced salt solu-tion with the following supplements: 1 mg of streptomycin per ml, 0.05 mg of neomycin per ml, 5 mg of whey protein concentrate (WPH 800; Danmark Protein A/S, Nr. Vium, Denmark) per ml, 2mg of choline chloride per ml, 2mg of folinic acid per ml, 2mg of nicotine amide (NAD) per ml, 2mg of pantothenic acid, sodium salt per ml, 2mg of pyridoxal hydrochloride per ml, 2mg of thiamine hydrochloride per ml, and 0.2mg of riboflavin per ml; the pH was adjusted to 7.5 to 7.8 with 1 M NaOH or HCl. After dialysis the samples were stored at 4°C for not more than 3 days until titration.
(iii) PEV.The virus was diluted 1:20 in sterile bovine serum and filtered through a 0.2-mm-pore-size membrane filter before the addition of EI to final concentrations of 5 and 10 mM or mock exposure (all in duplicate). Samples were taken at 0.25, 0.50, 1, 2, 3, 5, and 24 h. Immediately after removal of the samples from the inactivation mixture aqueous sodium thiosulfate (2.0 M) was added to the samples to a final concentration of 0.02 M to quench the EI. The samples were chilled on ice and dialyzed as described for BVDV. After dialysis the samples were stored at 4°C for not more than 3 days until titration.
Inactivation of virus by irradiation.The virus was diluted in sterile bovine serum (PPV, 1:10; BVDV and PEV, 1:40), and 3.5-ml aliquots were placed into polyethylene tubes (Minisorp; catalog no. 4-66982; Nunc, Roskilde, Denmark). The tubes were frozen in a vertical position by using dry ice-ethanol or at250°C
and were then fixed horizontally for irradiation. Irradiation was carried out at the 10-MeV electron accelerator of Risø National Laboratory. The beam was di-rected vertically from above, the pulse rate was 200 Hz, the pulse length was 4ms, and the pulse current was 1 A. Irradiation to 11 kGy takes approximately 30 s, and the irradiation was carried out in steps of approximately 11 kGy at 5- to 10-min intervals; the exact doses were measured with a dosimeter which followed the doses in the samples during irradiation. The irradiation was performed on frozen samples held on dry ice and on liquid samples on an ice-water bath. For each of the three viruses, frozen and liquid samples were irradiated with 11.9, 23.3, 34.8, or 45.9 kGy, each in duplicate. Mock-exposed samples, both frozen and liquid, were included in the experiment. All samples were covered with approximately 1.5 cm of ice or dry ice during irradiation. After irradiation all samples were frozen on dry ice and stored at250°C until titration.
Titration of viruses.Serial dilutions of the virus suspensions were made in Eagle’s basal medium supplemented with 1 mg of streptomycin per ml and 50mg of neomycin per ml. For each dilution 50ml/well was applied to 7 or 10 wells in a microwell plate. Negative controls consisting of 50ml of Eagle’s basal medium per well were made. Each well was supplemented with 50ml of Eagle’s basal medium and 100 ml of cell suspension. The porcine testicle cell line ST117 (ATCC 1746-CRL) (approximately 230,000 cells/ml in Eagle’s basal medium with 3% fetal calf serum [FCS]) was used for PPV titrations. Secondary calf kidney cells (approximately 200,000 cells/ml in Eagle’s basal medium with 10% FCS) were used for BVDV titrations. Secondary porcine kidney cells (approxi-mately 200,000 cells/ml in Eagle’s basal medium with 10% FCS) were used for PEV titrations. After incubation for 4 days at 37°C in 5% CO2in air, the cells
were fixed with 99% ethanol (45 min, 5°C). Virus-infected cells were stained with peroxidase-linked antibodies (PPV, peroxidase-linked monoclonal antibody against PPV; BVDV, polyclonal swine antibodies against BVDV, followed by peroxidase-linked guinea pig anti-swine antibodies [DAKO, Glostrup, Den-mark]; and PEV, polyclonal guinea pig antibodies against PEV serotype 1, followed by peroxidase-linked rabbit anti-guinea pig antibodies [DAKO]) by using 0.04% ethylcarbazole and 1% hydrogen peroxide in ethanol as a chromo-genic substrate. The results were visually read by using an inverted microscope.
RESULTS
The results of the experiments are presented in Table 1 and Fig. 1. In the following text all inactivation rates for EI inac-tivation are expressed as log10(TCID50s/50ml)/h unless
indi-cated otherwise. For comparison, inactivation is described in terms of the initial inactivation rate, the time for inactivation of 4 log10 (TCID50s/50 ml), and the time before the detection
limit (a titer of 0.5 log10[TCID50s/50ml]) was reached.
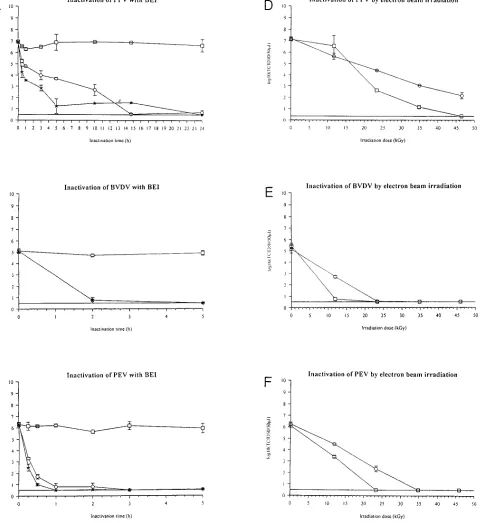
Inactivation with EI.The results of inactivation with EI are
presented in Fig. 1A to C. The inactivation followed a similar pattern for all viruses: a rapid initial phase followed by a gradually slower inactivation, resulting in tailing of the inacti-vation curves.
The inactivation of PPV was the slowest among the viruses investigated. The inactivation rates within the first hour of inactivation were 2.4 and 3.5 for 5 and 10 mM EI, respectively. The time for inactivation of 4 log10units was 9 h with 5 mM EI
and 3 h with 10 mM EI (calculated by interpolation). The detection limit was reached after 24 h of inactivation.
During the first 2 h the inactivation rate for BVDV was 2.3 for both concentrations of EI. The time for inactivation of 4 log10units was 1 h and 44 min for both concentrations of EI
(calculated from the initial inactivation rate). The detection limit was reached at between 2 and 5 h of inactivation.
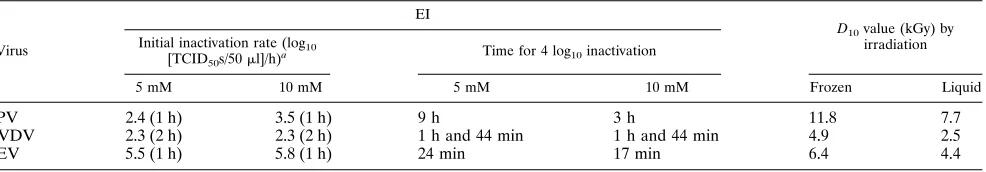
TABLE 1. Inactivation of PPV, PEV, and BVDV with EI or irradiation
Virus
EI
D10value (kGy) by
irradiation Initial inactivation rate (log10
[TCID50s/50ml]/h)
a Time for 4 log10inactivation
5 mM 10 mM 5 mM 10 mM Frozen Liquid
PPV 2.4 (1 h) 3.5 (1 h) 9 h 3 h 11.8 7.7
BVDV 2.3 (2 h) 2.3 (2 h) 1 h and 44 min 1 h and 44 min 4.9 2.5
PEV 5.5 (1 h) 5.8 (1 h) 24 min 17 min 6.4 4.4
aThe initial inactivation rates are based on the values measured within the first hour or the first 1 or 2 h, as indicated in parentheses.
on August 17, 2020 by guest
http://cvi.asm.org/
The highest inactivation rates were obtained for the inacti-vation of PEV. During the first hour the inactiinacti-vation rates were 5.5 and 5.8 for 5 and 10 mM EI, respectively. The time for inactivation of 4 log10units was 24 min with 5 mM EI and 17
min with 10 mM EI (calculated by interpolation). The detec-tion limit was reached after 2 h of inactivadetec-tion.
Inactivation by electron-beam irradiation. The results of
virus inactivation by electron-beam irradiation are presented in
FIG. 1. (A) Inactivation of PPV with EI.h, 0 mM EI;E, 5 mM EI;w, 10 mM EI. (B) Inactivation of BVDV with EI.h, 0 mM EI;E, 5 mM EI;w, 10 mM EI. After 5 h no virus was detected in the inactivated samples. (C) Inactivation of PEV with EI.h, 0 mM EI;E, 5 mM EI;w, 10 mM EI. After 5 h no virus was detected in the inactivated samples. (D) Inactivation of PPV by electron-beam irradiation.E, inactivation of frozen samples on dry ice;h, inactivation of liquid samples on ice-water. (E) Inactivation of PEV by electron-beam irradiation.E, inactivation of frozen samples on dry ice;h, inactivation of liquid samples on ice-water. (F) Inactivation of BVDV by electron-beam irradiation.E, inactivation of frozen samples on dry ice;h, inactivation of liquid samples on ice-water. The symbols and bars indicate the mean and range between two samples.
on August 17, 2020 by guest
http://cvi.asm.org/
Fig. 1D to F. The almost linear curves indicate a first-order inactivation of the virus. The apparent deviation from linearity of PPV in the liquid state is almost exclusively due to one of the two determinations of virus titer at 11 kGy. A similar effect was not seen for any of the other samples, and we ascribe this to experimental variation of this particular virus titration.
The D10values (the irradiation dose necessary to inactivate
1 log10unit of virus) for the frozen samples were 11.8 kGy for
PPV, 4.9 kGy for BVDV, and 6.4 kGy for PEV, calculated by linear regression (r2value for PPV was 0.93; the r2values were
not calculated for PEV and BVDV due to the few datum points). The D10 values for the liquid samples with PPV,
BVDV, and PEV were 7.7, 2.5, and 4.4 kGy, respectively, calculated by use of linear regression as above (r2for PPV5
0.99) (Table 1; Fig. 1D to F).
DISCUSSION
Inactivation with EI.EI is known to be an alkylating agent,
reacting with, e.g., free sulfhydryl and amino groups, and has been used as an agent for inactivating viruses. It has been found to be more gentle to proteins in the samples than, e.g., formaldehyde or glutaraldehyde inactivation (4). The inactiva-tion of viruses with EI and similar aziridines has been used extensively during the past 20 years and longer (1–3, 8, 16). However, the experimental conditions have varied, and there-fore, the results are seldom directly comparable. Our initial inactivation rates (within the first hour of inactivation) for PEV of 5.5 and 5.8 log10/h for 5 and 10 mM EI, respectively,
compare well to those in other studies of the family Picorna-viridae, in which inactivation rates between 2.8 and 6.0 log10/h
have been found by others using 4.6 mM EI (1, 6). Two dif-ferent serotypes of foot-and-mouth disease virus inactivated with 10 mM EI showed inactivation rates of 10.2 and 5.4 log10/h, respectively (2). The experimental conditions in those
studies were similar to the conditions in the present study, i.e., they were performed at 37°C in either serum or tissue culture medium with serum supplement.
The kinetics of EI inactivation was similar for all viruses: a rapid drop in infectivity, followed by a gradual decline in the inactivation rate. The cause of this tailing effect remains un-known, but it could be due to inhomogeneity of the virus preparation, with a fraction of virus being protected against the reaction with EI. Such an effect might be exerted by the mask-ing of virus particles by proteins or lipids from the sample, preventing the diffusion of EI into the virus particle and thereby possibly the inactivating effect of EI on the nucleic acid. Such inhomogeneity of the samples is unpredictable and could very well be dependent on the exact virus species in-volved, as well as on the material in which it is present. The present experiments were conducted with serum spiked with cell culture-derived virus. Masking could be more pronounced if the virus has multiplied in the animal and possibly secreted into the bloodstream together with, e.g., cell debris. Such masking would influence the time necessary for inactivation by EI. Another reason for the tailing effect when using EI for inactivation could be a decrease in the concentration of EI during the inactivation process. Using the assay of May et al. (14) for determination of the EI concentration, we have been able to exclude this possibility (data not shown).
In previous studies the tailing of the inactivation curve has only been seen by Hassanain (8) during inactivation of African horse sickness virus. The lack of reported tailing might be explained by the fact that most of the experiments with EI inactivation of viruses have been limited to 1 to 5 h (1, 2, 8). In two studies in which the inactivation was carried out for 6 h,
one of them (16) had only four points on the curve and as-sumed linearity. The other study (3) showed a few more datum points, but although linearity was assumed, the data suggest a slight tailing of the curve within the last part of the inactivation. Such tailing has a very important impact on the estimation of the time needed for complete inactivation (i.e., no infectious virus in a batch of, e.g., serum).
Despite this difficulty of estimating the endpoint for com-plete inactivation, it is possible from our results to specify conditions for treatment of serum samples with EI leading to material which can be handled in an open laboratory with a minimal risk of spreading unwanted viruses.
Inactivation by electron-beam irradiation.In this study the
D10values found for samples irradiated in the liquid state were
between 51 and 69% of the values for the corresponding frozen samples; i.e., a higher dose was needed to inactivate the same amount of virus when the samples were frozen. The same phenomenon was observed by Elliott et al. (7) when inactivat-ing viruses of the families Arenaviridae and Filoviridae. This is to be expected since the mobility of reactive (virus-inactivat-ing) free radicals generated by irradiation is higher in liquid material than in solid material (12, 17). Some previous studies on inactivation by irradiation are listed in Table 2 for compar-ison. Most of the previous experiments with virus inactivation by irradiation were made withg-irradiation from60Co sources
(7, 9, 13, 16, 17), but inactivation with electron-beam irradia-tion has been described as well (10). Because of different experimental conditions, these results are not directly compa-rable to the results achieved here or in the other experiments mentioned earlier. We do not expect the nature of irradiation
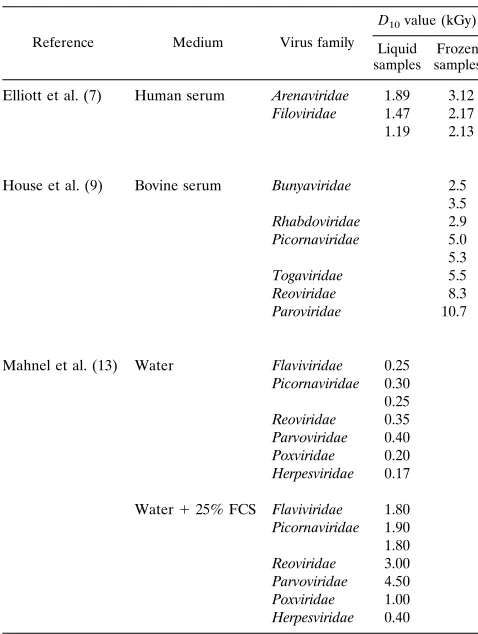
TABLE 2. Some previously published data on virus inactivation by
60Co irradiation
Reference Medium Virus family
D10value (kGy)
Liquid samples
Frozen samples Elliott et al. (7) Human serum Arenaviridae 1.89 3.12
Filoviridae 1.47 2.17 1.19 2.13
House et al. (9) Bovine serum Bunyaviridae 2.5 3.5
Rhabdoviridae 2.9
Picornaviridae 5.0 5.3
Togaviridae 5.5
Reoviridae 8.3
Paroviridae 10.7
Mahnel et al. (13) Water Flaviviridae 0.25
Picornaviridae 0.30 0.25
Reoviridae 0.35
Parvoviridae 0.40
Poxviridae 0.20
Herpesviridae 0.17 Water125% FCS Flaviviridae 1.80
Picornaviridae 1.90 1.80
Reoviridae 3.00
Parvoviridae 4.50
Poxviridae 1.00
Herpesviridae 0.40
on August 17, 2020 by guest
http://cvi.asm.org/
(gor electron) to be the cause of any significant differences in D10values.
The results of Mahnel et al. (13) indicate that a higher protein content results in higher D10values. It is also seen that
the D10values for viruses of the families Picornaviridae and
Togaviridae in the same experiment (9) were about the same, whereas members of the family Parvoviridae have D10values
approximately twice as high (9, 13), which is in agreement with our results.
Comparative aspects.The kinetics of the inactivation
pro-cess with EI differs significantly from that of inactivation by irradiation. A first-order inactivation (with respect to virus concentration) will give a straight line in the semilogarithmic plots in Fig. 1. Inactivation by irradiation shows an almost perfect first-order inactivation for all three model viruses, whereas the chemical inactivation shows a pronounced de-crease in the rate of inactivation with time, resulting in tailing of the curve. In contrast, the penetrating capacity of the elec-tron-beam irradiation through biological material should en-sure a safe inactivation, irrespective of the possible masking of virus particles by serum components and, furthermore, should also be applicable for inactivation of virus in other types of biological samples. However, large samples are problematic with regard to electron-beam irradiation, because the penetra-tion is limited. The D10values that we obtained are only valid
when using similar penetration depths. Chemical inactivation requires addition of the inactivating reagent to each sample and subsequent incubation at 37°C. Therefore, this process might cause greater variation between samples than irradia-tion. Furthermore, chemical inactivation will presumably be problematic in clumpy or inhomogeneous samples, and in such cases irradiation might be preferable.
Considering the level of infectious virus possibly present in blood from animals with no signs of clinical disease, a reduc-tion factor of 106 represents a margin of safety sufficient to
ensure safe handling of possibly infected biological material in open laboratories. This reduction factor is also the criterion used in tests of the virucidal activities of disinfectants in sus-pension experiments according to the CPMP Notes for Guid-ance on Virus Validation Studies (5).
Furthermore, PPV belongs to the family Parvoviridae, the members of which exhibit extraordinary resistance to physico-chemical reagents compared to the resistance of other viruses (15) (Table 2), which also has been confirmed in the present study. Therefore, parvovirus can be considered a suitable worst-case agent in inactivation experiments.
By using the criterion of a 6 log10reduction in the infectivity
of PPV, the conditions of treatment of serum samples to obtain an adequately safe product will be inactivation with 5 mM EI at 37°C for 24 h. This period of time is about fivefold longer than the time necessary for inactivation of BVDV and PEV present at concentrations of 5.1 and 6.3 log10(TCID50s/50ml),
respectively. Reduction of PPV infectivity as a reference thus ensures an even more efficient reduction of viruses with lower levels of resistance to physicochemical treatments.
For electron-beam irradiation a 6 log10 reduction in PPV
infectivity could be obtained by a dose of 35 kGy for liquid samples or a dose of approximately 55 kGy (extrapolated) for frozen samples. The choice of method should depend on the influence of the process on the parameters to be studied, e.g., antibody content, enzymes, or hormones. Data regarding
an-tibody activity have been published separately, showing differ-ent influences of inactivation in various assays (11).
In conclusion, all the issues mentioned above regarding sam-ple type, state, size, possible contamination level, and influence on the analysis to be performed after inactivation should be taken into consideration when designing an inactivation pro-tocol for a specific sample.
ACKNOWLEDGMENTS
We thank Anne Olsen and Mette Wrang Siggaard for technical assistance, Jens Nielsen for supply of cells, Merete Holm Jensen for supply of PPV and monoclonal antibodies against PPV, Anette Bøtt-ner for practical help in connection with the PPV work, Leif Rønsholt for supply of BVDV and polyclonal antibodies against BVDV, and Helle Friis Proschowsky for supply of PEV and monoclonal antibodies against PEV (all of these individuals are at the Danish Veterinary Institute for Virus Research).
The project was supported by Danida (ENRICA-project 104.Dan.8.L/704).
REFERENCES
1. Bahnemann, H. G. 1973. The inactivation of foot-and-mouth disease virus by ethylenimine and propylenimine. Zentralbl. Vet. Med. B 20:356–360. 2. Bahnemann, H. G. 1975. Binary ethylenimine as an inactivant for
foot-and-mouth disease virus and its application for vaccine production. Arch. Virol.
47:47–56.
3. Bauer, K. 1970. Die Inaktivierung des Maul-und-Klauenseuche (MKS) Virus durch A¨ thyla¨thylenimine und die Eignung des inaktivierten Virus zur Impfstoffherstellung. Zentralbl. Bakteriol. Parasitenkd. Infektionskr. Hyg. Abt. 1 Orig. 213:285–297.
4. Blackburn, N. K., and T. G. Besselaar. 1991. A study of the effect of chemical inactivants on the epitopes of Rift Valley fever virus glycoproteins using monoclonal antibodies. J. Virol. Methods 33:367–374.
5. Committee for Proprietary Medicinal Products. 1995. Notes for guidance on virus validation studies: the design, contribution and interpretation of studies validating the inactivation and removal of viruses. CPMP/BWP/268/95. Eu-ropean Agency for Evaluation of Medicinal Products, London, England. 6. Cunliffe, H. R. 1973. Inactivation of foot-and-mouth disease virus with
eth-ylenimine. Appl. Microbiol. 26:747–750.
7. Elliott, L. H., J. B. McCormick, and K. M. Johnson. 1982. Inactivation of Lassa, Marburg, and Ebola viruses by gamma irradiation. J. Clin. Microbiol.
16:704–708.
8. Hassanain, M. N. 1992. Preliminary findings for an inactivated African horsesickness vaccine using binary ethylenimine. Rev. Elev. Med. Vet. Pays Trop. 45:221–234.
9. House, C., J. A. House, and R. J. Yedloutsching. 1990. Inactivation of viral agents in bovine serum by gamma irradiation. Can. J. Microbiol. 36:737–740. 10. Huber, W. 1952. Cold sterilization by electron beam as a possible tool for the inactivation of the virus of homologous serum jaundice in plasma. Ann. N. Y. Acad. Sci. 55:536–542.
11. Kyvsgaard, N. C., P. Lind, T. Preuss, S. Kamstrup, J. C. Lei, H. O. Bogh, and
P. Nansen.1996. Activity of antibodies against Salmonella dublin,
Toxo-plasma gondii, or Actinobacillus pleuropneumoniae in sera after treatment
with electron beam irradiation or binary ethylenimine. Clin. Diagn. Lab. Immunol. 3:628–634.
12. Latarjet, R. 1972. Interaction of radiation energy with nucleic acids. Curr. Top. Radiat. Res. Q. 8:1–38.
13. Mahnel, H., H. S. von Brodorott, and K. Ottis. 1980. Empfindlichkeit von Viren gegen Gammastrahlen. Zentralbl. Bakteriol. Parasitenkd. Infektion-skr. Hyg. Abt. 1 Orig. Reihe B 170:57–70.
14. May, E. M., D. C. Hunt, and J. Sloggem. 1980. A normal phase high-performance liquid chromatographic assay for aziridine residue in trientine dihydrochloride. J. Pharm. Biomed. Anal. 5:65–70.
15. Mengeling, W. L. 1989. Porcine parvovirus, p. 83–94. In M. B. Pensaert (ed.), Virus infections of porcines. Elsevier Science Publishers B.V., Amsterdam, The Netherlands.
16. Sun, I. L., D. P. Gustafson, and G. Scherba. 1978. Comparison of pseudo-rabies virus inactivated by bromo-ethyleneimine,60Co irradiation, and
acri-dine dye in immune assay systems. J. Clin. Microbiol. 8:604–611. 17. Thomas, F. C., A. G. Davies, G. C. Dulac, N. G. Willis, G. Papp-Vid, and A.
Girard.1981. Gamma ray inactivation of some animal viruses. Can. J. Comp. Med. 45:397–399.