Jurnal Teknologi, 41(B) Dis. 2004: 57–68 © Universiti Teknologi Malaysia
FINITE ELEMENT MODELLING OF STRUCTURAL CLAY BRICK MASONRY SUBJECTED TO AXIAL COMPRESSION
JAHANGIR BAKHTERI1, AHMAD MAHIR MAKHTAR2 & SHAMALA SAMBASIVAM3
Abstract. This paper presents the numerical verifications of the experimental investigation on the effect of mortar joint thickness on compressive strength characteristics of axially loaded brick-mortar prisms. The three dimensional micro modeling of the prisms was based on two approaches: firstly, models were assumed to be made of homogeneous material; the second approach envisaged the models as composite material made of brick and mortar. The later modeling approach, which assumed the prism to be made of composite material, gave more accurate prediction of the stress distribution in the prisms, and also the failure loads predictions were in good agreement with the experimental results, suggesting that this modeling approach with composite material assumption is more appropriate than the homogenous material assumption. In the present work, a strength magnification factor has also been proposed for the design purposes, which can be used to assess the experimental compressive strength of the brick masonry from its finite element analysis results.
Keywords: Masonry, homogenization, composite, stress, strain
Abstrak: Kertas kerja ini membentangkan pembuktian berangka hasil dari ujikaji kesan ketebalan sambungan lepa ke atas sifat kekuatan mampatan bagi prisma bata-lepa yang berbeban paksi. Pemodelan mikro tiga dimensi bagi prisma tersebut dibuat dengan dua kaedah: yang pertama, model tersebut dianggap telah dibina dengan bahan sejenis; yang kedua, model dilihat sebagai bahan komposit yang dibina dari lepa dan bata. Kaedah yang kedua membuat anggapan bahawa prisma terdiri dari pada bahan komposit dan memberikan ramalan yang lebih tepat bagi pengagihan tegasan dalam prisma dan ramalan kegagalan bahan juga menunjukkan kesesuaian yang baik dengan keputusan ujikaji. Ini menunjukkan bahawa anggapan kaedah pemodelan bahan komposit lebih baik daripada anggapan bahan sejenis. Dalam kajian ini, suatu faktor penggandaan kekuatan telah dicadangkan untuk tujuan reka bentuk yang boleh digunakan untuk menilai keputusan ujikaji kekuatan mampatan batu bata dari keputusan analisis unsur terhingga.
Kata kunci: Pertukangan bata, kesejenisan, komposit, tegasan, keterikan
1.0 INTRODUCTION
Masonry is a composite material with the brick as the building units and mortar as the joining material, which are bonded together at an interface. The basic mechanical properties of the masonry are strongly influenced by the mechanical properties of its constituents, namely, brick and mortar. Utilising the material parameters obtained
1,2&3
from experiments and using actual geometric details of both components and joints, it is possible to reproduce the behavior of masonry numerically [1].
Equivalent elastic modulus for brick masonry had been studied by Pande [2], assuming that no slippage occurs between the mortar layers and brick unit with the head joints considered to be continuous. The study proved that for a normal case, where elastic modulus of mortar, Ej, is less than elastic modulus of brick, Eb, the increase in mortar thickness results in reduction of elastic modulus of the masonry, and increase of elastic modulus of mortar, which leads to an increase in the elastic modulus of masonry. Numerous investigations are performed on homogenization technique, which is based on the assumption that masonry is a periodic structure formed from regular repetition of non-homogeneous elements, whose dimensions are small to the overall size of the structure [3,4,5,6]. In this method, the behavior of the masonry is roughly approximated by linear elasticity and perfect interface bonding hypothesis.
The main problem in this approach is the mathematical errors introduced in the homogenization process, when large difference in stiffness is expected for the two components. Therefore, the accuracy of the homogenized masonry model for an increasing ratio between the stiffness of the two components was assessed by Zucchini
et al. [7]. They proposed a model and showed that up to a stiffness ratio of one thousand, the maximum error in the calculation of the homogenized Young's moduli is lesser then 5%.
In order to improve the Finite Element Method (FEM) prediction of the masonry behaviour, micro modeling for small masonry prisms using link elements was proposed by Pande et al. [8]. This approach is very accurate and gives good insight into micro stresses in masonry. However, the limitation is that such modeling requires large number of elements and input of mechanical characteristics of constituents. To further the studies, the progressive failure in structural masonry was analysed using a continuum formulation that is applicable to representative volume, which comprises large number of units interspersed by mortar joints [9]. Even though the representation of each unit and joint becomes impractical in case of masonry structure comprising a large number of units, a 3D finite element failure analysis of masonry walls subjected to both vertical and horizontal loads was proposed by Subash et al. [10]. The wall was modeled using eight-node solid elements and the cracking at the interface was modeled using simple Mohr- coulomb criterion.
finite element modeling using both models. The tested masonry prisms were in five sets, and each set had a specific mortar joint thickness. Each model was constructed using five clay bricks, as shown in Figure 1.
2.0 NUMERICAL ANALYSIS
Using eight-node isoparametric brick elements, each model had been discretized into 72 elements. The discretization is such that, bricks and mortar joints had been represented by separate layers of elements, as shown in Figure 2.
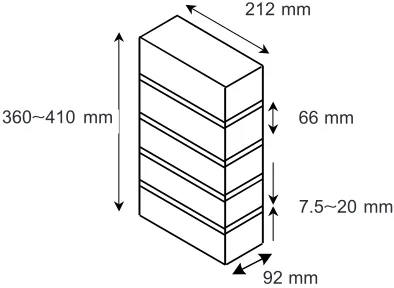
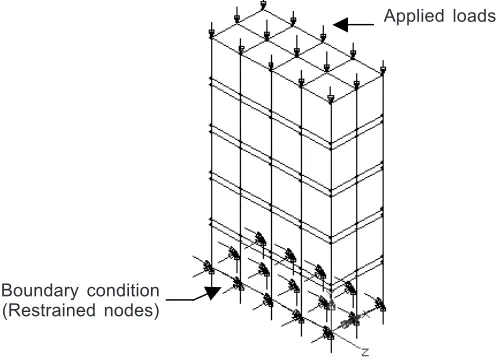
Each model was assumed to be subjected to axial compressive load, as shown in Figure 3. The boundary condition adopted was that all nodes at the base of the models were assumed to be fixed. The models were assumed to be constructed from five local clay bricks having dimensions of 212 mm × 92 mm × 66 mm (length × width ×
Figure 2 Prism discretized into 72 eight noded brick elements Figure 1 Dimensions of a typical five clay bricks prism
92mm 212mm
360~410mm
7.5~20mm 66mm 212 mm
92 mm
height), and each model with unique mortar joint thickness. There were five sets of models having different mortar joint thicknesses, which were 7.5, 10, 12.5, 15, and 20.0 mm.
2.1 Analysis of Models as a Homogenized Material
In this analysis, the brickwork, which is made from two different materials of clay bricks and mortar, had been replaced by an equivalent homogenous material. This approach, which is used by many researchers in this field, assumes that brickwork is made from a single material [8]. Determination of the states of strains/stress and also limit states are possible with the aid of finite element analysis, if the material properties of the masonry are properly defined. The equivalent material properties can be determined by experimental method and might require a set of extensive, and costly experiments. To overcome this barrier, the experimental method can be replaced with the formulation recommended by Uniform Building Code (UBC-1991) of America. The equation for the elastic properties of the equivalent material is derived in terms of elastic properties of the brick and mortar, together with the relative thickness [12].
UBC recommends that the modulus elasticity of masonry (Em) in compression can be calculated using the following equation:
(
γ)
γ γ + =
1+
1 t
m b
t
m
E E
(1)
where,
Figure 3 Typical model showing the applied load and boundary conditions
Applied loads
Boundary condition (Restrained nodes) Boundary condition (Restrained nodes)
λt =Thickness ratio = j b
t t
λm=Modulus ratio = j b
E E
tj =Thickness of mortar joints
tb =Thickness of brick
Ej =Modulus of elasticity of mortar joints, assumed to be 20000 N/mm2 [8].
Eb=Modulus of elasticity of bricks, assumed to be 37000 N/mm2 [8].
Considering a model with a 7.5 mm mortar joint thickness, the modulus of elasticity of masonry can be calculated as follows:
γ γ = γ = = = = γ + = = + 2 7 5 0 114 66 0 0 541 0 114 0 211 0 541
1 0 114
37000 34046 95 N/mm
1 0 211
j b j m b t m m t . = = . t . E . E . . . . E . . t
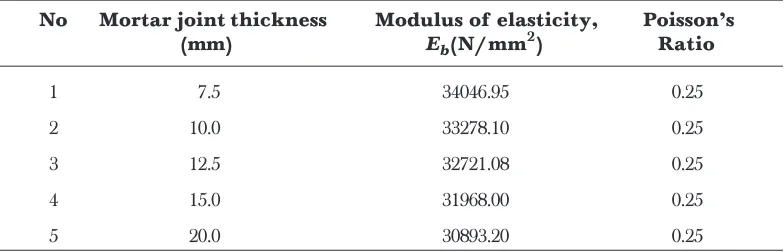
Using equation (1), the modulus of elasticity for various models have been calculated and shown in Table 1.
Poisson’s ratio of 0.25 for brickwork, as recommended by most of the researchers [8,13] had been adopted in the present study.
Table 1 Modulus of elasticity of prisms with different mortar joint thickness
No Mortar joint thickness Modulus of elasticity, Poisson’s
(mm) Eb(N/mm2) Ratio
1 7.5 34046.95 0.25
2 10.0 33278.10 0.25
3 12.5 32721.08 0.25
4 15.0 31968.00 0.25
Using material properties from Table 1 and LUSAS computer software, three-dimensional finite element analyses of different models had been carried out. From the results, only the maximum vertical compressive stresses and vertical compressive strains in the models have been tabulated, and shown in Table 2.
2.2 Idealization of Models as a Composite Material
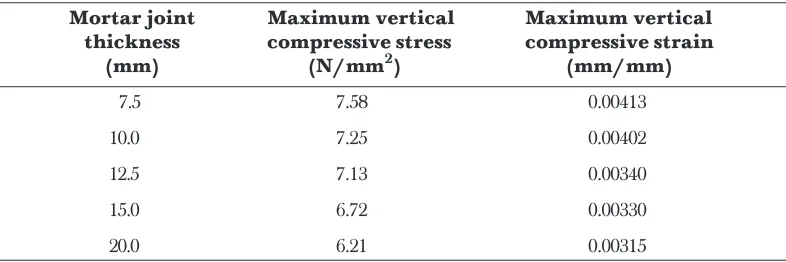
In this analysis, the model is assumed to be made from two different materials, namely clay bricks and mortar [8,14]. The modulus of elasticity of clay brick was assumed to be Eb= 37000 N/mm2 with a Poisson’s ratio of νb= 0.1. The modulus of elasticity of mortar was assumed to be Ej= 20000 N/mm2 and νj= 0.25. The mortar was assumed to be having a mix proportion of 1:1:5 (cement : sand : lime). It was also assumed that the brick and mortar were perfectly bonded together. The finite element discretization of the models was carried out in such a manner that mortar joints and bricks were represented by separate layers of elements. The non-linearity considered in the analysis of the model was only material non-linearity. This is because, mortar having lower compressive strength, behaves as a non-linear material. The 3-D finite element analyses of the models had been carried out and only maximum value of vertical compressive stresses and vertical compressive strains in the models, are represented in Table 3.
Table 2 Finite element results for models idealised as a homogenized material
Mortar joint Maximum vertical Maximum vertical
thickness compressive stress compressive strain
(mm) (N/mm2) (mm/mm)
7.5 7.89 0.00415
10.0 7.45 0.00405
12.5 7.30 0.00400
15.0 6.42 0.00370
20.0 6.23 0.00320
Table 3 Finite element results for models idealized as a composite material
Mortar joint Maximum vertical Maximum vertical
thickness compressive stress compressive strain
(mm) (N/mm2) (mm/mm)
7.5 7.58 0.00413
10.0 7.25 0.00402
12.5 7.13 0.00340
15.0 6.72 0.00330
3.0 COMPARISON AND DISCUSSION OF RESULTS
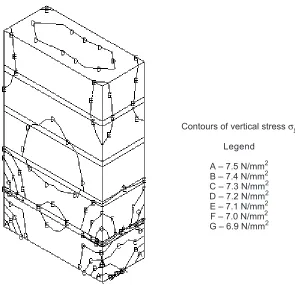
Figure 4 shows the deformed shape of a model with 10 mm mortar joint thickness, and contours for vertical stresses of the same model are shown in Figure 5. The comparison of stress-strain curves for different models from both approaches, and experimental study, are shown in Figures 6 to 10.
It should be pointed out that the numerical results presented above were obtained after several corrections of the constituent’s materials data. The first FEM calculation with the mortar, masonry, and brick’s mechanical properties taken from the experimental study led to big discrepancies between the results from FEM, and testing of the prisms with different mortar joint thickness. This confirms that the properties of mortar inside the joints of the masonry prisms were by far different from those exhibited by the mortar samples, which were tested separately. Therefore, in the next FEM, the values of the mechanical properties were increased significantly, according to the previous literature[8]. These results were much closer to the experimental results.
The stress strain curve obtained from both analyses shows that the maximum compressive strength of brickwork was slightly higher for the case of homogenized material than that of the composite material. Homogenized model behaves as one material, that the dispersion of load in the model will be at about 45°. However, in the case of models assumed to be made from composite materials, similar dispersion of vertical loads cannot be expected. The mortar joint having lower strength than the brick strength, will cause a reduction in the compressive strength of masonry. The actual compressive strength of the masonry determined by experimental method was much higher then the strength obtained by numerical method. However, in reality, the brickwork was constructed from two layered materials, namely brick and mortar, therefore, the idealization of composite material for the analysis should be adopted. Homogenized model exhibits about 4% higher strength than the model assumed as a composite material.
In order to get maximum compressive strength in brickworks, UBC has recommended that the mortar joint thickness should be about 3/8″ (9.52 mm). Similarly, BS 5628 has also recommended that the mortar joint thickness in brick masonry should be 10 mm, in order to obtain optimum compressive strength. However, the earlier experimental study [11] and the present numerical investigation indicate that the maximum compressive strength in brick masonry made from local material can be obtained, when the mortar joint thickness is 7.5 mm.
Deformation 200 times magnified
Figure 4 Deformed shape of the model with 10 mm mortar joint thickness
Figure 5 Vertical stress contour in the model with 10 mm mortar joint thickness
Contours of vertical stress σy
Legend
A -7.5 N/mm2
B -7.4 N/mm2
C -7.3 N/mm2
D -7.2 N/mm2
E -7.1 N/mm2
F -7.0 N/mm2
G -6.9 N/mm2
Deformation 200 times magnified
Contours of vertical stress σy Legend
Figure 6 Stress-strain curve for model with 7.5 mm mortar joint thickness
Figure 7 Stress-strain curve for model with 10 mm mortar joint thickness
Experimental
Numerical model assuming composite material Numerical model assuming homogenized material 14.0
12.0 10.0 8.0 6.0 4.0 2.0 0.0
Compressive stress (N/mm
2 )
0 0.001 0.002 0.003 0.004 0.005
Compressive strain (mm/mm)
Experimental
Numerical model assuming composite material Numerical model assuming homogenized material 14.0
12.0 10.0 8.0 6.0 4.0 2.0 0.0
Compressive stress (N/mm
2 )
0 0.001 0.002 0.003 0.004 0.005
Figure 8 Stress-strain curve for model with 12.5 mm mortar joint thickness
Figure 9 Stress-strain curve for model with 15.0 mm mortar joint thickness
14.0 12.0 10.0 8.0 6.0 4.0 2.0 0.0
Experimental
Numerical model assuming composite material Numerical model assuming homogenized material
Compressive stress (N/mm
2 )
0.0000 0.0010 0.0020 0.0030 0.0040 0.0050
Compressive strain (mm/mm)
14.0 12.0 10.0 8.0 6.0 4.0 2.0 0.0
Compressive stress (N/mm
2 )
0 0.001 0.002 0.003 0.004 0.005
Compressive strain (mm/mm)
Experimental
4.0 CONCLUSION
Numerical and experimental analyses results showed that, by increasing the mortar joint thickness, the strength of the masonry will decrease. The maximum compressive strength of models was obtained when the thickness of the mortar joint was 7.5 mm. It was proposed that in idealization for numerical analysis, the brickwork should be assumed as a composite material, since brick masonry is in reality, a layered material. For the design purposes, the compressive strength of brick masonry obtained from finite element analysis should be magnified with a minimum factor of 1.5, in order to get the actual strength of the brickwork.
5.0 SCOPE FOR FURTHER RESEARCH
The comparison of the results from present study with that of the experimental investigation carried out earlier, showed that there is a significant difference in some cases. Since the experimental result in each set is the average value obtained from the testing of four to five prisms, therefore, by testing large number of prisms in each set, having a unique mortar joint thickness may give a better average value.
Figure 10 Stress-strain curve for model with 20.0 mm mortar joint thickness
14.0 12.0 10.0 8.0 6.0 4.0 2.0 0.0
Experimental
Numerical model assuming composite material Numerical model assuming homogenized material
Compressive stress (N/mm
2 )
0 0.001 0.002 0.003 0.004 0.005
ACKNOWLEDGMENT
This paper presents the results of the research work at Universiti Teknologi Malaysia, (UTM), the funding of which is provided by the Research Managemet Centre (RMC) and their support is gratefully acknowledged.
REFERENCES
[1] Lotfi, H., and P. Shing. 1994. Interface Model Applied to Fracture of Masonry Structures. J. Struct. Engrg.. ASCE. 120(1): 63-80.
[2] Pande, G.N., J. X. Liang, and J. Middleton. 1989. Equivalent Elastic Moduli for Brick Masonry. Comp. Geotech. 8: 243-265.
[3] Briccoli Bati, S., and G. Ranocchiai. 1998. Computer Methods in Structural Masonry – 4. Proceedings of the Fourth International Symposium on Computer Methods in Structural Masonry. E & FN SPON. London. U.K. [4] Cecchi, A., and R. Dimarco. 2002. Homogenized Strategy Towards Identification of Masonry. Journal of
Engineering Mechanics. 128: 688-697.
[5] Chudyba, K., K. Piszczek, K. Stepien, and A. Urbanski. 1998. Computer Methods in Structural Masonry – 4. Proceedings of the Fourth International Symposium on Computer Methods in Structural Masonry. E & FN SPON. London. U.K.
[6] Cecchi, A., and R. Dimarco. 2000. Homogenization of Masonry Walls with a Computational Orientated Prodedure. Eur. J. Mech. A/Solids. 19: 535-546.
[7] Zucchini, A., and P. B. Lourenco. 2002. A Micro-mechanical Model for the Homogenization of Masonry.
International Journal of Solids and Structures. 39: 3233-3255.
[8] Pande, G. N., J. Middleton, and B. Kralj. 1998. Computer Methods in Structural Masonry – 4. Proceedings of the Fourth International Symposium on Computer Methods in Structural Masonry. E & FN SPON. London. U.K. [9] Yan, Z., and T. David. 1998. Nonlinear Analysis of Unreinforced Masonry. Journal of Structural Engineering.
124: 270-277.
[10] Subash, C. A., and K. Y. Kishore. 1996. Three Dimensional Failure Analysis of Composite Masonry Walls.
International Journal of Structural Engineering. 122: 1031-1039.
[11] Bakhteri, J., and S. Sambasivam. 2003. Mechanical Behavior of Structural Brick Masonry: An Experimental Evaluation. Proceeding of 5th Asia-Pacific structural Engineering and construction conference. Malaysia. 305-317.
[12] Abrams, P. D. 1993. Masonry Structures. 2nd edition. Boulder. Colorado. USA: Masonry Society. [13] Harry, A. H. 1988. Masonry: Materials, Design, Construction, and Maintenance. ASTM. USA.