O R I G I N A L R E S E A R C H
Factors Affecting Repeatability of Foveal Avascular
Zone Measurement Using Optical Coherence
Tomography Angiography in Pathologic Eyes
This article was published in the following Dove Press journal:
Clinical Ophthalmology
Nicco J Buffolino1,2 Alexander F Vu1 Aana Amin1
Matthew De Niear1
Susanna S Park 1
1Department of Ophthalmology & Vision
Science, University of California Davis Eye Center, Sacramento, CA, USA;
2University of Nevada-Reno Medical
School, Reno, NV, USA
Purpose:To determine factors that may affect the repeatability of the foveal avascular zone (FAZ) measurement obtained using optical coherence tomography angiography (OCTA) including instrument type, image segmentation, image quality, and fundus pathology.
Patients and Methods:This prospective single-center study enrolled 43 subjects (85 eyes) with retinal vasculopathy, macular edema, optic pathology or normal contralateral eye. The macula was imaged twice using Optovue Angiovue and once using Cirrus Angioplex to obtain 3x3mm OCTA images centered on the fovea. Images were generated by the same operator within 30 mins. The FAZ size for the entire retinal thickness (“overall FAZ”) was measured automatically using the OCTA software. The FAZ size of the superficial and deep retinal vascular plexus layers was measured manually using the enface OCTA images of the segmented layers and Image J analysis. Intraclass correlations coefficient (ICC) was calcu-lated to determine repeatability.
Results:For the overall FAZ measurement, repeatability was excellent (ICC 0.953 right eye, 0.938, left eye) using the same machine (intra-instrument) and somewhat lower but still good to excellent (ICC 0.803 right eye, 0.917 left eye) using machines made by different vendors (inter-instrument). For the segmented layers, intra-instrument repeatability of FAZ measurement was excellent (ICC > 0.95) for both plexus layers. Inter-instrument repeat-ability was good for the superficial plexus layer (ICC 0.86 right eye, 0.88 left eye) but reduced for the deep plexus layer (ICC 0.63 right eye, 0.57 left eye). Suboptimal image quality and presence of retinal vasculopathy and macular edema tended to reduce FAZ repeatability but to a lesser degree.
Conclusion: Inter- and intra-instrument repeatability of the overall FAZ measurement was high using commercial OCTA instruments and only mildly reduced by suboptimal image quality and fundus pathology. For segmented layers, intra-instrument repeatability remained high but inter-instrument repeatability was reduced for the deep plexus layer.
Keywords: foveal avascular zone size, deep retinal vascular plexus, superficial retinal vascular plexus, retinal vasculopathy, macular edema
Introduction
Optical coherence tomography angiography (OCTA) is a new imaging modality that can show the microarchitecture of retinal vascularflow in three-dimensions. As such, flow through the superficial and deep retinal vascular plexus layers can be viewed separately.1,2Traditionally,fluorescein angiography (FA) has been the gold standard for assessing retinal vasculature. However, it is invasive, time-consuming, and only provides two-dimensional imaging.
Correspondence: Susanna S Park Department of Ophthalmology & Vision Science, University of California Davis Eye Center, 4860 Y Street, Suite 2400, Sacramento, CA 95817, USA Tel +1 916 734 6074 Fax +1 916 734 6197 Email [email protected]
Clinical Ophthalmology
Dove
press
open access to scientific and medical research
Open Access Full Text Article
Clinical Ophthalmology downloaded from https://www.dovepress.com/ by 118.70.13.36 on 24-Aug-2020
Accurate and detailed visualization of the retinal vascu-lature is important in evaluating retinal vasculopathy. Optical coherence tomography angiography provides quan-titative parameters of retinal perfusion that can correlate with severity of retinal vasculopathy.3,4 One of these OCTA parameters used to determine macular ischemia is the size of the foveal avascular zone (FAZ). The size of the FAZ noted on OCTA appears to correlate with the size of the FAZ noted using traditional FA.4However, it is impor-tant to determine whether FAZ size measured using OCTA is reliable and repeatable and independent of the OCTA instrument used and presence of fundus pathology.
There are several published reports on repeatability of FAZ size measurement using OCTA in normal eyes with variablefindings depending on how FAZ size is measured and what machine is used.5–10Most studies measured FAZ by segmenting the superficial and/or deep retinal capillary layers separately and showed good repeatability using the same instrument (intra-instrument) but some variability using machines made by different vendors (inter-instrument). Repeatability of the FAZ measurement using OCTA in eyes with fundus pathology would be more clinically relevant but has not been studied in detail.
The OCTA software continues to be modified and updated, and we now have commercial OCTA instruments with software that provides an automated measurement of the “overall FAZ”, ie, FAZ size obtained using retinal vascular flow information for the entire retinal thickness. The overall FAZ measurement may be a more reliable measure of macular ischemia than FAZ size obtained for the segmented retinal vascular layers since the superficial and deep plexus connect around the FAZ.11 However, inter- and intra-instrument repeatability of the overall FAZ measurement obtained using OCTA has not been studied.
In this study, we tested the hypothesis that the overall FAZ size and FAZ size of the segmented retinal vascular layers obtained using commercial OCTA instruments with the latest software are highly repeatable regardless of the instrument used and presence of fundus pathology. We used the two different OCTA machines made by different venders and equipped with the latest software that pro-vides automated measure of the“overall FAZ”size as well as automated segmentation of the superficial and deep retinal vascular plexus layers. The two OCTA instruments used in our study include Optovue RTVue XR Avanti (Version 2018.0.0.18; Optovue, Inc., Fremont, California, USA) and Cirrus 5000HD-OCT (Version 9.5.0; Cirrus
5000HD-OCT, Angioplex; Carl Zeiss Meditec, Inc., Dublin, California, USA). Optovue OCTA uses a 840nm light source, scan rate of 70,000 A scans per second, live tracking during the scan capture, and split-spectrum ampli-tude-decorrelation angiography.12 The Cirrus OCTA uses an equivalent 840nm light source but scans at a rate of 68,000 A-scans per second and uses an optical microan-giography algorithm and retinal tracking.13Both of these machines have proprietary image processing software which may lead to subtle differences in the OCTA scans obtained.
Our study used the latest OCTA software to determine the inter- and intra-instrument repeatability of FAZ mea-surement. We evaluated various clinical factors that might affect the repeatability including image quality, image segmentation, and fundus pathology.
Patients and Methods
Study Population
This prospective study was performed in accordance with a study protocol that was approved by the University of California Davis Office of Human Research and in adher-ence to the Declaration of Helsinki for research involving human subjects. Patients seen at the University of California Davis Eye Clinic for standard of care between October 24, 2017, and April 22, 2018, were recruited if they met the study criteria. A written informed consent was obtained before study enrollment. Inclusion criteria included at least 18 years of age, best-corrected visual acuity (BCVA)≥20/200, diagnosis of retinal vasculopathy, optic disc pathology or contralateral normal eye, and the ability to undergo OCT imaging and provide written informed consent. Exclusion criteria included other con-current retinal conditions affecting vision, significant media opacity, head tremor, other factors resulting in poorfixation or head immobilization, and pregnancy.
Imaging Protocol
Each subject was imaged three times per eye on the same day after pupil dilation and a comprehensive eye examination. The imaging session lasted <30 mins. The sequence was Optovue OCTA, then Cirrus Angioplex OCTA, then Optovue OCTA (same instrument as thefirst scan). An experienced OCTA technician with certification to perform OCT imaging for clinical trials performed all of the OCTA scans. Macular OCTA scans (3 x 3 mm) were obtained centered at the fovea. All obtained OCTA images
Clinical Ophthalmology downloaded from https://www.dovepress.com/ by 118.70.13.36 on 24-Aug-2020
were reviewed for image quality. Image quality was con-sidered good if signal strength was≥6 for Optovue and≥8 for Cirrus.12,13The automated measure of the overall FAZ
size was generated using the instrument software and recorded after manually correcting for any boundary errors, if needed (Figure 1).
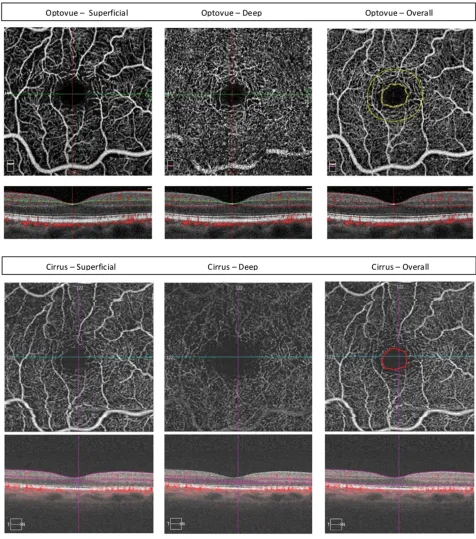
Figure 1En face optical coherence tomography angiography image (3 x 3 mm scan) of the foveal avascular zone (FAZ) of a normal eye obtained using Optovue (top) and Cirrus (Zeiss; bottom) OCTA. Enface OCTA images and the corresponding B-scan OCT/OCTA images are shown for the segmented superficial (left) and deep (middle) plexus layers showing the differences in the foveal avascular zone (FAZ) size for the segmented plexus layer between OCTA machines made by different vendors. The FAZ size for the overall retinal plexus as outlined automatically by the Optovue machine (yellow; top right) appears similar in size to that measured manually on the Cirrus image (red; bottom right).
Clinical Ophthalmology downloaded from https://www.dovepress.com/ by 118.70.13.36 on 24-Aug-2020
The FAZ size was measured manually for the superficial and deep retinal capillary plexus layers using the default automated segmentation boundaries for these layers for each machine (Figure 1). Image J (Version 1.8.0_172; National Institutes of Health, Bethesda, Maryland, USA) was used to measure FAZ size. The manual outline of the FAZ was done by one investigator (NB) and confirmed by the senior investigator (SSP) when needed. The number of pixels contained in the traced FAZ was noted, and each pixel was given an equivalent value in millimeters in order to convert it to an area (mm2).
Statistical Analysis
The statistical analysis of the data was conducted using SPSS (Version 25.0; IBM Corp, Armonk, New York, USA). A two-tailed Student’st-test was used to compare means and a Chi-square test was used to compare proportions. A p value of <0.05 was considered statistically significant. To determine repeatability, we calculated the intraclass correlation coeffi -cient (ICC), the ratio of the subject variance to the total variance (ICC of less than 0.50 is considered poor repeat-ability, 0.50 to 0.75 is moderate repeatrepeat-ability, 0.75 to 0.90 is good repeatability, and >0.90 is considered excellent repeatability).14A 95% confidence interval was included to elaborate on the precision of thefindings. Right and left eyes were analyzed separately.
Results
Demographics and Clinical Features
Table 1summarizes the demographic and clinical features of the 43 subjects (85 eyes) enrolled in this study (Total Cohort) and the subset of 47 eyes with high image quality in all three OCTA scans (Cohort A). Cohort A was of younger age and had better visual acuity in the left eye than the Total Cohort but otherwise similar. No significant difference was noted between Cohort A and Total Cohort for visual acuity of the right eye, central macular thickness (CMT) in either eye, or the prevalence of retinopathy or macular edema. The mean OCTA signal strength of the Total Cohort was 6.1 ± 2.1 for Optovue and 9.0 ± 1.4 for Cirrus. In contrast, the mean image quality of Cohort A was 6.9 ± 1.7 for Optovue and 9.6 ± 0.9 for Cirrus.Intra-Instrument Repeatability of the
Overall FAZ Measurement
The two Optovue OCTA scans were evaluated for intra-instrument repeatability of FAZ measurement. Table 2
summarizes the mean FAZ size for the right and left eyes for the Total Cohort and Cohort A. For the Total Cohort, the mean automated overall FAZ measurements were 0.315 ± 0.168 mm2 and 0.380 ± 0.312 mm2 for the right and left eyes, respectively, for thefirst Optovue OCTA scan (Scan 1) and 0.296 ± 0.132 mm2and 0.412 ± 0.316 mm2for the right and left eyes, respectively, for the second Optovue OCTA scan (Scan 3). For Cohort A, the mean automated overall FAZ measurements were 0.324 + 0.190 mm2for the right eyes and 0.415 ± 0.385 mm2for the left eyes. The mean FAZ size tended to be increased in eyes with retinal vasculopathy when compared to normal eyes (0.315 ± 0.177 mm2versus 0.272 ± 0.067 mm2), but the difference was not statistically significant (right eye: p=0.3362; left eye: p=0.3015).
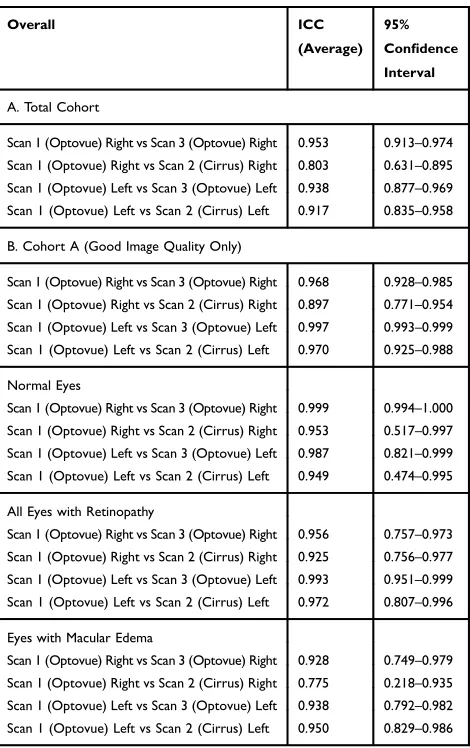
Table 3summarizes the repeatability of the FAZ surements. The ICC for the automated overall FAZ mea-surement for the right and left eye was 0.953 and 0.938, respectively, for the Total Cohort, demonstrating excellent repeatability. The ICC for the automated overall FAZ measurement for the right and left eye for Cohort A was
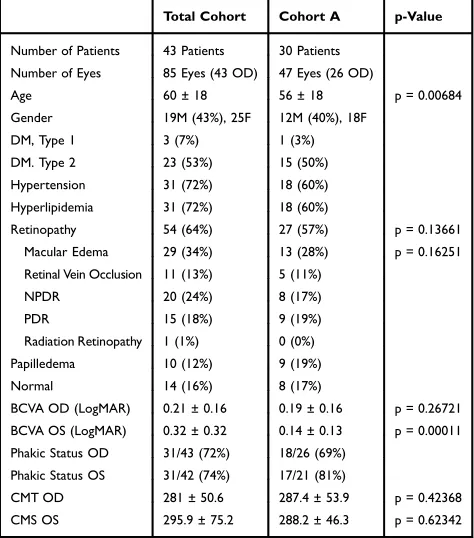
Table 1 Demographic and Clinical Features of All Enrolled Patients and Study Eyes (Total Cohort) Compared to Study Eyes with Good Quality OCTA Images (Cohort A)
Total Cohort Cohort A p-Value
Number of Patients 43 Patients 30 Patients Number of Eyes 85 Eyes (43 OD) 47 Eyes (26 OD)
Age 60 ± 18 56 ± 18 p = 0.00684
Gender 19M (43%), 25F 12M (40%), 18F
DM, Type 1 3 (7%) 1 (3%)
DM. Type 2 23 (53%) 15 (50%)
Hypertension 31 (72%) 18 (60%)
Hyperlipidemia 31 (72%) 18 (60%)
Retinopathy 54 (64%) 27 (57%) p = 0.13661
Macular Edema 29 (34%) 13 (28%) p = 0.16251
Retinal Vein Occlusion 11 (13%) 5 (11%)
NPDR 20 (24%) 8 (17%)
PDR 15 (18%) 9 (19%)
Radiation Retinopathy 1 (1%) 0 (0%)
Papilledema 10 (12%) 9 (19%)
Normal 14 (16%) 8 (17%)
BCVA OD (LogMAR) 0.21 ± 0.16 0.19 ± 0.16 p = 0.26721 BCVA OS (LogMAR) 0.32 ± 0.32 0.14 ± 0.13 p = 0.00011 Phakic Status OD 31/43 (72%) 18/26 (69%)
Phakic Status OS 31/42 (74%) 17/21 (81%)
CMT OD 281 ± 50.6 287.4 ± 53.9 p = 0.42368
CMS OS 295.9 ± 75.2 288.2 ± 46.3 p = 0.62342
Notes:A two-tailed Student’st-test was used to compare means and a Chi-square test was used to compare proportions. A p value of <0.05 was considered statis-tically significant.
Abbreviations:NPDR, nonproliferative diabetic retinopathy; PDR, proliferative diabetic retinopathy; BCVA, best-corrected visual acuity; OD, right eye; OS, left eye; CMT, central macular thickness.
Clinical Ophthalmology downloaded from https://www.dovepress.com/ by 118.70.13.36 on 24-Aug-2020
0.968 and 0.997, respectively, demonstrating repeatability which was even higher than the Total Cohort for the left eye based on the 95% confidence intervals.
Table 3 also summarizes the ICC of the overall FAZ measurement of normal eyes and eyes with retinal vasculo-pathy or macular edema. Although repeatability remained excellent for all subgroups, ICC values for the right eye were reduced in eyes with macular edema or retinal vascu-lopathy when compared to normal eyes based on 95% confidence intervals.
Inter-Instrument Repeatability of the
Overall FAZ Measurement
The automated overall FAZ measurement from the first Optovue OCTA scan was compared to that obtained using Cirrus OCTA (second scan) to determine the repeatability of FAZ measurements between OCTA machines produced by different vendors (Figure 1). Table 2 summarizes the mean automated FAZ measurement for the right and left eyes for the Total Cohort and Cohort A using Optovue and Cirrus. The difference in the mean FAZ size between Scans 1 and 2 was not statistically significant for the right and left eyes for the Total Cohort and Cohort A (p > 0.05).
The ICC values for automated overall FAZ measure-ment for the Total Cohort were 0.803 and 0.917 for the right and left eyes, respectively, demonstrating good to excellent repeatability between machines made by different vendors (Table 3). However, the ICC was reduced when compared to intra-instrument repeatability for the right eye based on the 95% confidence intervals.
For Cohort A, the ICC values were 0.897 for the right eyes and 0.970 for the left eyes, which tended to be higher
than values for the Total Cohort but not significantly different based on the 95% confidence intervals. Among normal eyes, the ICC was 0.953 and 0.949 for right and left eyes, respectively. For eyes with any retinal vasculo-pathy, the ICC was 0.925 and 0.972 for right and left eyes, respectively. Among eyes with macular edema, the ICC for the right and left eyes were 0.775 and 0.950, respec-tively [Table 3], demonstrating a trend toward a decrease in repeatability of FAZ measurements using machines from different vendors in patients with macular edema in the right eye which did not reach statistical significance based on 95% confidence intervals.
Intra-Instrument Repeatability of FAZ of
Segmented Layers
The OCTA images generated by automated segmentation of the superficial and deep retinal plexus layers using the Optovue OCTA machine were reviewed to measure the FAZ manually (Figure 1). Table 2 shows the mean FAZ size of the superficial and deep plexus of right and left eyes obtained from scan 1 and scan 3 for the Total Cohort and Cohort A. There was no significant difference in the mean FAZ size for the superficial and deep layers using the same instrument for the Total Cohort and Cohort A (p value >0.05).
Table 4 summarizes the ICC values and 95% confi -dence interval for the manually obtained FAZ measure-ment of the superficial and deep plexus layers. The ICC values for the manual FAZ measurement of the superficial and deep retinal plexus layers of the right eyes were 0.972 and 0.995, respectively. The ICC values for the FAZ measurements of the left eyes were 0.951 for the
Table 2Mean Foveal Avascular Zone (FAZ) Measurement (mm2) for the Total Cohort (A) and Cohort A with Good Quality OCTA Images (B)
Scan Automated
Right (Mean ± SD)
Automated Left (Mean ± SD)
Manual Right Superficial (Mean ± SD)
Manual Right Deep (Mean ± SD)
Manual Left Superficial (Mean ± SD)
Manual Left Deep (Mean ± SD)
A. Total Cohort
Scan 1 (Optovue) 0.315 ± 0.168 0.380 ± 0.312 0.623 ± 0.241 0.346 ± 0.157 0.702 ± 0.396 0.447 ± 0.325 Scan 2 (Cirrus) 0.358 ± 0.239 0.476 ± 0.615 0.420 ± 0.281 1.07 ± 0.714 0.538 ± 0.480 1.03 ± 0.492 Scan 3 (Optovue) 0.296 ± 0.132 0.412 ± 0.316 0.615 ± 0.247 0.357 ± 0.196 0.735 ± 0.419 0.430 ± 0.330
B. Cohort A (Good Image Quality Only)
Scan 1 (Optovue) 0.324 ± 0.190 0.415 ± 0.385 0.581 ± 0.241 0.343 ± 0.167 0.780 ± 0.480 0.486 ± 0.395 Scan 2 (Cirrus) 0.326 ± 0.203 0.467 ± 0.369 0.371 ± 0.221 1.05 ± 0.779 0.610 ± 0.565 1.00 ± 0.446 Scan 3 (Optovue) 0.312 ± 0.146 0.440 ± 0.382 0.611 ± 0.272 0.373 ± 0.223 0.813 ± 0.513 0.473 ± 0.412
Clinical Ophthalmology downloaded from https://www.dovepress.com/ by 118.70.13.36 on 24-Aug-2020
superficial plexus, and 0.991 for the deep plexus. This demonstrates very high intra-instrument repeatability of manually obtained FAZ measurement of the segmented layers.
Inter-Instrument Repeatability of FAZ of
Segmented Layers
The OCTA images of superficial and deep retinal vas-cular plexuses generated by the first and second OCTA scans were used to measure the FAZ of the segmented layers manually. Mean values for the FAZ measurement obtained using Optovue and Cirrus OCTA are summar-ized in Table 2. For the superficial plexus layer, the mean FAZ measurement using Optovue tended to be larger than that obtained using Cirrus OCT but the difference was not statistically significant (p = 0.1983). For the deep retinal plexus, the mean FAZ measurement obtained using Cirrus tended to be larger than that obtained using Optovue but was not statistically signifi -cant (p = 0.163; Figure 1).
Table 4 summarizes the ICC of FAZ measurement of the segmented layers using different instruments. The right eye showed ICC values of 0.860 for the superficial layer and 0.574 for the deep layer, while the left eye ICC was 0.877 for the superficial and 0.633 for the deep layer. A decrease in the repeatability of the FAZ measurement between instruments of different vendors was noted which was significant for the deep retinal vascular plexus layer based on the 95% confidence intervals.
Discussion
Optical coherence tomography angiography has become a useful tool to evaluate the FAZ in clinical practice by providing 3-dimensional imaging of retinal blood flow around the FAZ.4 Accurately measuring the FAZ size is important in assessing macular ischemia that may contribute to vision loss. Thus, in this study, we evaluate factors that may affect repeatability of FAZ measurement using OCTA. We compared inter-instrument and intra-instrument
Table 3Intra- and Inter-Instrument Repeatability of Automated Measurement of Overall Foveal Avascular Zone (FAZ) Size in (A) Total Cohort; (B) Cohort A (Good Image Quality)
Overall ICC
(Average) 95% Confidence Interval
A. Total Cohort
Scan 1 (Optovue) Right vs Scan 3 (Optovue) Right 0.953 0.913–0.974 Scan 1 (Optovue) Right vs Scan 2 (Cirrus) Right 0.803 0.631–0.895 Scan 1 (Optovue) Left vs Scan 3 (Optovue) Left 0.938 0.877–0.969 Scan 1 (Optovue) Left vs Scan 2 (Cirrus) Left 0.917 0.835–0.958 B. Cohort A (Good Image Quality Only)
Scan 1 (Optovue) Right vs Scan 3 (Optovue) Right 0.968 0.928–0.985 Scan 1 (Optovue) Right vs Scan 2 (Cirrus) Right 0.897 0.771–0.954 Scan 1 (Optovue) Left vs Scan 3 (Optovue) Left 0.997 0.993–0.999 Scan 1 (Optovue) Left vs Scan 2 (Cirrus) Left 0.970 0.925–0.988 Normal Eyes
Scan 1 (Optovue) Right vs Scan 3 (Optovue) Right 0.999 0.994–1.000 Scan 1 (Optovue) Right vs Scan 2 (Cirrus) Right 0.953 0.517–0.997 Scan 1 (Optovue) Left vs Scan 3 (Optovue) Left 0.987 0.821–0.999 Scan 1 (Optovue) Left vs Scan 2 (Cirrus) Left 0.949 0.474–0.995 All Eyes with Retinopathy
Scan 1 (Optovue) Right vs Scan 3 (Optovue) Right 0.956 0.757–0.973 Scan 1 (Optovue) Right vs Scan 2 (Cirrus) Right 0.925 0.756–0.977 Scan 1 (Optovue) Left vs Scan 3 (Optovue) Left 0.993 0.951–0.999 Scan 1 (Optovue) Left vs Scan 2 (Cirrus) Left 0.972 0.807–0.996 Eyes with Macular Edema
Scan 1 (Optovue) Right vs Scan 3 (Optovue) Right 0.928 0.749–0.979 Scan 1 (Optovue) Right vs Scan 2 (Cirrus) Right 0.775 0.218–0.935 Scan 1 (Optovue) Left vs Scan 3 (Optovue) Left 0.938 0.792–0.982 Scan 1 (Optovue) Left vs Scan 2 (Cirrus) Left 0.950 0.829–0.986
Table 4Intra- and Inter-Instrument Repeatability of Foveal Avascular Zone (FAZ) Size for Segmented Superficial and Deep Retinal Vascular Layers
Manual FAZ Measurements ICC (Average) 95% Confidence Interval
Scan 1 (Optovue) Right (Superficial) vs Scan 3 (Optovue) Right (Superficial) 0.972 0.938–0.987 Scan 1 (Optovue) Right (Superficial) vs Scan 2 (Cirrus) Right (Superficial) 0.860 0.381–0.953 Scan 1 (Optovue) Right (Deep) vs Scan 3 (Optovue) Right (Deep) 0.995 0.989–0.998 Scan 1 (Optovue) Right (Deep) vs Scan 2 (Cirrus) Right (Deep) 0.574 0.098–0.807 Scan 1 (Optovue) Left (Superficial) vs Scan 3 (Optovue) Left (Superficial) 0.951 0.881–0.980 Scan 1 (Optovue) Left (Superficial) vs Scan 2 (Cirrus) Left (Superficial) 0.877 0.409–0.961 Scan 1 (Optovue) Left (Deep) vs Scan 3 (Optovue) Left (Deep) 0.991 0.978–0.996 Scan 1 (Optovue) Left (Deep) vs Scan 2 (Cirrus) Left (Deep) 0.633 0.014–0.867
Abbreviation:ICC-interclass correlation coefficient.
Clinical Ophthalmology downloaded from https://www.dovepress.com/ by 118.70.13.36 on 24-Aug-2020
repeatability and evaluated the effects of image segmenta-tion, image quality, and fundus pathology on FAZ measure-ment repeatability.
It is important to note that commercial OCT instru-ments have developed software for OCTA that vary among vendors. In an earlier study comparing the reproducibility of vessel density and FAZ measurements among seven different commercial OCTA instruments, significant differ-ences among machines were noted for FAZ measurement of both the superficial and deep plexus layers.6The study’s findings raised concerns about repeatability of OCTA para-meters, including FAZ measurement, using various com-mercial OCTA instruments. Similarly, Magrath et al compared FAZ measured using two instruments, Optovue RTVue XR Avanti and Zeiss Cirrus HD-OCT 5000, for the superficial and deep plexus layers and found inter-instrument differences in the FAZ measurement for both layers although no significant intra-instrument difference was noted.5 Both studies evaluated only healthy eyes. Neither study evaluated the repeatability of the automated overall FAZ measurement which was not available with the older versions of the OCTA software.
Recent software upgrades to OCTA instruments could potentially improve the reproducibility of the quantitative parameters including FAZ measurement. Our study eval-uated the repeatability of FAZ measurements obtained using two different commercial OCTA instruments with the latest software that provide an automated measurement of the overall FAZ, ie, FAZ size for the total retinal thickness. By limiting the study to 2 different commercial OCT instruments, we limited the number of OCT scans obtained per subject and limited potential fatigue that might affect repeatability. We included eyes with fundus pathology (retinal vasculopathy and macular edema) and contralateral normal eyes to access the impact of retinal pathology on repeatability of FAZ measurement. In order to evaluate the effect of image quality on repeatability of FAZ measurement, we analyzed the Total Cohort and compared the findings to Cohort A which included eyes with high-quality OCTA images. In our study, we obtained intra-instrument repeatability for Optovue OCTA since the software to measure overall FAZ size is commercially available. We did not measure intra-instrument repeatabil-ity for Cirrus OCTA since the software is only available for research at the current time.
We noted high inter and intra-instrument repeatability of the automated overall FAZ measurement in normal and pathologic eyes. Although the inter-instrument ICC
dropped slightly for the right eyes with macular edema, repeatability remained relatively good overall and only mildly affected by image quality or fundus pathology. This is an importantfinding since the two OCTA instru-ments used in our study use different software algorithms to generate OCTA images.
In contrast, when the repeatability of FAZ measure-ment for the segmeasure-mented superficial and deep retinal plexus layers was compared, intra-instrument repeatability remained high but inter-instrument repeatability decreased, especially for the deep retinal plexus layer. For the latter, ICC values of 0.574 and 0.633 for right and left eyes, respectively, were noted. Furthermore, a trend toward an inter-instrument difference in the mean FAZ size was noted when FAZ size was measured for the superficial and deep plexus layers (Table 2). The inter-instrument difference in mean FAZ size likely resulted from differ-ences in the software algorithms used to segment the superficial and deep retinal layers since the overall FAZ size was not significantly different between OCTA instru-ments. For the Optovue OCTA, the superficial retinal vascular plexus segmentation has an upper limit that is the internal limiting membrane (ILM), and lower limit that is the inner plexiform layer (IPL)−10µm1.12In the Cirrus OCTA machine, the superficial layer is defined as the layer with an upper limit of the ILM, and a lower limit of the IPL2.13This means that there is an inherent 10-µm differ-ence in the segmentation of the superficial retinal vascular plexus between the two OCTA machines. Furthermore, the deep retinal vascular layer is segmented in the Optovue machine from the IPL−10µm to the outer plexiform layer (OPL) +10µm.12 In the Cirrus machine, the deep retinal vascular layer is the IPL to the OPL2.13This adds another layer of variability in segmentation of the deep vascular plexus between OCTA instruments.
Finally, there was an overall trend for the right eye to have lower ICC for inter-instrument repeatability of FAZ measurement when compared to the left eye. This may be related to subtle differences in the way the eyes are posi-tioned for OCTA imaging between machines made by different vendors.
Three prior studies compared mean FAZ size for the superficial and deep plexus layers using two or three different OCTA devices, including Optovue RTVue XR Avanti, Spectralis HRA, Nidek RS-3000, Topcon Triton and Zeiss Cirrus.5,9,10 These studies noted good intra-instrument repeatability of the FAZ size but significant inter-instrument differences in the FAZ size for both the
Clinical Ophthalmology downloaded from https://www.dovepress.com/ by 118.70.13.36 on 24-Aug-2020
SCP and DCP. They did not compare the overall FAZ size between instruments and concluded that the inter-instrument differences in FAZ size result from differences in image resolution resulting from differences in the OCTA software among OCTA vendors. In our study, since the inter-instrument repeatability of the overall FAZ size is relatively good unlike the reduced repeatability of the segmented superficial and deep retinal vascular layers, most of the inter-instrument differences between Optovue and CIrrus OCTA likely resulted from differences in seg-mentation of the retinal vascular layers. Some uniformity in segmentation of the superficial and deep plexus layers among OCTA instruments might improve repeatability of OCTAfindings among commercial OCTA instruments.
The importance of accurately segmenting the deep retinal plexus layer on OCTA in quantifying the degree of retinal non-perfusion is highlighted in a recent report that correlated vision loss associated with diabetic retino-pathy with changes in the deepest plexus layer on OCTA.11 Although commercial OCTA instruments sepa-rate the retinal vascular plexus into two layers, detailed OCTA studies demonstrated three separate plexus layers, ie, superficial, intermediate and deep capillary plexus.4,15 Both OCTA and histological studies correlated changes in the deepest retinal capillary plexus with severity of dia-betic retinopathy.11,16 Thus, poor repeatability of FAZ measurements of the deep retinal vascular layer among OCTA instruments may limit our ability to accurately access subtle changes in the FAZ in the deep retinal vascular layer that could impact vision. Based on our study findings, it would be important to use the same OCTA machine longitudinally in accessing changes in the FAZ for the segmented plexus layers.
Although the commercial OCTA instruments used in our study provide automated measurements of the overall FAZ size, they do not provide an automated measurement of the FAZ size for the superficial and deep retinal vascu-lar layers. Since the two plexus layers around the fovea form a single anatomic vascular ring, FAZ size for the two plexus layers may not need to be distinguished in normal eyes.11 In pathologic eyes, this may not be the case. Detailed analysis of the FAZ for the segmented retinal plexus layers may be important to assess fully the degree of macular ischemia. Our study highlights the effect of heterogeneity among commercial OCTA segmentation software developed by various vendors, which can yield apparent difference in the FAZ size of the segmented retinal plexus layers, especially the deep vascular plexus.
The strengths of our study are the prospective design, the latest version of OCTA software used for two popular commercial OCTA instruments, and experienced OCT technicians acquiring data. Our study included eyes with relatively good vision for optimalfixation; only 3 x 3 mm macular OCTA scans were studied to maximize image resolution. All these factors likely contributed to high intra- and inter-instrument repeatability of the overall FAZ measurement noted in our study. In fact, the mean OCTA image quality was high for the Total Cohort for our study although a significant portion of study eyes had one or more suboptimal quality OCTA images that resulted in exclusion from Cohort A subanalysis. This is important since two recent studies showed that OCTA image quality can affect reliability of OCTA quantitative measures.17,18
Our study has some limitations as well. We limited our inter-instrument repeatability to two instruments and intra-instrument analysis to one intra-instrument. Thus, our study findings may not be applicable to OCTA instruments made by other vendors. Secondly, we enrolled eyes with varied fundus pathologies which may increase heterogene-ity in our study population. Nonetheless, the effect of fundus pathology on repeatability of FAZ measurement was relatively small in our study population.
To our knowledge, this is thefirst study comparing the intra- and inter-instrument repeatability of the FAZ measure-ment of the overall retinal layers and the segmeasure-mented super-ficial and deep plexus layers in eyes with fundus pathology. We used Optovue and Cirrus OCTA machines equipped with the latest OCTA software in order to optimize repeatability. This study highlights the excellent repeatability of the overall FAZ measurement even between machines made by different vendors. However, when evaluating FAZ size of the segmen-ted retinal vascular layers, especially the deep vascular layer, there should be some caution when comparing images obtained from machines made by different vendors.
Conclusion
The overall FAZ size obtained using OCTA is highly repea-table even when using OCTA instruments made by different vendors, namely Optovue and Cirrus. However, FAZ size of the superficial and deep retinal plexus layers may vary between instruments made by different vendors, likely due in part to differences in segmentation of these layers.
Acknowledgments
The authors thank the imaging team at the University of California Davis Eye Center for obtaining the OCTA
Clinical Ophthalmology downloaded from https://www.dovepress.com/ by 118.70.13.36 on 24-Aug-2020
images for this study. The authors also thank Dr. Melinda Chang for her help with study enrollment and Optovue and Zeiss for providing the software.
Disclosure
Susanna S Park reports grants from Allergan, Roche/ Novartis, and Graybug, outside the submitted work. The authors report no other conflicts of interest in this work.
References
1. Schwartz DM, Fingler J, Kim DY, et al. Phase-variance optical coherence tomography: a technique for noninvasive angiography.Ophthalmology. 2014;121(1):180–187. doi:10.1016/j.ophtha.2013.09.002
2. Spaide RF, Klancnik JM, Cooney MJ. Retinal vascular layers imaged by fluorescein angiography and optical coherence tomography angiography. JAMA Ophthalmol. 2015;133(1):45–50. doi:10.1001/ jamaophthalmol.2014.3616
3. Lee MW, Kim KM, Lim HB, et al. Repeatability of vessel density measurements using optical coherence tomography angiography in retinal diseases.Br J Ophthalmol.2018..
4. Kim DY, Fingler J, Zawadzki RJ, et al. Noninvasive imaging of the foveal avascular zone with high-speed phase-variance optical coher-ence tomography. Invest Ophthalmol Vis Sci. 2012;53(1):85–92. doi:10.1167/iovs.11-8249
5. Magrath GN, Say EAT, SioufiK, et al. Variability in foveal avascular zone and capillary density using optical coherence tomography angio-graphy machines in healthy eyes. Retina. 2017;37:2101–2111. doi:10.1097/IAE.0000000000001458
6. Corvi F, Pellegrini M, Erba S, et al. Reproducibility of vessel density, fractal dimension, and foveal avascular zone using 7 different optical coherence tomography angiography devices. Am J Ophthalmol. 2018;186:25–31. doi:10.1016/j.ajo.2017.11.011
7. Zhao Q, Yang WL, Wang XN, et al. Repeatability and reproducibility of quantitative assessment of the retinal microvasculature using optical coherence tomography angiography based on optical microangiography.
Biomed Environ Sci.2018;31(6):407–412. doi:10.3967/bes2018.054
8. Lin A, Fang D, Li C, Cheung CY, Chen H. Reliability of foveal avascular zone metrics automatically measured by Cirrus optical coher-ence tomography angiography in healthy subjects.Int Ophthalmol. 2019. doi:10.1007/s10792-017-01238
9. Pilotto E, Frizziero L, Crepaldi A, et al. Repeatability and reprodu-cibility of foveal avascular zone area measurement on normal eyes by different optical coherence tomography angiography instruments.
Ophthalmic Res.2018;59(4):206–211. doi:10.1159/000485463 10. Shiihara H, Sakamoto T, Yamashita T, et al. Reproducibility and
differences in area of foveal avascular zone measured by three different optical coherence tomographic angiography instruments.
Sci Rep.2017;7(1):9853. doi:10.1038/s41598-017-09255-5 11. Dupas B, Minvielle W, Bonnin S, et al. Association between vessel
density and visual acuity in patients with diabetic retinopathy and poorly controlled type 1 diabetes. JAMA Ophthalmol. 2018;136 (7):721–728. doi:10.1001/jamaophthalmol.2018.1319
12. Optovue. Optovue avanti angiovue: user manual; 2018. Available from:https://www.optovue.com/octa. Accessed March 25, 2020. 13. Zeiss. Zeiss cirrus OCTa with angioplex: user manual;2018. Available
from: https://www.zeiss.com/meditec/int/products/ophthalmology-optometry/glaucoma/diagnostics/oct/oct-optical-coherence-tomography /cirrus-oct-with-angioplex.html#downloads. Accessed March 25, 2020. 14. Koo TK, Mae YL. A guideline of selecting and reporting intraclass correlation coefficients for reliability research. J Chiropr Med. 2016;15:55–163. doi:10.1016/j.jcm.2016.02.012
15. Garrity ST, Iafe NA, Phasukkijwatana N, et al. Quantitative analysis of three distinct retinal capillary plexuses in healthy eyes using optical coherence tomography angiography. Invest Ophthalmol Vis Sci.2017;58:5548–5555. doi:10.1167/iovs.17-22036
16. Bek T. Transretinal histopathological changes in capillary-free areas of diabetic retinopathy. Acta Ophthalmol (Copenh). 1994;72:409–415. doi:10.1111/j.1755-3768.1994.tb02787.x
17. Lee TH, Bin Lim H, Nam KY, Kim K, Kim JY. Factors affecting repeatability of assessment of the retinal microvasculature using optical coherence tomography angiography in healthy subjects.Sci Rep.2019;9(1):16291. doi:10.1038/s41598-019-52782-6
18. Czako C, Istvan L, Ecsedy M, et al. The effect of image quality on the reliability of OCT angiography measurements in patients with diabetes. Int J Retina Vitreous. 2019;5(1):46. doi:10.1186/s40942-019-0197-4
Clinical Ophthalmology
Dove
press
Publish your work in this journal
Clinical Ophthalmology is an international, peer-reviewed journal cover-ing all subspecialties within ophthalmology. Key topics include: Optometry; Visual science; Pharmacology and drug therapy in eye dis-eases; Basic Sciences; Primary and Secondary eye care; Patient Safety and Quality of Care Improvements. This journal is indexed on PubMed
Central and CAS, and is the official journal of The Society of Clinical Ophthalmology (SCO). The manuscript management system is completely online and includes a very quick and fair peer-review system, which is all easy to use. Visit http://www.dovepress.com/ testimonials.php to read real quotes from published authors.
Submit your manuscript here:https://www.dovepress.com/clinical-ophthalmology-journal
Clinical Ophthalmology downloaded from https://www.dovepress.com/ by 118.70.13.36 on 24-Aug-2020