United Kingdom ISSN 2348 0386 Vol. VII, Issue 11, November 2019
Licensed under Creative Common Page 1
http://ijecm.co.uk/
FOREIGN OWNERSHIP AND BANK EFFICIENCY: EVIDENCE FROM
VIETNAM USING TWO-STAGE DEA BOOTSTRAP APPLICATION
Thi Khanh Trang, Nguyen
Lecturer, Faculty of Finance and Banking, College of Economics, Hue University, Vietnam Ph.D. Candidate, Graduate School of Economics, Tokyo International University, Japan
Abstract
This study aims to examine the relationship between foreign ownership and the efficiency of
banks. Foreign ownership is examined not only in foreign banks but also through foreign stakeholders’ shares in domestic banks. Therefore, the study contributes to the literature in
terms of taking into account the degree of foreign ownership in the capital structure to analyze
the relationship between ownership and the management of banks. The method, Two-stage
DEA bootstrap of Simar and Wilson (2007), is applied to a panel dataset of 27 Vietnamese
banks for the period from 2009 to 2016. The results indicate that foreign ownership has a
positive effect on bank performance. In particular, the higher the share that foreign investors
hold in banks over the total capital, the better banks perform. In addition, bank size,
concentration level, diversification, risk, Cost Over Assets ratio (COA), as well as GDP,
determine bank efficiency. One of the critical policy implications from the study is that the
policymaker should consider extending the current maximum degree of foreign ownership in any
local bank in order to achieve a better banking performance.
Keywords: Vietnamese banks, efficiency, foreign ownership, DEA, bootstrapping regression
INTRODUCTION
Licensed under Creative Common Page 2 growth and development, recent studies focusing on the effect of foreign ownership on banking performance are numerous. The previous studies mainly focused on examining this relationship by comparing bank efficiency based on different ownership status and had mixed results. The positive effect was found in some studies of Berger et al. (2000), Jemric and Vujcic (2002), Sturm and Williams (2004), Fries and Taci (2005), Lin and Zhang (2009), Sanyal and Shankar (2011), and Shaban and James (2018) while an opposite trend was observed by others (Zajc, 2006; Lensink and Naaborg, 2007; Micco, Panizza and Yanez 2007; Cornett et al., 2010; Manovo, and Vernikov, 2017; Dinh, Fung, and Jia, 2019). In general, previous studies have concentrated on mainly only foreign banks’ performance. However, the role of foreign ownership in banking performance is also presented through foreign shareholders in the domestic banks. In other words, the effect of ownership structures on banks’ performance has not been explored sufficiently.
Regarding the methodology, the non-parametric method, traditional Two-Stage Data Envelopment Analysis, is one of the most popular techniques for banking efficiency analysis. However, this method has limitations that might lead to bias estimation. In detail, in the traditional two-stage method, the efficiency scores estimated in the first stage will be the dependent variable for the second stage regression (Tobit like). In this process, these estimated efficiency scores are treated as independent observations. Thus, it leads to the problem of invalid inference caused by serial correlation.
The study applies the method procedure proposed by Simar and Wilson (2007) to a panel data set of 27 commercial banks for the period from 2009 to 2016 in Vietnam in order to examine the relationship between foreign ownership and banking performance. The study contributes to the literature in several ways. First, using a more precise variable represented for the ownership of banks, particularly to the foreign share of capital instead of a dummy variable, the study provides a more comprehensive and sufficient overview of the relationship of ownership structure and banks’ operational efficiency. In detail, the study examines the effect of foreign ownership not only through the foreign banks’ business but also their stake holdings in local banks. Thus, it provides a better overview of the role of foreign investors in the banking market by catching up on the degree of foreign ownership in banks' capital structures. Second, the Two-Stage DEA Bootstrap method of Simar and Wilson (2007), which is applied to determine factors that affect bank efficiency, is expected to provide a more reliable result since it overcomes the drawbacks of the traditional Two-Stage DEA method. Lastly, implications for achieving a better financial system in terms of technical efficiency are obtained.
Licensed under Creative Common Page 3 the banking industry in particular of the country, has experienced transformations along with economic development. For instance, regarding the entry of foreign investors in the banking market, Vietnam, which is not out of the globalization trend, opened its door to foreign investors to establish their business in the banking industry since the early 1990s. The foreign participants first opened their branches or set up joint venture banks with local banks. The first wholly-foreign bank had a permit to establish under the governmental Decree 22/2006/ND-CP after the accession to the WTO in 2007. From the first foreign bank, HSBC, currently there are seven foreign-owned banks in the market. Besides, the presence of foreign ownership is also observed through the capacity of taking their stakes in domestic banks as strategic partnerships. According to the current regulations, the degree of foreign ownership in any local bank is limited to 30 percent; the limit is 20 percent for a strategic stakeholder in local bank capital structure and is only 15 percent for a non-strategic partner for the regions as well as other transition and developing markets. Moreover, the period of 2009-2016 is the time when Vietnam has witnessed changes in the banking system since it covers the period of the restructuring program implementation. According to that reform, the government encouraged local banks' self-restructurings or merger and acquisition activities. The entry of foreign ownership into the financial market has been taken place in many developing countries. Analyzing the Vietnamese case is expected to reveal beneficial information and policy implications.
The structure of this paper is as follows. After the introduction part, the paper continues with section 2, which summarizes the literature on bank performance in particular to the effect of foreign ownership on bank efficiency. Following that, section 3 describes in detail the methodological process recommended by Simar and Wilson (2007), which is applied in the study. Finally, sections 4 and 5 provide the main findings and conclusions of the study, respectively.
RELATED LITERATURE REVIEW
Licensed under Creative Common Page 4 the bank performance in developing countries, evidence which confirms the superiority of foreign banks in the operating efficiency was found on Berger et al. (2000), Jemric and Vujcic (2002), Sturm and Williams (2004), Fries and Taci (2005), Lin and Zhang (2009), Micco, Panizza and Yanez (2007), and Cornett et al. (2010). For instance, Fries and Taci (2005) applied SFA to examine banking efficiency in 15 transition countries. It showed that foreign banks have a higher cost efficiency than local banks. Similarly, Sanyal and Shankar (2011), Ferri (2009), Lin and Zhang (2009) observed the same trend for the cases of Indian and Chinese banking market. Recently, in the study of Shaban and James (2018), SFA and Tobit regression were used to investigate the effect of ownership change on banks' efficiency of 60 Indonesian commercial banks from 2005 to 2012. It revealed that private and foreign banks are more efficient than state-owned banks in terms of profit-making. A bank is considered as a foreign bank if the total capital share of foreign investors accounted for at least 50.01%, a dummy variable is presented to define the foreign ownership in the model. On the other hand, the fact that foreign banks are less efficient than other groups was found in the studies of Zajc (2006), Lensink and Naaborg (2007), Manovo and Vernikov (2017). In this case, the reasons for that observation can be explained by the “home field advantage” hypothesis. This hypothesis states that the local banks have benefits coming from the vast business network as well as the regulation. Similarly, Claessens and Van Horen (2012) found a negative effect of foreign ownership on bank performance. The very recent study (Dinh, Fung, and Jia, 2019) indicated a lower level of profit and cost efficiency of foreign banks compared to the other counterparts.
Licensed under Creative Common Page 5 restructuring on bank performance. In addition, foreign banks perform better than local banks, while the state-owned banks achieve a higher efficiency level than private banks. This study has focused on the role of ownership in banks’ operations. However, once again, it used ownership dummy variables in order to distinguish between different ownership statuses of banks among domestic state, domestic private or foreign ownership. Thus, the degree of foreign ownership has not been taken into account.
Regarding the methodology, the non-parametric method, DEA has been the most popular method in efficiency evaluation studies, thus, it has been applied worldwide with a variety of applications (Mansour and Moussawi, 2019). Recently, the method suggested by Simar and Wilson (2007) has been recognized as an advanced approach for efficiency evaluation researches. The serial correlation among DEA efficiency scores is mentioned as a serious problem coming from the traditional two-stage method (Xue and Harker, 1999; Hirschberg and Lloyd, 2002; Simar and Wilson, 2007). Sufian (2016) recently examined the Malaysian banking sector more focusing on the link between foreign ownership and banks' efficiency by applying this advanced method. It found out that it is a positive effect. However, Sufian (2016) also considered only foreign banks while using a dummy variable to define foreign ownership as most of the previous studies did.
Briefly, the previous studies have mainly focused on the operations of foreign banks while analyzing the impact of foreign ownership on the banks’ efficiency. Thus, there is a lack of evidence which has taken into account the partial foreign ownership banks. In general, partial foreign ownership is not a new trend rather than a common situation in the banking industry, especially for the cases of developing countries. Moreover, in most of the previous cases, the variable represented for the foreign ownership in the regression model is a dummy variable, which will be equal to 1 when a bank is considered as foreign bank and 0 otherwise. Specifying the foreign ownership in this way leads to a lack of understanding about the degree of foreign ownership and have ignored the presence of foreign ownership through their stake holding in the local banks.
Licensed under Creative Common Page 6 experienced a decreasing trend since partial acquisition. Public listing effects on the efficiency of banks are not statistically significant. However, none of these papers has examined the role of foreign ownership, particularly to the foreign share in Vietnam’s banking system. Thus, the literature related to the performance of banks in Vietnam has not investigated the role of foreign ownership sufficiently. The presence of foreign ownership in the Vietnamese financial market not only through the foreign bank but also in the domestic bank has been increased, especially after joining WTO in 2007. Therefore, the effect of foreign ownership on the operations of banks in Vietnam has not been analyzed comprehensively.
To sum up, the change in the ownership structure of banks has taken place more intensively not only in Vietnam but also in other developing countries. Partial-foreign ownership has been a common trend in the financial market. Although the effect of foreign ownership on the performance of banks has been initially explored by examining the operation of foreign banks, the impact of foreign ownership through their participation in other domestic banks has been unknown. Therefore, the role of foreign ownership over the efficiency of banks should be considered sufficiently by analyzing the partial-foreign banks.
METHODOLOGY
Research Design and Model Specification
As can be seen from the literature, the stochastic frontier approach (SFA) and data envelopment analysis (DEA) are the two main methods applied in numerous efficiency evaluation studies. Related to the banking industry SFA was used in Fries and Taci (2005), Yao et al. (2007), Jiang, Yao, and Zhang (2009), Sun and Chang (2011). However, there are arguments that DEA is a more robust method to investigate the efficiency of financial institutions. For instance, the benefits of DEA come from the fact that DEA requires fewer assumptions while in SFA, the functional form of production function has to be specified. Therefore, using DEA instead of SFA leads to a low chance of misspecifications (Davidova and Latruff, 2007; Khan, Ali, and Khan, 2018). In addition, since DEA can be applied for various combinations of multiple inputs and outputs, this methodology is suitable for various efficiency studies among different sectors, countries as well as other economic entities. As a result, DEA has become a preferred method in terms of efficiency evaluation (Sufian and Habibullah, 2011; Hou, Wang, and Zhang, 2014).
Licensed under Creative Common Page 7 Two-Stage method. First, dependent variables in a DEA model are unobserved and are replaced by the estimated value. Second, the estimated efficiency scores used in the second stage might be correlated serially. The third is that the correlation between the error term of estimated DEA efficiency variables in the first stage and other environmental variables in the second step exists. Taking all of these issues, the conventional Two-Stage DEA might violate the required basic regression model assumptions. The study applies the DEA bootstrap method of Simar and Wilson (2007), which overcomes the problems mentioned above. The method’s basic idea is based on a data-generating-process in order to improve statistical efficiency in the second-stage regression. The applications of the technique proposed by Simar and Wilson (2007) are various among sectors. As for banking efficiency studies, the evidence of using this advanced method are found on Okuda and Aiba (2015), Assaf, Barros, and Matousek (2011), Chortareas, Girardone, and Ventouri (2013), Stewart, Matousek, and Nguyen (2016), Wanke, and Barros (2014), Brissimis, Delis, and Papanikolaou (2008), Zhang and Matthews (2012), Kenjegalieva, Simper, and Weyman-Jones (2009), See and He (2015), Sufian (2016).
In detail, as for the estimating process of the method, Simar and Wilson (2007) provide two procedures, which are algorithm 1 and algorithm 2 considered as single bootstrap and double bootstrap method for efficiency study, respectively. Although both of these two procedures are expected to give better estimations than the traditional Two-Stage DEA, based on the Monte Carlo experiments’ results, it is suggested that we would prefer the use of algorithm 2 to the algorithm 1 (Simar and Wilson, 2007). Therefore, this study applies the method proposed by Simar and Wilson (2007), in particular, algorithm 2. The process of the methodology, which is used in this study, is described as follows.
Let’s assume the model is that 𝛾𝑖𝑡 = 𝑓 𝑧𝑖𝑡 𝛽 = 𝛽𝑧𝑖𝑡+ 𝑢𝑖𝑡
Where, 𝛾𝑖𝑡 is the technical efficiency of bank i in the year t, 𝑧𝑖𝑡 is the vector of environmental
variables as determinants of bank efficiency, and 𝑢𝑖𝑡 is the error term.
Step 1: In the first stage, the technical efficiency 𝛾 of each bank is obtained each year by employing an input-oriented DEA model for the case of variable return to scale assumption (see Banker, Charnes and Cooper, 1994).
Step 2: The study obtains the estimator 𝛽 of 𝛽 in the regression of 𝛾𝑖𝑡 on environmental
variables 𝑧𝑖𝑡 in the model by using the maximum likelihood method. The value of the
estimator𝜎 of𝜎 is also obtained from this truncated regression process.
Step 3: Loop the next steps from a to c N1 times to get the bootstrap-replication set 𝑅1= 𝛽 𝑏∗, 𝜎 𝑏∗ 𝑏=1
Licensed under Creative Common Page 8 a. For each of bank within the sample, i=1,…,m, from the normal distribution
𝑁 0, 𝜎 𝑢2 with bilateral truncation at −𝑧𝑖𝑡𝛽 and1 − 𝑧𝑖𝑡𝛽 draw 𝑢𝑖𝑡∗
b. For each of bank i=1, …,m, again calculate 𝛾𝑖∗= 𝑧𝑖𝑡𝛽 + 𝑢1𝑖∗
c. Set 𝑥𝑖∗= 𝑥𝑖 𝑎𝑛𝑑 𝑦𝑖∗= 𝑦𝑖𝛾 𝑖/𝛾𝑖∗ in order to create a pseudo data set, where
i=1,…,m.
d. Base on the data set in section c, calculate 𝛾 𝑖∗ which is considered as the bootstrap estimation of technical efficiency score by replacing X, Y with [𝑥1∗, … , 𝑥𝑖∗]
and [𝑦1∗, … , 𝑦𝑖∗], respectively.
Step 4: Calculate the value of 𝑦 𝑖 which is the bias-corrected estimate for each bank
where 𝑦 𝑖 = 𝑦 𝑖− 𝑏𝑖𝑎𝑠𝑖 and 𝑏𝑖𝑎𝑠𝑖 is the bootstrap estimate of bias.
Step 5: Again, apply maximum likelihood method for the truncated regression of the
bias-corrected estimate (𝑦 𝑖) on the environmental variables(𝑧𝑖) in order to obtain (𝛽 , 𝜎 ).
Step 6: The next three steps [6.a-6.c] are repeated N2 time, yielding a bootstrap estimate
set 𝑅2= 𝛽 𝑏∗, 𝜎 𝑏∗ 𝑏=1 𝑁2
a. For each of bank within the sample, i=1,…,m, from the normal distribution 𝑁(0, 𝜎 𝑢2) with
bilateral truncation at −𝑧𝑖𝑡𝛽 and1 − 𝑧𝑖𝑡𝛽 draw 𝑢𝑖𝑡∗.
b. Calculate 𝛾𝑖∗∗= 𝑧𝑖𝑡𝛽 + 𝑢𝑖 for each bank, i=1,…,m.
c. Apply the maximum likelihood method to the truncated regression of 𝛾𝑖∗ on 𝑧𝑖in
order to obtain the estimates (𝛽 , 𝜎∗ ∗).
Step 7: Use the bootstrap value in 𝑅2 set, as well as the value of estimators, construct
the confidence intervals for each of estimates.
Although the study applies the algorithm 2 procedure, the regression results of algorithm 1 are also provided for the robustness check. The explanations of the algorithm 1 are given in the appendix.
Data and variables specified
Licensed under Creative Common Page 9 addition, the data set is extended up to the year 2016 in order to keep the sample size not too small due to the data availability limitation. Noticeably, that 8-year period covers the first financial restructuring program (2011-2015) in the country, when many of the ownership structures have been changed in the banking market. Thus, the data set used is appropriate with the study’s main aim and also is the most available updated data. The macroeconomic variables are retrieved from the World Bank’s World Development Indicators database. In order to obtain a balanced panel data, the study excludes banks which have not been existed for the whole research period due to merger and acquisition (M& A) activities.
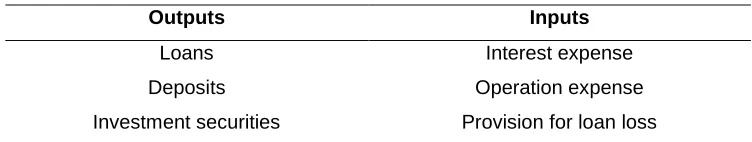
Regarding the input and output choices, there is no perfect selection for all of the banking efficiency evaluations. Arguments are made in order to choose the suitable inputs and outputs for efficiency analysis. In general, there are two common approaches used to apply for banking industry studies. They are production and intermediate approach. The intermediate approach considers banks as the intermediations between lenders and borrowers. Thus, the main function of a bank is transforming deposits into loans. Following this, loans is considered as output while deposits refers to input of banks. On the other hand, the production approach which also named as value-added approach concentrates on the capacity of providing banking services to the customers. This value-added approach was first introduced by Benston (1965). Since the intermediate approach more focuses on transforming deposits into loans which is the conventional banking business operation, thus, the approach is more suitable for the cases of underdeveloped financial industries, in particular, before deregulation (See Okuda and Aiba, 2015). Therefore, the study follows the value-added approach when making a decision toward inputs and outputs since Vietnam has opened the financial market. Following that, the model includes three outputs and three inputs described in Table 1. The output variables are total loans(Y1) which are loans for the corporate sector as well as the private sector and other loans; total deposits(Y2) which are total deposits coming from private and cooperate customers; and total investment securities(Y3) measured by the combination of investment and securities for trading while interest expense (X1), operation expense (X2) and provision for loan loss (X3) are used as inputs. Tables 1 and 2 provide information related to inputs and outputs in detail.
Table 1. Inputs and output used
Outputs Inputs
Loans Deposits Investment securities
Licensed under Creative Common Page 10 Table 2. Descriptive statistics of inputs and outputs (Unit: 1,000 VND)
Variable Observations Mean Std. Dev. Min Max
Loans 216 92,300,000 144,000,000 317,529 732,000,000
Deposits 216 106,000,000 153,000,000 1,161,517 866,000,000 Investment securities 216 24,700,000 29,100,000 19,250 158,000,000 Interest expense 216 7,192,146 9,320,652 138,921 50,500,000 Operation expense 216 2,667,299 3,819,345 72,219 26,300,000 Provision for loan loss 216 1,167,002 2,181,269 0 13,000,000
Table 2 indicates that the Vietnamese banks, on average, have a higher level of their total deposits than total loans. This observation is similar to the case of banks in Taiwan (Lin, Doan and Doong, 2015) but different from the situation observed in Australia where the total loans are relatively the same as the total deposit (Sturm and Williams, 2004). Furthermore, the standard deviations of all output variables are quite high; thus, it implies that the sample reflects the differences in bank size.
As for variables used in the regression model, the efficiency of banks is regressed on ten environmental variables following the procedure proposed by Simar and Wilson (2007). The bootstrap procedure applied is explained in the methodology section. The potential determinants of banks’ efficiency added to the regression models are as follows.
Bank size
From the literature, the argument that bank size determines the performance of the financial institutions is confirmed by many studies. In general, a larger size bank in terms of assets is expected to achieve a better efficiency level since it reaps the advantage of the extensive business network or market share. In addition, large companies might perform better since they can allocate their resources more efficiently, benefits from the scale (Alvarez and Crespi, 2003). For instance, Assaf, Barros, and Matousek (2011) showed a positive effect of bank size on performances of banks. Similarly, the same trend was observed in the studies of Stewart, Matousek, and Nguyen (2016); Wanke, and Barros (2014). In this study, the logarithm term of total assets was used as the variable represented for bank size.
Foreign ownership
Licensed under Creative Common Page 11 is considered as a proxy for foreign ownership. A higher foreign share indicated a higher degree of foreign ownership. Thus, this specification takes into account the presence of foreign ownership among both foreign and partial-foreign ownership banks. Most of the previous studies have examined the effect of ownership, in particular, foreign ownership on the performance of banks given mixed results by merely comparing the efficiency levels between foreign banks and their counterparts. Since the main aim of the study focuses on the relationship between foreign ownership and banks’ efficiency, more discussions regarding this ownership factor are already given in the literature section.
Concentration level
Since the fact that the banking sectors are dominated by some of the large banks which are likely state-owned banks or used to be transformed from the state banks is common in developing countries. It is reasonable to control the concentration level of a bank in terms of the market share in the regression model. Following Beck, Dermiguc-Kunt, and Levine (2006), the study uses the market share of an individual bank in terms of deposit as a proxy of concentration level and tests whether it determines banks’ efficiency.
Risks
Risk preference has been considered as a vital element of production in the banking business. Thus, the study models it into efficiency measurement by using two variables represented for credit risk and capital risk in order to control the risk-taking behaviors of banks. The rate of provision for loan loss over total loans is used as a proxy of credit risk while the EOA, the rate of equity over total assets, is used as a proxy of capital risk. In general, it is more often to use non-performing-loan (NPL) to capture credit risk in the banking system. NPL is widely used in banking efficiency studies (Kasman and Kasman, 2015). However, due to the limitation of data availability, the study chooses the provision for loan loss information instead of NPL. Since the more NPL rate a bank has, the more provision loan loss the bank has to ensure the provision rate is expected to be a good measure of credit risk. In general, a higher credit risk level often links with lower efficiency. Evidence showing a negative effect of credit risk on bank efficiency was found on Sufian (2009); Berger and DeYoung (1997). However, in the study of Sufian (2016) credit risk presented as the rate of loan loss provision over total loans was not a statistically significant factor that determines the performance of the Malaysian banks.
Licensed under Creative Common Page 12 that a high capitalized bank likely performs better than a low capitalized bank. For instance, by analyzing the efficiency of Chinese banks from 2004 to 2009, the study of Pessarossi and Weill (2015) showed a positive impact of the capital rate on the performance of banks. Bank with a higher capital ratio is better in terms of cost-efficiency. More discussions regarding the relationship between EOA and banks’ performance were found on Mester (1996), Casu and Molyneux (2003), Carbo, Gardener and Williams (2003), Williams and Nguyen (2005), Jiang, Yao, and Zhang (2009).
Diversification
The study uses the ratio of non-interest income over the total income to catch up on how banks diversify their business. It is necessary since different financial institutions might have different strategies in terms of business diversification apart from the traditional operation focusing on deposits-loans transformations. Moudud-Ul-Huq et al. (2018) indicated a robust positive effect of income diversification on banking production while analyzing the case of ASEAN countries. Okuda and Aiba (2015) also pointed out that the diversification rate significantly affects the overall operational efficiency. This evidence supports the argument that benefits from business diversification exceed the cost.
Macroeconomic conditions
In order to address the concern that the efficiency of the bank might be sensitive to the macroeconomic conditions, the study adds two following variables into the model. They are GDP, is the GDP growth rate, and also the inflation rate, which is the Consumer Price Index (CPI). Typically, a stable and promising economic background supports the banking business. Thus, a higher GDP growth rate and not high inflation rate link with a higher banking efficiency level.
Others variables
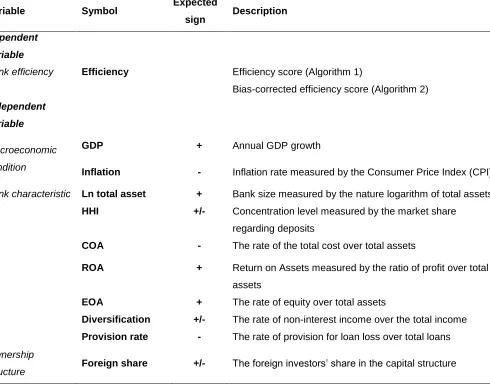
Licensed under Creative Common Page 13 Table 3. Variables descriptions for the regression model
Variable Symbol Expected
sign Description
Dependent variable
Bank efficiency Efficiency Efficiency score (Algorithm 1)
Bias-corrected efficiency score (Algorithm 2) Independent
variable
Macroeconomic condition
GDP + Annual GDP growth
Inflation - Inflation rate measured by the Consumer Price Index (CPI)
Bank characteristic Ln total asset + Bank size measured by the nature logarithm of total assets
HHI +/- Concentration level measured by the market share regarding deposits
COA - The rate of the total cost over total assets
ROA + Return on Assets measured by the ratio of profit over total assets
EOA + The rate of equity over total assets
Diversification +/- The rate of non-interest income over the total income
Provision rate - The rate of provision for loan loss over total loans
Ownership
structure Foreign share +/- The foreign investors’ share in the capital structure
ANALYSIS AND RESULTS
Licensed under Creative Common Page 14 market. Second, 2011-2012 might be an unstable period for banking business since the restructuring program for the financial sector has just started.
Table 4. Efficiency estimates
Year Observations Efficiency score Bias-corrected efficiency score Bias
2009 27 0.7316 0.6352 0.1398
2010 27 0.7404 0.6477 0.1353
2011 27 0.6018 0.5188 0.1223
2012 27 0.5493 0.4875 0.0959
2013 27 0.6630 0.5797 0.1235
2014 27 0.7772 0.6527 0.1785
2015 27 0.7791 0.6795 0.1520
2016 27 0.7983 0.6740 0.1750
Mean 0.7051 0.6094 0.1403
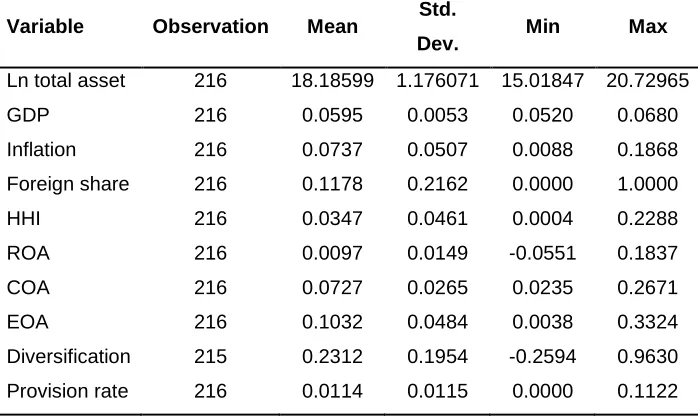
Table 5. Descriptive statistics of regression variables
Variable Observation Mean Std.
Dev. Min Max
Ln total asset 216 18.18599 1.176071 15.01847 20.72965
GDP 216 0.0595 0.0053 0.0520 0.0680
Inflation 216 0.0737 0.0507 0.0088 0.1868 Foreign share 216 0.1178 0.2162 0.0000 1.0000
HHI 216 0.0347 0.0461 0.0004 0.2288
ROA 216 0.0097 0.0149 -0.0551 0.1837
COA 216 0.0727 0.0265 0.0235 0.2671
EOA 216 0.1032 0.0484 0.0038 0.3324
Diversification 215 0.2312 0.1954 -0.2594 0.9630 Provision rate 216 0.0114 0.0115 0.0000 0.1122
Licensed under Creative Common Page 15 are relatively high. Similarly, the high standard deviation is also observed for the concentration variable, HHI, implying a high variation in the market share of banks in the sample.
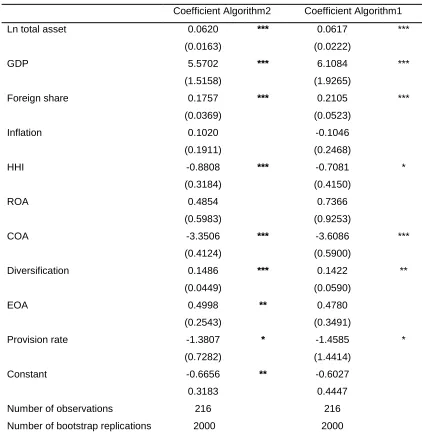
Table 6. Determinants of efficiency for the Vietnamese banking system
Coefficient Algorithm2 Coefficient Algorithm1
Ln total asset 0.0620 *** 0.0617 ***
(0.0163) (0.0222)
GDP 5.5702 *** 6.1084 ***
(1.5158) (1.9265)
Foreign share 0.1757 *** 0.2105 ***
(0.0369) (0.0523)
Inflation 0.1020 -0.1046
(0.1911) (0.2468)
HHI -0.8808 *** -0.7081 *
(0.3184) (0.4150)
ROA 0.4854 0.7366
(0.5983) (0.9253)
COA -3.3506 *** -3.6086 ***
(0.4124) (0.5900)
Diversification 0.1486 *** 0.1422 **
(0.0449) (0.0590)
EOA 0.4998 ** 0.4780
(0.2543) (0.3491)
Provision rate -1.3807 * -1.4585 *
(0.7282) (1.4414)
Constant -0.6656 ** -0.6027
0.3183 0.4447
Number of observations 216 216
Number of bootstrap replications 2000 2000
*,**, and *** indicate 10%, 5%,and 1% significance level; Standard errors are presented in the brackets. Note: The study can achieve a more accurate estimation with a large number of replications.
However, time consumed will also rise when we increase that number (Simar and Wilson,
2007).
Licensed under Creative Common Page 16 investors in a bank’s capital structure, the more efficient the bank performs. This observation supports previous studies (Grigorian and Manole, 2002; Havrylchk, 2006), concluding that foreign ownership had made banks operate more efficiently. However, results provide evidence showing that not only foreign banks perform better but also the domestic banks with foreign stakeholders will increase their efficiency levels as the foreign share rises. In the developing countries where the deregulation in the financial market usually have taken place over the last two decades, the participation of the foreigner players in the banking industry has been increased gradually. The finding above is reasonable and supports the argument of (Levine, 1996; Goldberg, 2004; Stiglitz, 1993) regarding the benefits brought by the foreign bank ownership. In particular, in developing countries, foreign ownership is likely to link with a higher ability to raise capital, providing innovative products, and also improvements in technical skills. The presence of foreigners in the financial market trends to lead to increasing competition. Thus, it might improve the strength and the consolidation of the market in the long term (Detragiache, Tressel, and Gupta, 2008).As for the case of partial foreign banks, the advantage of capital coming from the foreign strategic investors may lead to an increase the efficiency of banks since it brings not only the innovative technology and management capacity but also human capital to the local banks (Nguyen, Nghiem, Roca, and Sharma, 2016). The quality of clients, thus, is better in the cases of banks with higher foreign shareholdings. Moreover, in other words, modern cooperation governance and advanced technology can be transferred to the domestic banking sector by the appearances of foreign shareholders.
Licensed under Creative Common Page 17 BASEL II requirements, which have been introduced and also to deal with the non-performing-loans. However, up to the present, nothing similar to these above concrete proposals has been taken into action. Considering the result from the study regarding the effect of the foreign share and also taking into account other conditions of the economy, policy implications are suggested toward a slight extension of the foreign investor cap in a local bank. The extension process can be taken place gradually rather than have a massive change at first in that limit. It is worth to consider the revision of foreign share cap in Vietnam if we take a view on the same trend in the neighbor countries. For instance, the foreign shareholding ceiling was extended up to 100 percent since 1997 in Thailand, while the Philippines did the same thing in 2000. As for Malaysia, the limit for foreign shareholding has been changed from 30 to 40 percent in 2007. Furthermore, this implication might support the target of the process of privatization in which targeting to reduce the state ownership share of the state banks at a maximum rate of 65% by 2025 (SBV). As for the case of other private banks, this implication can help them increase capital by attracting more foreign investors. As a result, the milestone for the Vietnamese banking sector refers to increasing the banks' capital to catch up with the international standard BASEL II criteria might achieve efficiently.
As for the whole banking market, relaxing the capital cap for foreign investors in local banks is expected to bring a positive effect. According to Douma, Geoge, and Kabir (2006), Meyer et al., (2009), Chan, Koh, and Kim(2016), foreign shareholders bring additional and superior resources coming from finance, advanced technology, branding, management capacities as well as the international business experiences, thus, the effect of market imperfection is reduced. In other words, it provides access to foreign banks' global business and operation standards. Pieces of evidence were found for the case of China and Hungary in the studies of Fries and Taci (2005) and Hasan and Marton (2003), respectively.
Licensed under Creative Common Page 18 efficiency. Lastly, the study does not find any evidence to support the relationship between ROA as well as inflation and banking efficiency.
The regression result from the algorithm 1 is provided in this section for the robustness check purpose. In general, the estimate for coefficients from the algorithm 1 is similar to those from the algorithm 2. Most of the estimates keep the same size and the same significance level. Therefore, this consistency of results from these two algorithms is confirmed. Only the exception is found in the estimation of the effect of EOA on efficiency. It is a positive effect at the 5 percent significance level in the case of algorithm 2, while the effect is not significant for algorithm 1 estimate. However, as mentioned earlier, we do believe that the estimate from the algorithm 2 is more reliable. Therefore, this consistency of results from these two algorithms is confirmed.
CONCLUSION
This study analyzes the relationship between foreign ownership, more specifically in the ownership structure, and the efficiency of Vietnamese commercial banks using panel data from 2009 to 2016. It applies the more advanced method, DEA bootstrap, recommended by Simar and Wilson (2007) to investigate the determinants of bank efficiency. To the best of our knowledge, there is a lack of studies that examine such kind of relationship which takes into account ownership structure in detail or the degree of ownership in the bank’s capital structure, especially, the foreign share in the domestic bank as the study does. Therefore, the study contributes to the literature by providing a deeper understanding of the effect of ownership structure on a banking system’s operation.
Licensed under Creative Common Page 19 impact on efficiency level while there no evidence supporting the effect of inflation on banks’ performance. (7) Finally, the traditional financial ratios COA is revealed to be useful to determine the efficiency of banks. The less COA, the better efficiency levels a bank can achieve. There is no evidence showing the relationship between ROA and bank performance. As for the robustness check, since the regression results coming from algorithm 1 is relatively consistent with those from algorithm 2. Therefore, the findings of the study are robustly reliable.
REFERENCES
Alvarez, R., & Crespi, G. (2003). Determinants of Technical Efficiency in Small Firms. Small Business Economics, 20, 233–244.
Assaf, A. G., Barros, C. P., & Matousek, R. (2011). Technical efficiency in Saudi banks. Expert Systems with Application, 38 (5), 5781-5786.
Banker, R., Charnes, D. A., & Cooper, W. (1994). Some models for estimating technical and scale efficiencies in data envelopment analysis. Management Science, 30,1078–92.
Beck, T., Demirgüç-Kunt, A., & Levine, R. (2006). Bank concentration, competition, and crises: First results. Journal of Banking and Finance, 30(5), 1581–1603.
Benston, G. J. (1965). Branch banking and economics of scale. Journal of Finance, 20(2), 312-331.
Berger, A. N., & DeYoung, R. (1997). Problem loans and cost efficiency in commercial banks. Journal of Banking and Finance, 21(6), 849–870.
Berger, A. N., DeYoung, R., Genay, H., & Udell, G. (2000). Globalization of financial institutions: evidence from cross-border banking performance. Brookings-Wharton Pap. Finance. Services, 3, 23–158.
Brissimis, S. N., Delis, M. D., & Papanikolaou, N. I. (2008). Exploring the nexus between banking sector reform and performance: Evidence from newly acceded EU countries. Journal of Banking and Finance, 32(12), 2674–2683. Carbo, S., Gardener, E. P. M., & Williams, J. (2003). A note on technical change in banking: the case of European savings banks. Applied Economics, 35, 705-19.
Casu, B., & Molyneux, P. (2003). A comparative study of efficiency in European banking. Applied Economics, 35(17), 1865-1876.
Chan, S. -G., Koh, E. H. Y., & Kim, Y. C. (2016). Effect of Foreign Shareholdings and Originating Countries on Banking Sector Efficiency. Emerging Markets Finance and Trade, 52(9), 2018–2042.
Chortareas, G. E., Girardone, C., & Ventouri, A. (2013). Financial freedom and bank efficiency: Evidence from the European Union. Journal of Banking and Finance, 37(4), 1223–1231.
Claessens, S. & Van Horen, N. (2012). Being a foreigner among domestic banks: asset or liability? Journal of Banking and Finance, 36 (5), 1276-1290.
Cornett, M. M., Guo, L., Khaksari, S., & Tehranian, H. (2010). The impact of state ownership on performance differences in privately-owned versus state-owned banks: An international comparison. Journal of Financial Intermediation, 19, 74-94.
Cull, R., Peria, M. S. M., & Verrier, J. (2018). Bank ownership Trend and Implications, Policy research working paper 8297.
Davidova, S., & Latruffe, L. (2007). Relationships between technical efficiency and financial management for Czech Republic farms. Journal of Agricultural Economics, 58(2), 269-288.
Detragiache, E., Tressel, T., & Gupta, P. (2008). Foreign Banks in Poor Countries: Theory and Evidence. The Journal of Finance, 63(5), 2123-2160.
Dinh, N., Fung, H. -G., & Jia, J. (2019). Shadow banking, bank ownership, and bank efficiency in China. Emerging Markets Finance and Trade, 1-20.
Licensed under Creative Common Page 20 Ferri, G. (2009). Are new tiger supplanting old mammoths in China's banking system? Evidence from a sample of city commercial banks. Journal of Finance and Banking, 33(1), 131-140.
Fries, S., & Taci, A. (2005). Cost efficiency of banks in transition: evidence from 289 banks in 15 post-communist countries. Journal of Banking and Finance, 29, 55-81.
Gallizo, J. L., Moreno, J., & Salvador, M. (2016). Banking Efficiency in the Enlarged European Union: Financial Crisis and Convergence. International Finance, 19(1), 66–88.
Gardener, E., Molyneux, P., & Linh, H. N. (2011). Determinants of efficiency in South East Asian banking. The Service Industries Journal, 31(16), 2693-2719.
Goldberg, L. S. (2004). Financial-sector foreign direct investment and host countries: New and old lessons. FRB of New York Staff Report (183).
Grigorian, D. A., & Manole, V. (2002). Determinants of Commercial Bank Performance in Transition: An Application of Data Envelopment Analysis. World Bank Policy Research Working Paper No. 2850.
Hasan, I., & Marton, K. (2003). Development and efficiency of the banking sector in a transitional economy: Hungarian experience. Journal of Banking and Finance, 27, 2249–71.
Havrylchyk, O. (2006). Efficiency of the Polish banking industry: Foreign versus domestic banks. Journal of Banking and Finance, 30(7), 1975–96.
Hermes, N., & Nhung, V. T. H. (2010). The impact of financial liberalization on bank efficiency: evidence from Latin America and Asia. Applied Economics, 42(26), 3351-3365.
Hirschberg, J. G., & Lloyd, P. J. (2002). Does the technology of foreign-invested enterprises spill over to other enterprises in China? An application of post-DEA bootstrap regression analysis. In: Lloyd, P.J., Zang, X.G. (Eds.). Modeling the Chinese Economy. Edward Elgar Press, London.
Hou, X., Wang, Q., & Zhang, Q. (2014). Market structure, risk taking, and the efficiency of Chinese commercial banks. Emerging Markets Review, 20, 75–88.
Jemric, I., & Vujcic, B. (2002). Efficiency of banks in Croatia: A DEA approach. Comparative Economics Studies, 44, 169-193.
Jiang, C., Yao, S., & Zhang, Z. (2009). The effects of governance changes on bank efficiency in China: A stochastic distance function approach. China Economic Review, 20, 717–731.
Kasman, S., & Kasman, A. (2015). Bank competition, concentration and financial stability in the Turkish banking industry. Economic Systems, 39(3), 502–517.
Kenjegalieva, K. A., Simper, R., & Weyman-Jones, T. G. (2009). Efficiency of transition banks: inter-country banking industry trends. Applied Financial Economics, 19(19), 1531–1546.
Khan, I. U., Ali, S., & Khan, H. N. (2018). Market concentration, risk-taking, and efficiency of commercial banks in Pakistan: An application of two-stage double bootstrap DEA. Business and Economics Review, 10(2), 65-96.
Lensink, R., & Naaborg, I. (2007). Does foreign ownership foster bank performance? Applied Financial Economics, 17(11), 881–885.
Levine, R. (1996). Foreign Banks, Financial Development, and Economic Growth. In Claude E. Barfield, Washington, D.C. International Financial Markets: Harmonization versus Competition. The AEI Press.
Lin, K. -L., Doan, T. A., & Doong, S. –C. (2015). Changes in ownership structure and bank efficiency in Asian developing countries: The role of financial freedom. International Review of Economics and Finance, 43, 19-34. Lin, X. C., & Zhang, Y. (2009). Bank ownership reform and bank performance in China. Journal of Banking and Finance, 33, 20-29.
Manovo, M., & Vernikov, A. (2017). Bank ownership and Cost efficiency: New empirical evidence from Russia. Economics Systems, 41, 305-319.
Mansour, R., & C. E. Moussawi, S. –C. (2019). Efficiency, technical progress and productivity of Arab banks: A non-parametric approach. The quarterly review of Economics and Finance.
Mester, L. J. (1996). A study of bank efficiency taking into account risk-preferences. Journal of Banking and Finance, 20(6), 1025–1045.
Licensed under Creative Common Page 21 Micco, A., U. Panizza, & Yanez, M. (2007). Bank ownership and performance. Does politics matter? Journal of Banking and Finance, 31, 219–241.
Moudud-Ul-Huq, S., Ashraf, B. N., Gupta, A. D., & Zheng, C. (2018). Does bank diversification heterogeneously affect performance and risk-taking in ASEAN emerging economies? Research in International Business and Finance, 46, 342-362.
Nguyen, T. P. T., Nghiem, S. H., Roca, E., & Sharma, P. (2016). Bank reforms and efficiency in Vietnamese banks: evidence based on SFA and DEA. Applied Economics, 48(30), 2822-2835.
Nguyen, V. (2007). Measuring efficiency of Vietnamese commercial banks: An application of Data Envelopment Analysis (DEA). In K. Nguyen, and T. Le, Technical efficiency and productivity growth in Vietnam. Hanoi: Publishing House of Social Labour.
Nguyen, X. Q., & De Borger, B. (2008). Bootstrapping efficiency and Malmquist productivity indices: An application to the Vietnamese commercial banks. Taiwan: Academia Sinica.
Obstfeld, M., & Taylor, A. M. (2004). Global Capital Markets Integration, Crisis, and Growth. Cambridge University Press 2004 Cambridge.
Okuda, H., & Aiba, D. (2015). Determinants of Operational Efficiency and Total Factor Productivity Change of Major Cambodian Financial Institutions: A Data Envelopment Analysis During 2006–13. Emerging Markets Finance and Trade, 52(6), 1455–1471.
Pessarossi, P., & Weill, L. (2015). Do capital requirements affect cost efficiency? Evidence from China. Journal of Financial Stability, 19, 119–127.
Sanyal, P., Shankar, R. (2011). Ownership, competition, and bank productivity: An analysis of Indian banking in the post-reform period. International Review of Economics and Finance, 20(2), 225–247.
See, K. F., & He, Y. (2015). Determinants of Technical Efficiency in Chinese Banking: A Double Bootstrap Data Envelopment Analysis Approach. Global Economic Review, 44(3), 286–307.
Shaban, M., & James, G. A. (2018). The effects of ownership change on bank performance and risk exposure: Evidence from Indonesia. Journal of Banking and Finance, 88, 483–497.
Simar, L., & Wilson, P. W. (1998). Sensitivity Analysis of Efficiency Scores: How to Bootstrap in Nonparametric Frontier Models. Management Science, 44(1), 49-61.
Simar, L., & Wilson, P. W. (2007). Estimation and inference in two-stage, semi-parametric models of production processes. Journal of Econometrics, 136(1), 31-64.
Stewart, C., Matousek, R., & Nguyen, T. N. (2016). Efficiency in the Vietnamese banking system: A DEA double bootstrap approach. Research in International Business and Finance, 36, 96–111.
Stiglitz, J. E. (1993). The role of the state in financial markets. The World Bank Economic Review, 7, 19-52.
Sturm, J., & Williams, B. (2004). Foreign bank entry, deregulation and bank efficiency: Lesson from Australia experience. Journal of Banking and Finance, 28, 1775-1799.
Sufian, F. (2009). Determinants of bank efficiency during unstable macroeconomic environment: Empirical evidence from Malaysia. Research in International Business and Finance, 23(1), 54–77.
Sufian, F. (2016). Determinants of Efficiency in the Malaysian Banking Sector: Evidence from Semi-parametric Data Envelopment Analysis Method. Studies in Microeconomics, 4(2), 151–172.
Sufian, F., & Habibullah, M. S. (2011). Navigating the Impact of Globalization on Bank Efficiency in China. China and World Economy, 19(5), 85–101.
Sun, L., & Chang, T. P. (2011). A comprehensive analysis of the effects of risk measures on bank efficiency: Evidence from emerging Asian countries. Journal of Banking and Finance, 35(7),1727–1735.
Wanke, P., & Barros, C. P. (2014). Two-stage DEA: An application to major Brazilian banks. Expert Systems with Application, 41 (5), 2237-2344.
Williams, J., & Nguyen, N. (2005). Financial liberalization, crisis, and restructuring: A comparative study of bank performance and bank governance in South East Asia. Journal of Banking and Finance, 29, 2119–54.
Winterbottom, J. (2015). The banking outlook for Vietnam. The international banker- Authoritative analysis on international banking. Retrieved July 17, 2019,https://internationalbanker.com
Licensed under Creative Common Page 22 Yao, S., Jian, C., Feng, G., &Willenbockel, D. (2007). On the efficiency of Chinese banks and WTO challenges. Applied Economics, 39, 629–643.
Zajc, P. (2006). A comparative study of bank efficiency in central and Eastern Europe: The role of foreign ownership. International Finance Review, 6,117-156.
Zhang, T., & Matthews, K. (2012). Efficiency convergence properties of Indonesian banks 1992-2007. Applied Financial Economics, 22(17), 1465-1478.
APPENDICES
Appendix 1
List of banks used in the sample
Code Name of banks Size Title
Ownership structure Foreign share State share Private domestic share State-owned banks
5 Vietnam Bank for Industry and Trade (CTG) Large listed 30% 64% 6%
6
Joint Stock Commercial Bank for Investment and
Development of Vietnam (BIDV) Large listed 1% 95% 3%
12
Joint Stock Commercial Bank for Foreign Trade
of Vietnam (VCB) Large listed 21% 77% 2%
25
Vietnam Bank for Agriculture and Rural
development (Agribank) Large unlisted 0% 100% 0%
Joint-stock banks
1 Asia Commercial Joint Stock Bank (ACB) Large listed 30% 0% 70% 2 AnBinh Commercial Joint Stock Bank (ABB) Medium unlisted 30% 0% 70%
3
Viet Capital Commercial Joint Stock Bank (Viet
Capital Bank) Medium unlisted 0% 0% 100%
4
Lien Viet Commercial Joint Stock Bank (Lienviet
Post Bank) Large unlisted 0% 0% 100%
7
Southeast Asia Commercial Joint Stock Bank
(SEA bank) Medium unlisted 0% 0% 100%
8
The Maritime Commercial Joint Stock Bank
(MSB) Large unlisted 0% 0% 100%
9 Tien Phong Commercial Joint Stock Bank (TPB) Medium unlisted 5% 0% 95%
10
Viet Nam Technological and Commercial Joint
Stock Bank (Techcombank) Large unlisted 0% 0% 100%
11
Nam A Commercial Joint Stock Bank
(NamAbank) Small unlisted 0% 0% 100%
13
Housing development Commercial Joint Stock
Bank (HDB) Medium unlisted 0% 0% 100%
14 Orient Commercial Joint Stock Bank (OCB) Small unlisted 13% 0% 87% 15 Military Commercial Joint Stock Bank Large listed 20% 0% 80%
16
Vietnam International Commercial Joint Stock
Bank (VIB) Medium unlisted 20% 0% 80%
17 National Citizen Bank (NCB) Small listed 0% 0% 100%
Licensed under Creative Common Page 23 20
Sai Gon Thuong Tin Commercial Joint Stock
Bank (Sacombank) Large listed 9% 0% 91%
21 Viet A Commercial Joint Stock Bank (VietA bank) Small unlisted 0% 0% 100%
22
Vietnam Commercial Joint Stock Bank for Private
Enterprise Large unlisted 0% 0% 100%
23
Petrolimex Group Commercial Joint Stock Bank
(PGB) Small unlisted 5% 0% 95%
24 Vietnam Commercial Joint Stock Exim (EXB) Large listed 28% 0% 72%
Foreign and Joint venture banks
26 Indovina Bank Small unlisted 50% 0% 50%
27 HSBC Vietnam Medium unlisted 100% 0% 0%
Appendix 2
The Algorithm 1 procedure proposed by Simar and Wilson (2007)
Let’s assume the model is that 𝛾𝑖𝑡 = 𝑓 𝑧𝑖𝑡 𝛽 = 𝛽𝑧𝑖𝑡+ 𝑢𝑖𝑡
Where 𝛾𝑖𝑡 is the technical efficiency of bank i in the year t, 𝑧𝑖𝑡 is the vector of environmental variables as
determinants of bank efficiency, and 𝑢𝑖𝑡 is the error term.
In the first stage, the technical efficiency 𝛾 of each bank is obtained each year by employed an input-oriented DEA model for the case of variable return to scale assumption (see Banker, Charnes & Coper, 1984).
The study obtains the estimator 𝛽 of 𝛽 in the regression of 𝛾𝑖𝑡 on environmental variables 𝑧𝑖𝑡
in the model by using the maximum likelihood method. The value of the estimator𝜎 of𝜎 is also obtained from this truncated regression process.
I loop the next steps from a to c N times to get the bootstrap-replication set 𝑅 = 𝛽 𝑏∗, 𝜎 𝑏∗ 𝑏=1 𝑁
a. For each of bank within sample, i=1,…,m, from the normal distribution 𝑁 0, 𝜎 𝑢2 with
bilateral truncation at −𝑧𝑖𝑡𝛽 and1 − 𝑧𝑖𝑡𝛽 draw 𝑢𝑖𝑡∗
b. For each of bank i=1, …,m, again calculate 𝛾𝑖∗= 𝑧𝑖𝑡𝛽 + 𝑢1𝑖∗
c. Apply the maximum likelihood method to the truncated regression of 𝛾𝑖𝑡 on 𝑧𝑖𝑡, obtain
the set R described earlier
Use the bootstrap value in R set as well as the value of estimator, construct the confidence intervals for each of estimates.
Appendix 3
Descriptive statistic of independent variables used in the regression model by year
2009 Variable Observation Mean Std. Dev. Min Max
Ln total asset 27 17.4450 1.2457 15.0185 19.9913
GDP 27 0.0540 0.0000 0.0540 0.0540
Inflation 27 0.0755 0.0000 0.0755 0.0755
Foreign share 27 0.0961 0.2228 0.0000 1.0000
HHI 27 0.0345 0.0525 0.0008 0.2288
ROA 27 0.0136 0.0056 0.0037 0.0311
COA 27 0.0593 0.0145 0.0307 0.0927
EOA 27 0.1214 0.0695 0.0400 0.3324
Licensed under Creative Common Page 24
2010 Variable Observation Mean Std. Dev. Min Max
Ln total asset 27 17.9013 1.1520 15.9227 20.0978
GDP 27 0.0640 0.0000 0.0640 0.0640
Inflation 27 0.0890 0.0000 0.0890 0.0890
Foreign share 27 0.1020 0.2216 0.0000 1.0000
HHI 27 0.0341 0.0482 0.0017 0.2016
ROA 27 0.0128 0.0080 0.0023 0.0473
COA 27 0.0662 0.0127 0.0453 0.1061
EOA 27 0.1073 0.0507 0.0494 0.2527
Diversification 27 0.2322 0.1226 0.0342 0.5366 Provision rate 27 0.0066 0.0032 0.0016 0.0147
2011 Variable Observation Mean Std. Dev. Min Max
Ln total asset 27 18.0997 1.1300 16.5476 20.1368
GDP 27 0.0620 0.0000 0.0620 0.0620
Inflation 27 0.1868 0.0000 0.1868 0.1868
Foreign share 27 0.1089 0.2204 0.0000 1.0000
HHI 27 0.0353 0.0477 0.0025 0.1940
ROA 27 0.0101 0.0142 -0.0551 0.0275
COA 27 0.1009 0.0233 0.0614 0.1542
EOA 27 0.1053 0.0473 0.0426 0.2151
Diversification 27 0.1336 0.1372 -0.0791 0.4754 Provision rate 27 0.0100 0.0086 0.0000 0.0291
2012 Variable Observation Mean Std. Dev. Min Max
Ln total asset 27 18.1196 1.1597 16.5137 20.2371
GDP 27 0.0520 0.0000 0.0520 0.0520
Inflation 27 0.0909 0.0000 0.0909 0.0909
Foreign share 27 0.1156 0.2165 0.0000 1.0000
HHI 27 0.0343 0.0454 0.0033 0.1908
ROA 27 0.0086 0.0057 0.0001 0.0212
COA 27 0.0968 0.0210 0.0546 0.1354
EOA 27 0.1154 0.0511 0.0547 0.2383
Diversification 27 0.1631 0.1751 -0.1776 0.5000 Provision rate 27 0.0121 0.0075 0.0000 0.0277
2013 Variable Observation Mean Std. Dev. Min Max
Ln total asset 27 18.2729 1.0914 16.5023 20.3566
GDP 27 0.0540 0.0000 0.0540 0.0540
Inflation 27 0.0659 0.0000 0.0659 0.0659
Foreign share 27 0.1251 0.2180 0.0000 1.0000
HHI 27 0.0353 0.0457 0.0036 0.1908
ROA 27 0.0092 0.0146 0.0006 0.0787
Licensed under Creative Common Page 25
EOA 27 0.1030 0.0440 0.0038 0.2384
Diversification 27 0.2099 0.1617 -0.0616 0.8005 Provision rate 27 0.0123 0.0124 0.0000 0.0633
2014 Variable Observation Mean Std. Dev. Min Max
Ln total asset 27 18.4206 1.0785 16.5770 20.4535
GDP 27 0.0600 0.0000 0.0600 0.0600
Inflation 27 0.0408 0.0000 0.0408 0.0408
Foreign share 27 0.1250 0.2171 0.0000 1.0000
HHI 27 0.0343 0.0439 0.0004 0.1756
ROA 27 0.0060 0.0038 0.0002 0.0131
COA 27 0.0625 0.0158 0.0379 0.1149
EOA 27 0.0953 0.0384 0.0512 0.2203
Diversification 27 0.1954 0.1222 -0.0842 0.4979 Provision rate 27 0.0144 0.0213 0.0000 0.1122
2015 Variable Observation Mean Std. Dev. Min Max
Ln total asset 27 18.5276 1.1095 16.6918 20.5895
GDP 27 0.0680 0.0000 0.0680 0.0680
Inflation 27 0.0088 0.0000 0.0088 0.0088
Foreign share 27 0.1328 0.2190 0.0000 1.0000
HHI 27 0.0349 0.0450 0.0030 0.1749
ROA 27 0.0048 0.0036 0.0001 0.0129
COA 27 0.0601 0.0116 0.0374 0.0896
EOA 27 0.0927 0.0363 0.0476 0.1911
Diversification 27 0.1637 0.2079 -0.2594 0.9630 Provision rate 27 0.0137 0.0075 0.0022 0.0328
2016 Variable Observation Mean Std. Dev. Min Max
Ln total asset 27 18.7012 1.1057 16.7625 20.7297
GDP 27 0.0622 0.0012 0.0620 0.0680
Inflation 27 0.0315 0.0045 0.0088 0.0324
Foreign share 27 0.1369 0.2192 0.0000 1.0000
HHI 27 0.0351 0.0460 0.0027 0.1677
ROA 27 0.0123 0.0346 0.0001 0.1837
COA 26 0.0670 0.0429 0.0333 0.2671
EOA 27 0.0847 0.0370 0.0439 0.1845
Diversification 26 0.1889 0.1264 -0.0393 0.5256
Licensed under Creative Common Page 26
Appendix 4
Efficiency estimations of Vietnamese banks for the period from 2009 to 2016
Code Efficiency Bias-corrected
efficiency Bias Lower bound Upper bound
1 0.6510 0.5444 0.1554 0.4883 0.6437
2 0.5219 0.4771 0.0630 0.4524 0.5153
3 0.7212 0.5976 0.1720 0.5407 0.7126
4 0.8127 0.6714 0.1951 0.6092 0.8043
5 0.7952 0.6861 0.1697 0.6165 0.7862
6 0.8083 0.7111 0.1565 0.6432 0.7998
7 0.7827 0.6967 0.1200 0.6537 0.7737
8 0.8822 0.7124 0.2338 0.6371 0.8709
9 0.8285 0.6714 0.2254 0.5935 0.8189
10 0.7697 0.6844 0.1366 0.6239 0.7605
11 0.6236 0.5545 0.1071 0.5098 0.6169
12 0.7889 0.6764 0.1722 0.6079 0.7801
13 0.6183 0.5518 0.0993 0.5117 0.6110
14 0.6380 0.5850 0.0804 0.5505 0.6310
15 0.7686 0.7011 0.1039 0.6551 0.7590
16 0.6648 0.5977 0.0993 0.5577 0.6570
17 0.6256 0.5607 0.0970 0.5212 0.6182
18 0.5390 0.4907 0.0755 0.4575 0.5329
19 0.7940 0.6818 0.1677 0.6175 0.7852
20 0.5436 0.4606 0.1196 0.4174 0.5370
21 0.8992 0.7494 0.1984 0.6890 0.8874
22 0.5981 0.5370 0.0961 0.4948 0.5910
23 0.5689 0.5172 0.0783 0.4842 0.5624
24 0.6436 0.5857 0.0883 0.5467 0.6350
25 0.6631 0.5274 0.2059 0.4498 0.6557
26 0.7503 0.6509 0.1421 0.5993 0.7414
27 0.7367 0.5736 0.2286 0.5000 0.7286