Fast And Efficient Classification Algorithm For Fuzzy
C-Means Clustering In Remote Sensing Images
Balaji. T 1 , Sumathi. M 2
1
Assistant Professor, Dept. of Computer Science, Govt. Arts College, Melur, India
2
Associate Professor, Dept. of Computer Science, Sri Meenakshi Govt. Arts College for Women, Madurai, India
Abstract
Remote sensing image classification is the most practical approach among virtually all automated image recognition systems. The quality of remote sensing images is directly affected by sensor medium, atmosphere, pressure and temperature. This emphasizes the necessity of image classification, which divides an image into parts that have strong correlations with objects to reflect the actual information collected from the real world image. The purpose of clustering is to identify natural groupings of data from a large image data set to produce a concise representation of features. A common approach is to use fuzzy iterative clustering algorithms that provide a partition of the pixels into a given number of clusters. The fuzzy c-means (FCM) algorithm is used to cluster obtained feature vectors into several classes corresponding to the different regions of the image. However, most of the classification algorithms present several drawbacks: they are time consuming, and sensitive to initialization and noise. In this paper, we propose a fast and efficient fuzzy c-means algorithm aiming at correcting such drawbacks. It relies on a new efficient cluster centers initialization and color quantization allowing faster and precise and more accurate convergence such that it is suitable to classify very large remote sensing images. This technique is a powerful and concise method for remote sensing image classification and works for both single and multiple features with spatial information. Experimental results shown that the algorithm generates good quality of classified image.
Keywords: Clustering, Fuzzy Clustering, FEFCM, Centroid Initialization, Membership Values, Objective Function.
1. Introduction
Image classification can be defined as the process of merging pixels having similar features into the same groups or regions. The classified image is then the union of distinct groups, where pixels of homogeneous regions are associated to the same groups. Remote sensing image classification is an important and challenging problem and a necessary first step in image analysis as well as in high-level image interpretation and robot vision, object recognition, medical imaging. The goal of image classification is to partition an image into a set of disjoint regions with uniform and homogeneous attributes such as
intensity, colour, tone or texture, etc. Many different classification techniques have been developed in the image classification approaches can be divided into four categories: thresholding, clustering, edge detection and region extraction. In this paper, fuzzy clustering based method for image classification of remote sensing applications will be considered. Fuzzy logic has also been applied to computerized image analysis taking advantages of its insensibility to noise and the ability to easily handle multidimensional features presented in most digital images.
It is important to have a faithful tool to help with viewing and measuring various features in the satellite image. This requires the study of fuzzy set theories and algorithms for getting a precise description of the regions of interest. One of such algorithms is the classification of images to isolate objects and regions. One of the main problems in image classification is uncertainty. Some of the sources of this uncertainty include additive and non-additive noise imprecision in computations and vagueness in class definitions. Traditionally probability theory was the primary mathematical model used to deal with uncertainty problems, however, the possibility concept introduced by the fuzzy set theory has gained popularity in modelling and propagating uncertainty in remote sensing image applications. This paper describes in details the implementation of a fast and efficient fuzzy c-mean algorithm in the remote sensing image classification.
information of pixels based on the ground that the pixel in the nearby neighbourhood has similar feature data. Incorporated a second phase to the FCM where the membership of each pixel is updated using spatial information that may fortify or reduce the weighting of a pixel to a cluster.
2. Clustering
Clustering is an unsupervised learning task that aims at decomposing a given set of objects into subgroups or clusters based on similarity. The process of grouping a set of physical or abstract objects into classes of similar objects is called clustering. A cluster is a collection of data objects that are similar to one another within the same cluster and are dissimilar to the objects in other clusters. Clustering is useful in several exploratory
decision-making, machine learning, data mining, image
classification, and pattern classification. Clustering may be found under different names in different contexts, such as unsupervised learning (in pattern recognition, signal processing), numerical taxonomy (in biology, ecology), typology (in social sciences) and partition (in graph theory).
By definition, cluster analysis is the art of finding groups in data or clustering is the classification of similar objects into different groups or more precisely the partitioning of a data into subsets (clusters), so that the data in each subset (ideally) share some common trait-often proximity according to some defined distance measure. Clustering is a challenging field of research as it can be used as a stand-alone tool to gain insight into the distribution of data, to observe the characteristics of each cluster and to focus on a particular set of clusters for further analysis. Alternatively, cluster analysis serves as a pre-processing step for different classification algorithms.
2.1 Fuzzy Clustering
Fuzzy clustering algorithm is an unsupervised technique that has been successfully applied to feature analysis, clustering, and classifier designs in fields such as astronomy, geology, medical imaging, target recognition, and image classification. Remote sensing image can be represented in various feature spaces and the FCM algorithm classifies the image by grouping similar data points in the feature space into clusters. This clustering is achieved by iteratively minimizing a cost function that is dependent on the distance of the pixels to the cluster centers in the feature domain. The pixels on an image are highly correlated, i.e. the pixels in the immediate neighborhood possess nearly the same feature data. Therefore, the spatial relationship of neighboring pixels is an important characteristic that can be of great aid in
image classification. The goal of a clustering analysis is to divide a given set of data or objects into a cluster, which represents subsets or a group. The partition should have two properties:
Homogeneity inside clusters: the data, which
belongs to one cluster, should be as similar as possible.
Heterogeneity between the clusters: the data,
which belongs to different clusters, should be as different as possible.
The fuzzy clustering is a two-pass process at each iteration. The first pass is the same as that in standard FCM to calculate the membership function in the spectral domain. In the second pass, the membership information of each pixel is mapped to the spatial domain, and the spatial function is computed from that mapping. The FCM iteration proceeds with the new membership that is incorporated with the spatial function. The iteration is stopped when the maximum difference between two cluster centers at two successive iterations is less than a threshold. The proposed FCM algorithm assigns pixels to each category by using fuzzy memberships. Let X=(x1,
x2,.,xN) denotes an image with N pixels to be partitioned
into C clusters, where Xi represents multispectral
(features) data. This algorithm is an iterative optimization that minimizes the cost function defined as follows:
(1)
Here, Mij represents the membership of pixel Xj in the ith
cluster, Ui is the ith cluster center and n is a constant. The
parameter n controls the fuzziness of the resulting partition. The cost function is minimized when pixels close to the centroid of their clusters are assigned high membership values, and low membership values are assigned to pixels with data far from the centroid. The membership function represents the probability that a pixel belongs to a specific cluster. In the FCM algorithm, the probability is dependent solely on the distance between the pixel and each individual cluster center in the feature domain. The membership functions and cluster centers are updated by starting with an initial guess for each cluster
center, the FCM converges to a solution for Ui
representing the local minimum or a saddle point of the cost function.
2.2 Innovations of Centroids Initialization
final partition/centers. However, most of the practitioners initialize in a random manner, which heavily affects the results. Another reason to correctly initialize the cluster centers is that it allows to speed up the convergence, resulting in a more practical problems for large scale usable algorithms. Several methods have been proposed for the initialization of cluster centers. However, most of the methods that allow to initialize cluster centers are computationally expensive. We propose a new fast and
efficient FCM algorithm of initializing the C cluster
centers, that we call the Ordering-split. For each number
of P dimensional sample Xk, we define its relative mean by
(2)
Here, parameter Mis called the fuzziness index, it is used
to control the fuzziness of membership of each pixel. The
value of mshould be within the range M∈ [1, ∞]. Mis a
weighting exponent that satisfies M >1 and controls the degree of fuzziness in the resulting membership functions.
As M approaches are unity, the membership functions
become more crisp and approach may be binary functions. As M increases, the membership functions become increasingly fuzzy and these techniques are used to perform with a given data and are being applied in a variety of interdisciplinary applications. In image classification, clustering is used to provide the updated centroid value according to the distance between the objects. The centroid calculation is described in fig.1.
Fig. 1 Centroid Calculations for Image Classification
Although, we obtain the normal iterative performance of n-dimensional vector M= (m1,m2,. ,mn). Note that we are working on features coming from each channel of an image so that the scale of individual features does not differ. If the features do not hold this property, a
normalization process is required. Let β be the alternative
function such that Mβ(k) is an ordering and increasing
sequence of n-dimensional vector. We propose uniformly
split the n-dimensional vector Minto Cgroups to split the
n relative means assuming that the clusters are equally distributed. In other terms, we set C+1 indices, say
δ0,…,δC such that the C differences (δi - δi-1) are roughly
equals 1. Now each index is calculated by:
(3) We iteratively build the clusters C and their subsets of indices Si of nas follows:
(4) We obtain the subset of indices Si in each cluster C by
applying the inverse function as follows:
(5) Finally, each cluster center |Ci| is the cardinality of Ci is
computed by using:
(6) The whole even split centers initialization procedure is summarized in the following table 1. The proposed method is efficient compared to a random initialization of the cluster centers. Note that the time needed for the computation of initial cluster centers is obviously added to the clustering time.
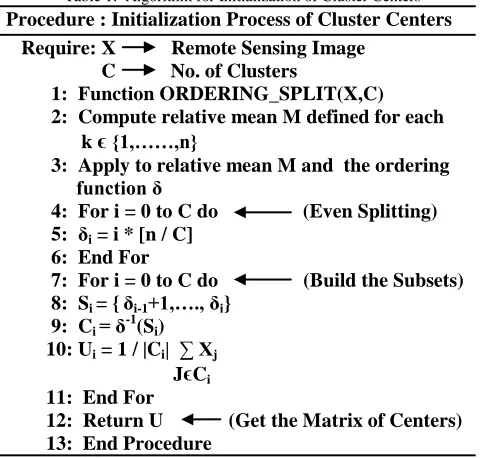
Table 1: Algorithm for Initialization of Cluster Centers
Procedure : Initialization Process of Cluster Centers Require: X Remote Sensing Image
C No. of Clusters
1: Function ORDERING_SPLIT(X,C) 2: Compute relative mean M defined for each k
ϵ
{1,……,n}3: Apply to relative mean M and the ordering function δ
4: For i= 0 to Cdo (Even Splitting) 5: δi = i * [n / C]
6: End For
7: For i= 0 to Cdo (Build the Subsets) 8: Si = {δi-1+1,…., δi}
9: Ci = δ-1(Si)
10: Ui = 1 / |Ci| ∑ Xj
J
ϵ
Ci11: End For
12: Return U (Get the Matrix of Centers) 13: End Procedure
advantage of this algorithm is that it can handle small and large amounts of noise by adjusting a penalty coefficient. In addition, in this algorithm the membership is changed while the centroid computations are the same as in the standard FCM algorithm. Experimental results and comparisons with many derivatives of FCM algorithm on a variety of images show the effective and robust features.
2.3 Cluster Evaluation Functions
One of the important characteristics of an image classification is that neighboring pixels are highly correlated. In other words, these neighboring pixels possess similar feature values and the probability that they belong to the same cluster is great phenomenon. This spatial relationship is important in clustering, but it is not utilized in a standard FCM algorithm. Two types of cluster
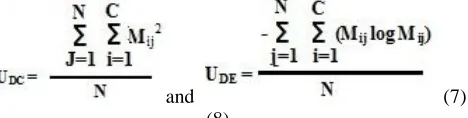
evaluation functions, fuzzy divider and feature
configuration are often used to evaluate the performance of clustering in different clustering methods. The representative functions for the fuzzy divider are divider coefficient UDC and divider entropy UDE. They are defined
as follows:
and (7)
(8)
The idea of these validity functions is that the partition with less fuzziness means better performance. As a result, the best clustering is achieved when the value UDC is
maximal or UDE is minimal. Disadvantages of UDC and
UDE are that they measure only the fuzzy divider and lack
a direct connection to the featuring property. Other validity functions based on the clustering application called feature configuration are defined by the cluster feature validity function as:
(8)
The above validity function has to generates good clustering samples that are compacted within one cluster and samples that are separated between different clusters. We expected to minimizing value of UFC is to lead to a
good clustering result.
3. Methodology
The aim of this study is to introduce a new classification method for FCM clustering. In a standard FCM technique, a noisy pixel is wrongly classified because of its abnormal feature data. Our new method incorporates spatial information and the membership weighting of each cluster is altered after the cluster distribution in the neighborhood is considered. This scheme greatly reduces the effect of noise and biases the algorithm toward homogeneous clustering.
3.1 Standard FCM Classification Algorithm
Fuzzy clustering is one of the most widely used fuzzy approaches in remote sensing image classification. The FCM algorithm was originally introduced by Bezdek in 1981. It is an iterative algorithm used to build clusters (classification) where the class membership of pixels can be interpreted as the degree of belongingness of the pixel to the clusters. The membership μij is the degree of pixel
Xi to the cluster center Uj and μij has to satisfy the
following conditions:
(9)
(10) In fuzzy set theory, every element in the universe belongs to a varying degree to all sets defined in the universe. But in fuzzy clustering, objects are not classified as belonging to one and only cluster, but instead, they own a degree of membership with each of the clusters. FCM provides
hyper spherically-shaped well separated clusters
accurately. The standard FCM algorithm can performed the following steps:
Table 2: Algorithm For Standard FCM Classification
Procedure: The Standard FCM Classification Step 1: Set the following factors
Number of clusters
Assign centroid
Number of iterations
Termination parameters
Fuzziness factor
Step 2: Calculate / update membership values(μij) Calculate distances(Dij)
Membership values are to be
calculated using calculated distances Step 3: Update centroids
Step 4: Find Objective function(Br)
3.2 Proposed FEFCM Classification Algorithm
The purpose of classification is to partition the image into homogeneous regions. In this paper, we employ the fast and efficient FCM algorithm to cluster the feature vectors into several classes with every class corresponding to one region in the classified image. This paper describes a remote sensing image classification technique using FCM features. In remotely-sensed multispectral imagery the variations in the reflectivity of surface materials across different spectral bands provide a fundamental mechanism for understanding the image features. The cost function is minimized when pixels close to the centroid of their clusters are assigned high membership values and low membership values are assigned to pixels with data far from the centroid. The membership function represents the probability that a pixel belongs to a specific cluster. In the FCM algorithm, the probability is dependent solely on the distance between the pixel and each individual cluster center in the feature domain. The fast and efficient FCM algorithm can be performed by the following steps:
Table 3: Algorithm for Proposed FEFCM Classification
Procedure: Proposed FEFCM Classification Step 1: Read remote sensing image.
Step 2: Enhance the image
Step 3: Classify the feature vector using FCM. Step 4: Assign the pixels to the clusters as follows: A pixel Xis assigned to cluster isuch that the value of the membership function of Xfor i is maximum.
Step 5: Initialize the cluster centers U = {u1, u2…., uc},
or initialize the membership matrix μij with
random value such that it satisfies above conditions (4) and (5). Then calculate the cluster centers.
Step 6: Calculate / update the fuzzy membership values μij using:
C
μij = 1 / ∑ (Dij / Dik)2/m-1
k=1
Where, Dij = ||Xi − Uj||, ∀i = 1... n, ∀j =1,...C.
Step 7: Compute / update the fuzzy centroids Uj
using:
n n Uj = ∑ (μij)m Xi / ∑ (μij)m
i=1 i=1
Step 8: Find objective function (Jr).
Step 9: Repeat the step 6 to 7 until the minimum Jr
value is achieved, otherwise Stop.
Step 10: Get different fuzzy level clustering image
Fuzzy c-means (FCM) clustering has been widely used in image classification. Compared with standard FCM algorithm, fast and efficient FCM is able to preserve more
information from the original image. This algorithm is to solve the accounting for spatial information via modifying the objective function and introducing feature weighting of the data.
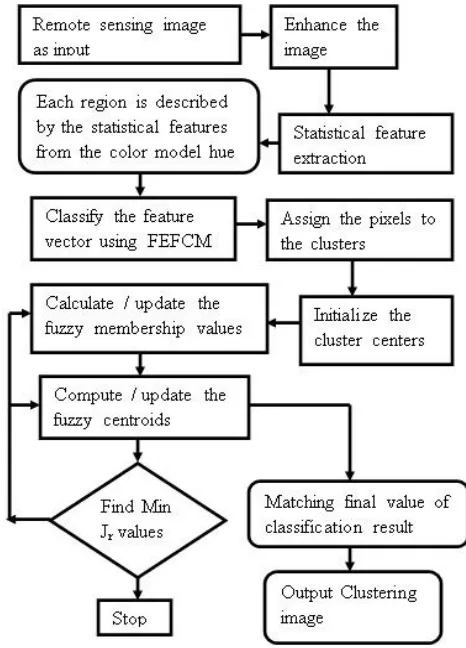
3.3 Flowchart
The FCM algorithm is an iterative clustering method that produces a C partition by minimize an objective function. However, the fuzzy c-means algorithm is better than the hard c-means (HCM) algorithm. Instead, the FCM relaxes the condition, and allows the feature vector to have multiple membership grades to multiple clusters, Suppose the data set with known clusters and a data point which is close to both clusters. Fuzzy clustering gracefully copes with assigning this data point equal but partial memberships to both clusters that is the point may belong to both clusters with some degree of membership grades varies from 0 to 1. The fuzzy c-means clustering technique is then used to cluster the obtained feature vectors into several classes with every class corresponding to one region in the classified image. Therefore, the pixels are divided into several groups with each group having similar colors. The proposed method can be described by a flowchart given in Fig. 2.
This iteration is based on minimizing an objective function that represents the distance from any given data point to cluster center weighted by that data points membership status. It works better than ostu, standard FCM and conventional FCM method. In normal fuzzy c means clustering the segmented part cannot be seen clearly. For that reasons, fast and efficient FCM clustering is applied to extract clearly the classified image part. Hence, it gives the clarity clusters of remote sensing images after applying proposed fuzzy c means clustering method. This algorithm was optimized for computation speed 7.354227 secs., which is the combination of high classification precision, makes it suitable for remote sensing applications. The complete process of this algorithm standards are summarized in the following fig. 3.
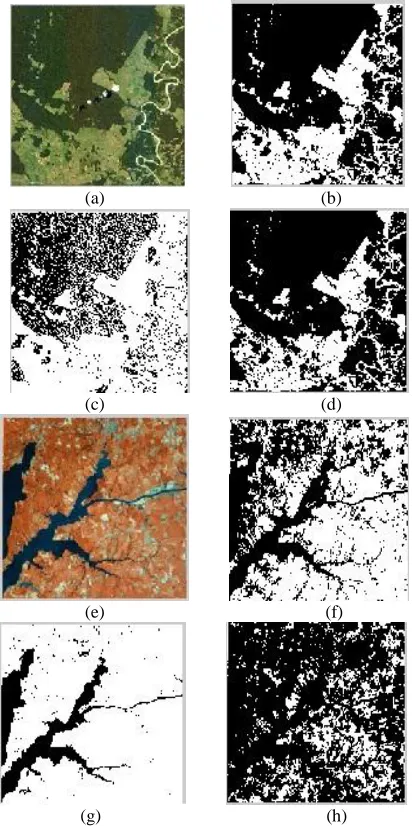
(a) (b)
(c) (d)
(e) (f)
(g) (h)
Fig. 3. a. Original Image 1, b. Cluster Index 1, c. Cluster Index 2, Cluster Index 3, e. Original Image 2, f. Cluster Index 1, g. Cluster Index 2, h. Cluster Index 3 with value of M is 2.
4. Experimental Results
In experiments were used remote sensing forestry test color images. Experiments were done in Matlab 7.6. Conditions for fuzzy clustering method were: fuzziness
index M = 2 , stop condition
τ
= 0.01, number of clustersC = 3 . To test the accuracy of the classification
algorithms, three steps are followed.
First, an remote sensing satellite image is taken as
input.
Second, classification algorithm is applied for
remote sensing images.
Third, the non-direct objective measure is applied
for fast and efficient fuzzy c-means algorithm for evaluation of remote sensing images.
The reconstruction of an images has the dimensions of 256 pixel intensity. The images in this contain a wide variety of spatial and spectral information. The non-direct objective measure applied must be less value for an better image classification. To estimate the quality of the reconstructed images, following objectively measure the quality of the classification assessment parameters are used in this paper.
4.1 Vitality Factor(VF)
The gray level vitality indicates how the gray levels are distributed. It is formulated as:
(11) Here, E(x) represents the gray level energy with 256 bins and P(i) refers to the probability distribution functions, which contains the histogram counts. The vitality reaches its maximum value of 1, when an image has a constant gray level.
4.2 Absolute Entropy (AE)
Suppose that two distinct probability distributions of the images have the probability functions of P and Q, the absolute entropy of P with respect to Q is then defined as the summation of all possible states of the system, which is formulated as:
(12)
4.3 Distinct Entropy (DE)
the products of the probability of outcome multiplied by the log of the inverse of the outcome probability taking into considerations of all possible outcomes {1, 2, …, n} in the event {x1, x2, …, xn}, where n is the gray level, P(i)
is the probability distribution, considering all histogram counts. It is formulated as:
(13)
4.4. Classification Accuracy
Evaluate the performance of the proposed approach tests were first realized on two remote sensing images. FEPFCM algorithms can achieve much better performance than standard FCM algorithm. The classification accuracy of applying these algorithms to these images with different level of noises. The classification accuracy (CA) is defined as follows:
(14)
5. Conclusion
Image classification are most practical approaches among virtually all automated image recognition systems. Clustering of numerical data forms the basis of many classification and system modeling algorithms. The purpose of clustering is to identify natural groupings of data from a large data set to produce a concise representation of an image features. This paper presented a new approach for unsupervised image classification algorithm based on clustering technique which determines the optimal clustering of remote sensing image dataset with minimum user intervention. This paper has several new innovations and extensions: First, a new initialization method of cluster centers, allowing faster convergence of the iterative algorithm is presented. Cluster center in our case is typical pixel of classification with its neighbors (up, right, down and left neighbor). Second, we generalize
the enhanced image color feature by using a membership and objective quantization of the color space. Moreover, using an objective quantization of the color space allows to obtain a more robust clustering. Comparison of the experimental results with that of other clustering methods, show that the technique gives satisfactory results when applied on well-known satellite images. Experimental results show that the proposed method is effective and more robust to Gaussian noise and other artifacts than the conventional FCM algorithm in image classification. Extension of feature space of fast and efficient fuzzy c-means clustering method brings better classification results.
References
[1] Balaji T., amd Sumathi M., “Effective Features of Remote Sensing Image Classification Using Interactive Adaptive Thresholding Method”, International Conference proceedings, ICICA, Coimbatore, pp. 149-153, March 2014. [2] Balaji T., amd Sumathi M., “A Simple and Efficient Feature Based Image Classification of Remote Sensing Images using Local Threshold Method”, International Conference proceedings, ENIAC, Kovilpatti, pp. 49-55, January 2014. [3] Balaji T., amd Sumathi M., “Relational Color Features of
Remote Sensing Image Classification Using Dynamic Global Threshold Method”, International Conference proceedings, ICRSI, Gujarat, pp. 29-34, December 2013. [4] Balaji T., amd Sumathi M., “High Emphatic Feature
Selection Classification Algorithm for SVM in Remote Sensing Images”, IJLTEMAS, Vol. II, Issue X, pp. 61-67, October 2013.
[5] Balaji T., and Sumathi M., “Remote sensing image classification – A perspective analysis”, Internation Journal of Third Concept, pp. 37-41, September 2013.
[6] Balaji T., and Sumathi M., “Relational features of remote sensing image classification using effective k-means clustering”, IJoART, vol. 8, Issue 8, pp. 103–107, August 2013.
[7] Saritha. A.K and Ameera. P.M., “ Image Classification based on kernel fuzzy C means clustering using edge detection method on noisy images”, IJARCET, Volume2, Issue 2, pp. 399-406, February 2013.
[8] S.Z.Beevi, M.M. Sathik and K.senthamarakannan, “ A Robust fuzzy Clustering Technique with Spatial neighborhood Information for Effective Medical Image Segmentation,” Int. Journal of Computer Science and Information Security, Vol 7. No. 3, pp. 132-138, March 2012.
[9] S.Kirindis and V. Chatzis, “ A Robust Fuzzy Local Information C Means Clustering Algorithm,” IEEE Trans. Image Process. Vol.19, No.5 , pp. 1328-1337,May 2012 [10] S.R.Kannan, S.Ramathilagam, R.Pandiyarajan and
A.Sathya, “ Fuzzy Clustering Approach in Classification of T1-T2 brain MRI,” Int. Journal of Recent Trends in Engineering, Vol2, No.1, pp. 157-160, Nov.2012.
[11] Amiya Halder and Nilavra Pathak, “An Evolutionary Dynamic Clustering Based Colour Image Classification”, International Journal of Image Processing (IJIP), Volume (4), Issue (6), pp. 549-556, 2011.