International Journal of Research (IJR)
e-ISSN: 2348-6848, p- ISSN: 2348-795X Volume 2, Issue 10, October 2015Available at http://internationaljournalofresearch.org
Performance Analysis of Voltage Sag Compensation Using Super
Conducting Fault Current Limiter for R & RL Loads
P.Ilaya Raja
M-tech Student Scholar Department of Electrical & Electronics Engineering, GLOBAL INSTITUTE OF
ENGINEERING & TECHNOLOGY,
Chilkur (V), Moinabad (M), R.R (dist) – 501504.T.S, India.
Sri. T V V Pavan Kumar
M.TECH (PHD) Associate Professor Department of Electrical & Electronics Engineering, GLOBAL
INSTITUTE OF ENGINEERING & TECHNOLOGY ,Chilkur (V), Moinabad (M), R.R (dist) – 501504;
T.S, India.
Abstract-
Potential fault current levels in power grids is
approaching, and may eventually exceed, the
short-circuit-current limits of existing protection
devices. Alternative to expensive system upgrades
of protection devices, Fault Current Limiters
(FCL’s) provide less cost solutions to prevent old
protection devices and other equipment on the
system from being damaged by excessive fault
currents. The proposed structure prevents voltage
sag and phase-angle jump of the substation PCC
after fault occurrence. This paper proposes a new
series type fault current limiter (FCL) that uses a
resistor in series with a inductor. The proposed
FCL is capable of limiting the fault current
magnitude near to the pre-fault magnitude of
distribution feeder current by placing the
mentioned resistor in the structure of the FCL.In
this paper, the improvement of the voltage sag is
analyzed according to the fault location, resistance
value of SFCL, and the length of the loop power
distribution system. First, a resistor-type SFCL
model is used using the MATLAB/SIMULINK.
Finally, when the SFCL is installed in the radial or
loop power distribution system with various
lengths, voltage sags are evaluated according to
various fault locations. The results of voltage sag
analysis in the loop system are compared with the
voltage sags in radial power distribution system. In
extension to the work discussed in paper the system
can be tested under different Loading conditions
and a
study on positioning of super conducting fault
current limiter can be analyzed.
Index Terms—Loop power distribution system;
superconducting fault current limiter (SFCL);
voltage sag
I. INTRODUCTION
In today circumstances, rapid development of power network cause the fault current of the system increased greatly. The levels of fault current in many places have often exceeded the withstand capacity of existing power system equipment. As implication to this matter; security, stability and reliability of power system will be negatively affected [1]. Thus, limiting the fault current of the power system to a safe level can greatly reduce the risk of failure to the power system equipment due to high fault current flowing through the system. Because of that, there is no surprise to fault current limiting technology has become a
hotspot of fault protection research since this technology can limit the fault current to a low level[2,3].
This huge short circuit current of higher capacity system is limited by fault current limiters which can be an alternative solution rather than replacing existing switchgear. High fault current can be limited to a level of highest designed short circuit current rating of presented switchgear. It creates a cost-effective way to improve the power system capacity keeping switchgear unchanged. Thus, the fault current limiter can be an
excellent technique to protect power system
International Journal of Research (IJR)
e-ISSN: 2348-6848, p- ISSN: 2348-795X Volume 2, Issue 10, October 2015Available at http://internationaljournalofresearch.org
system using the increased resistance caused by quenching characteristics of superconducting elements. In addition, SFCL can improve voltage quality not only in faulted phase but in non-faulted phase when a 1 phase to ground fault is occurred. The assessment method of voltage sag using the Information of Technology Industry Council curve is presented in Reference [1] when SFCL is applied to power distribution system. The parallel connection of radial systems via the SFCL which can make voltage dips less severe is presented in Reference [2].
The improvement of voltage sags caused by decreased fault current is presented in References [3] and [4]. These studies dealt with the voltage sags in the power distribution system with SFCL. However, voltage quality such as voltage sag and overvoltage in faulted and non-faulted phase has been not dealt with. The magnitude of sag, whereas it may worsen the duration of sag because of the delayed trip time of a protective device by the decreased fault current. These effects of SFCL on voltage sags should be evaluated. Also, power distribution system will be changed to loop system such as microgrid or smart grid. Thus, effects of SFCLs should be evaluated and analyzed when SFCLs are installed in radial and loop power distribution system according to the location and impedance of SFCL, the length of feeder, and location of fault. However, the overall effects on voltage sag were not dealt with in the above mentioned studies.
In this paper, we assess the impact of SFCL on voltage sags in radial and loop power distribution system. In Section II, we model a resistor-type SFCL. In Section III, the voltage sag occurred by fault current is explained. In Section IV, we evaluatethe voltage sag magnitude according to the fault location and resistance of SFCL in radial and loop power distribution system.
II RESISTIVE-TYPESFCL
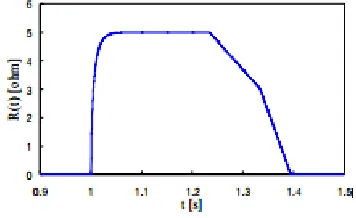
Many SFCL models have been developed. In this paper, we use resistive-type SFCL based on [1], [5]–[10] which represents the experimental studies for superconducting elements of SFCL being applied to Korean power distribution systems. The impedance of
SFCL according to time t is given at (1), where Rn and
TF represent the impedance being saturated at normal
temperature and time constant, respectively. In
addition, t0, t1, and t2 represent quench-starting time, the
first recovery-starting time, and the secondary recovery-starting time, respectively.
(1)
Fig. 1 represents quenching and recovery characteristics of the SFCL shown. When a reclosing scheme is 2 Fast 1 Delay (2F1D). When a fault is occurs in a power distribution system, the resistance of SFCL increases.
TABLE I
PARAMETERS OFMODELEDSFCL
If a recloser is tripped, SFCL is recovered. The scheme is repeated two times more. The used values for parameters are shown in Table I. The recovery time of SFCL is set to the value less than 0.5 s based on [9], because the reclosing time of power distribution system in Korea is 0.5 s.
III.VOLTAGE SAGS IN POWER DISTRIBUTION SYSTEM
International Journal of Research (IJR)
e-ISSN: 2348-6848, p- ISSN: 2348-795X Volume 2, Issue 10, October 2015Available at http://internationaljournalofresearch.org
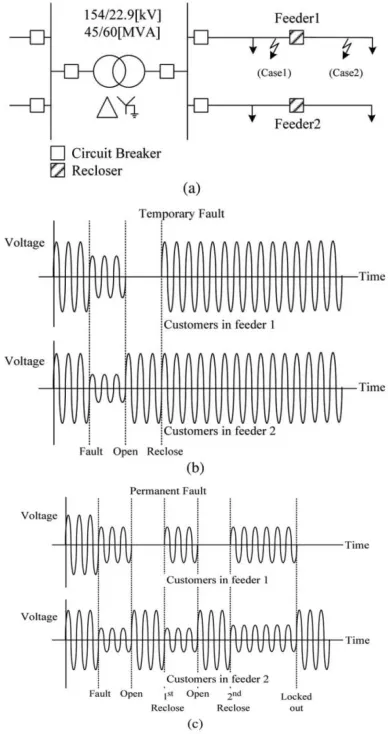
fault occurs between CB and recloser, the reclosing operation of the OCR of breaker will be successful and the momentary interruption will occur. In this case, the customers at feeder 1 (faulted feeder) will experience voltage sag and a momentary interruption. The customers at feeder 2 (neighbor feeder) will experience the voltage sag during the fast-trip time of the OCR and this is shown in Fig. 2(b).
However, if a permanent fault is occurs, the reclosing operations will be failed and the reclosing operation will be finally locked out. In this case, the customers in feeder 1 will experience three voltage sags, two momentary interruptions and a sustained interruption. The customers in feeder 2 will experience two voltage sags during the fast-trip time of OCR and one voltage sag during the delay-trip time of OCR when reclosing scheme of OCR is 1F1D; this is shown in Fig. 2(c).during a fault. In case 2 in Fig. 2(a), all sequences and phenomena is equal to that of case 1 such as the number of voltage sags, momentary interruptions, and sustained interruption except the fault clearing time of recloser instead of OCR. In other words, if a temporary fault is occurs, the customers at feeder 2 will experience the voltage sag during the fast-trip time of recloser instead of OCR, so on. As presented above, the automatic reclosing scheme in power distribution systems can produce various voltage sags to the customers on the neighbor feeder. Moreover, the number of neighbor feeder is about 6 to 10 while the number of faulted feeder is only one. Generally, a voltage magnitude at bus of secondary-side of main transformer (MTr.) during fault can be represented as equation (2) if fault impedance is ignored, a type of fault is 3-phase fault, and source voltage is 1.0 p.u.
(2)
Where Zsource, ZMTr, and Zline are source impedance, transformer impedance, and line impedance from source to faulted location, respectively. Equation (2), also, can approximately represent the voltage magnitude at customers on all neighbor feeders. In this paper, the voltage magnitude is focused than sag duration.
Fig. 2 Voltage sag in power distribution system d. (a) Power system configuration, (b) voltage sags of customers (temporary fault), and (c)
voltage sags of customers (permanent fault).
IV ASSESSMENT OF IMPACT OF SFCL ON VOLTAGE SAGS
If SFCL is installed at the starting point of feeder, (2) is changed to equation (3) during fault.
(3)
International Journal of Research (IJR)
e-ISSN: 2348-6848, p- ISSN: 2348-795X Volume 2, Issue 10, October 2015Available at http://internationaljournalofresearch.org
Fig. 3. Power distribution system model
TABLE II
POWER DISTRIBUTION SYSTEM DATA
TABLE III
CASES FOR VOLTAGE SAG SIMULATION
A. Power Distribution System Model
Fig.3 represents the power distribution system model with SFCL and interconnecting switch to simulate voltage sags. Table II shows the data of Fig. 3.
B. Case Studies
Total 10 cases of contingency analysis are studied as shown in Table III. Case 1-x is for radial distribution system and Case 2-x is for loop distribution system. The resistance of SFCL ranges from 0 to 2Ω and the fault location is 1 to 6 km. The length of feeder 2 varies 1 to 6 km at loop distribution system.
V. MATLAB/SIMULINK RESULTS
Here the simulation is carried out by different cases they are 1) Radial distribution system Fault location without and with SFCL 2) loop distribution system Fault location without and with SFCL 3) radial distribution system Fault location without and with SFCL of R and RLC loading conditions4)loop distribution system Fault location without and with SFCL of R and RLC loading conditions 5). With Series Type FCL System for Minimizing the Voltage Sag.
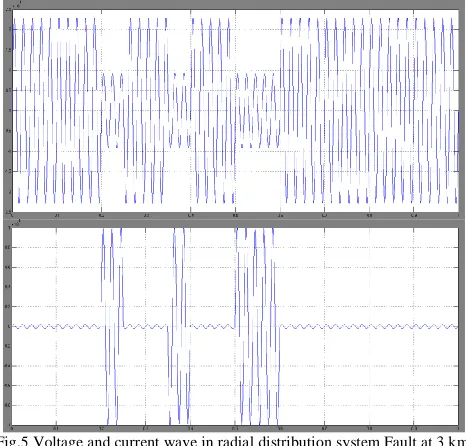
Case-1 Radial Distribution System Fault Location Without and With SFCL
Fig.4 Matlab/simulink model of radial distribution system Fault at 3 km location without SFCL
International Journal of Research (IJR)
e-ISSN: 2348-6848, p- ISSN: 2348-795X Volume 2, Issue 10, October 2015Available at http://internationaljournalofresearch.org
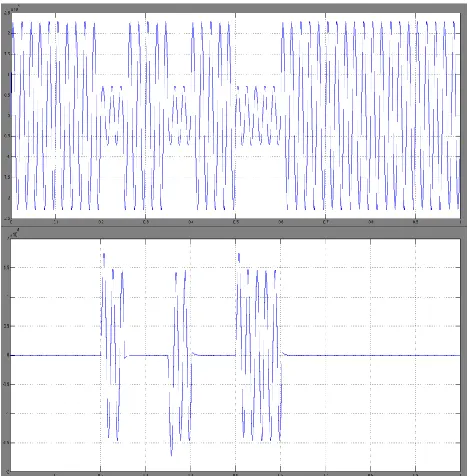
Fig.6 Matlab/simulink model of radial distribution system Fault at 3 km location with SFCL
Fig. 7 Voltage and current wave in radial distribution system fault at 3 km location with SFCL
Case-2 Loop Distribution System Fault Location Without and With SFCL
Fig.8 Matlab/simulink model of loop distribution system Fault location without SFCL
Fig.9 Voltage and current wave in loop distribution system Fault at 3 km location without SFCL
International Journal of Research (IJR)
e-ISSN: 2348-6848, p- ISSN: 2348-795X Volume 2, Issue 10, October 2015Available at http://internationaljournalofresearch.org
Fig. 11 Voltage and current wave in loop distribution system fault at 3 km location with SFCL
Case-3 Radial Distribution System Fault Location Without and With SFCL of R Load
Fig.12 Matlab/simulink model of radial distribution system fault location without SFCL of R load
Fig.13 Matlab/simulink model of radial distribution system fault location with SFCL of R load
Fig. 14 Voltage and current wave in radial distribution system fault at 3 km location with SFCL of R load
Case-4 Loop Distribution System Fault Location without SFCL Of R and RLC Loading Conditions
Fig.15 Matlab/simulink model of loop distribution system Fault location without SFCL of R load
Fig.16 Matlab/simulink model of loop distribution system Fault location without SFCL of RLC load
International Journal of Research (IJR)
e-ISSN: 2348-6848, p- ISSN: 2348-795X Volume 2, Issue 10, October 2015Available at http://internationaljournalofresearch.org
Case 5: With Series Type FCL System for Minimizing the Voltage Sag
(a) Model
(b) FCL Model
Fig.18 shows the Matlab/Simulink Model of Series Type FCL System for Minimizing the Voltage Sag
Fig.19 PCC Voltage
Fig.19 shows the PCC Voltage of Series Type FCL System for Minimizing the Voltage Sag.
VI. CONCLUSION
The simulations performed prove the method effectiveness, as well as the possibility of building the ‗FCL‘ with commercially available components. The main concept of this proposed converter is simulated at different loading conditions like R and RLC to check the performance of with and without SFCL conditions. The effect of SFCL on voltage sag is analyzed when a SFCL is installed to a radial and loop power distribution system. Firstly, resistor-type SFCL and radial/loop power distribution system are modeled. The simulation results found that the voltage sags at loop distribution system is mores ever than radial distribution system by the increased fault current. Moreover, the results of simulation represent the SFCL with bigger resistance is
needed to improve the voltage sags in loop system. These all results verified through Matlab/simulink software.
REFERENCES
[1] J.-F. Moon, S.-H. Lim, J.-C. Kim and S.-Y. Yun, ―Assessment of the impact of SFCL on voltage sags in power distribution system,‖ IEEE Trans. Appl. Supercond., vol. 21, no. 3, pp. 2161–2164, Jun. 2011. [2] L. Ye, L. Z. Lin, and K.-P. Juengst, ―Application studies of superconducting fault current limiters in electric power systems,‖ IEEE Trans. Appl. Supercond., vol. 12, no. 1, pp. 900–903, Mar. 2002. [3] J. C. Das, ―Limitations of fault-current limiters for expansion of electrical distribution systems,‖IEEE Trans. Ind. Appl., vol. 33, no. 4, pp. 1073– 1082, Jul./Aug. 1997.
[4] F. Tosato and S. Quaia, ―Reducing voltage sags through fault current limitation,‖ IEEE Trans. Power Del., vol. 16, no. 1, pp. 12–17, Jan. 2001.
[5] H.-R. Kim, H.-S. Choi, H.-R. Lim, I.-S. Kim and O.-B. Hyun, ―Resistance of superconducting fault current limiters based on YBa2Cu3O7 thin films after quench completion,‖ Phys. C, Supercond. Vol. 372– 376, pp. 1606–1609, Aug. 2002.
[6] S. H. Lim, S. R. Lee, H. S. Choi, and B. S. Han, ―Analysis of operational characteristics of flux-lock type SFCL combined with power compensator,‖IEEE Trans. Appl. Supercond., vol. 15, no. 2, pp. 131–134, Jun. 2005.
[7] H. R. Kim, S. W. Yim, S. Y. Oh, and O. B. Hyun, ―Recovery in superconducting fault current limiters at low applied voltages,‖IEEE Trans. Appl. Supercond., vol. 18, no. 2, pp. 656–659, Jun. 2008.
[8] H.-R. Kim, S.-W. Yim, S.-Y. Oh, and O.-B. Hyun, ―Analysis on recovery in Au/YBCO thin film meander lines,‖ Progr. Supercond. vol. 9, no. 1, pp. 119–125, 2007.
[9] J.-S. Kim, S.-H. Lim, J.-F. Moon et al., ―Analysis on the protective coordination on neutral line of main transformer in power distribution substation with superconducting fault current limiter,‖Trans. Korean Inst. Elect. Eng., vol. 58, no. 11, pp. 2089–2094, Nov. 2009.
[10] H. R. Kim, S. W. Yim, O. B. Hyunet al., ―Analysis on recovery characteristics of superconducting fault current limiters,‖ in Proc. MT-20 Conf. Magn. Technol., Philadelphia, PA, Aug. 27–31, 2007.