ISSN(Online): 2319-8753 ISSN (Print): 2347-6710
I
nternational
J
ournal of
I
nnovative
R
esearch in
S
cience,
E
ngineering and
T
echnology
(A High Impact Factor, Monthly, Peer Reviewed Journal) Visit: www.ijirset.com
Vol. 8, Issue 8, August 2019
Heart Disease Prediction using Data Mining
Technique
Deepika Pareek, Manish Tiwari, Dr. Mayank Patel, Dr. Amit Sinhal
Research Scholar (C.S.), GITS, Udaipur, Rajasthan, India
Assistant Professor (C.S.), GITS, Udaipur, Rajasthan, India
Professor (C.S.), GITS, Udaipur, Rajasthan, India
Professor and Head (C.S.), GITS, Udaipur,
ABSTRACT: ECG is the most common and basic test to run on patients to check any kind of anomalies in the heart. In the ECG result 10 to 20 minutes long continuous data of a patient’s heart is down sampled and printed as a 1D graph. We have develop a program which will take the continuous dataset from the ECG machine and analyses the data and extracts various features of the ECG wave. At first we decompose the data using Wavelet decomposition. Then the data is reconstructed in 4 levels which removes the noise from the signal. In the same time we detect major components of the ECG wave which is P wave, QRS complex and T wave. An electrocardiogram (ECG)is an important diagnostic tool for the assessment of cardiac arrhythmias in clinical routine. In this process, we introduce the a deep learning based convolution neural network framework, which is previously trained on a general signal data set is transferred to carry out automatic ECG arrhythmia diagnostics by classifying patient ECG’s into corresponding cardiac conditions. The Main focus of this process is to implement a simple, reliable and easily applicable deep learning technique for the classification of the selected two different cardiac categories conditions. The results demonstrated that the transferred deep learning classification cascaded with a conventional SVM were able to obtain very high performance rates. all this work has been performed by MATLAB simulation
KEYWORDS: SVM, NN, RF,KNN,CNN,ECG
I. INTRODUCTION
ISSN(Online): 2319-8753 ISSN (Print): 2347-6710
I
nternational
J
ournal of
I
nnovative
R
esearch in
S
cience,
E
ngineering and
T
echnology
(A High Impact Factor, Monthly, Peer Reviewed Journal) Visit: www.ijirset.com
Vol. 8, Issue 8, August 2019
Fig. 1. Action potential of cardiac muscle ([Edited from [9]).
ISSN(Online): 2319-8753 ISSN (Print): 2347-6710
I
nternational
J
ournal of
I
nnovative
R
esearch in
S
cience,
E
ngineering and
T
echnology
(A High Impact Factor, Monthly, Peer Reviewed Journal) Visit: www.ijirset.com
Vol. 8, Issue 8, August 2019
Fig.2 Generation of normal ECG signal ([Edited from [10])
II. RELATED WORK
ISSN(Online): 2319-8753 ISSN (Print): 2347-6710
I
nternational
J
ournal of
I
nnovative
R
esearch in
S
cience,
E
ngineering and
T
echnology
(A High Impact Factor, Monthly, Peer Reviewed Journal) Visit: www.ijirset.com
Vol. 8, Issue 8, August 2019
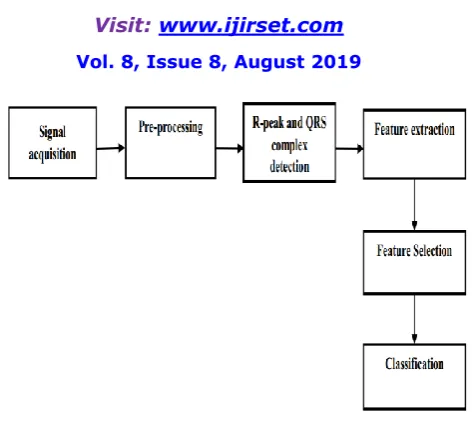
Fig. 3 proposed Block Diagram
III. PROPOSED APPROACH
In this process, we propose a deep arrhythmia-diagnosis method, base on four classification model, to automatically detect the abnormality of the heartbeats using the ECG signals. This classification model mainly consists of four convolution layers: two BLSTM layers and two fully connected layers. The datasets of RR intervals (called set A) and heartbeat sequences (P-QRS-T waves, called set B) are fed into the above-mentioned model. Most importantly, our proposed approach achieved favorable performances with an accuracy of 99.94% and 98.63% in the training and validation set of set A, respectively. In the testing set (unseen data sets), we obtained an accuracy of 96.59%, a sensitivity of 99.93%, and a specificity of 97.03%.The main advantage of the multi SVM compared to other classifiers is mainly on the reduction of the cross validation and post optimization functions.SVM produces better classification results comparing to other classifiers mainly due to the global optimization functions included.SVM has shown a good concert in classification
ISSN(Online): 2319-8753 ISSN (Print): 2347-6710
I
nternational
J
ournal of
I
nnovative
R
esearch in
S
cience,
E
ngineering and
T
echnology
(A High Impact Factor, Monthly, Peer Reviewed Journal) Visit: www.ijirset.com
Vol. 8, Issue 8, August 2019
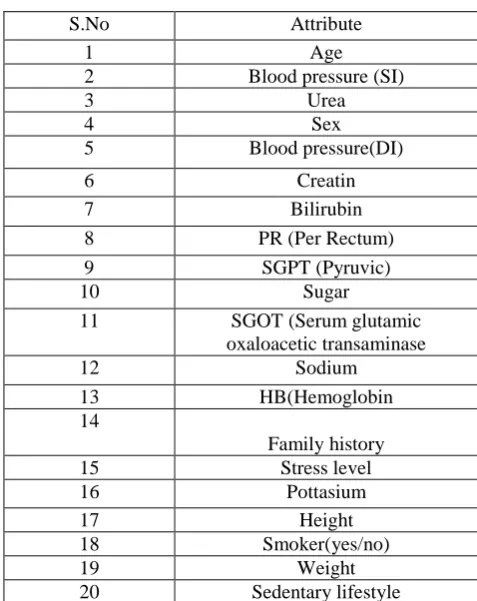
Table :1 Different Attributes
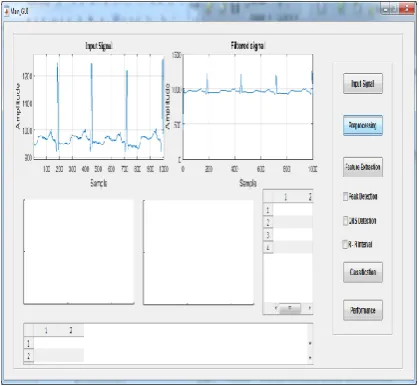
PREPROCESSING: Pre-processing means "preparation" of the sample/image to introduce it to an algorithm for specified task: tracking targets, recognition, feature extraction, etc.Data pre-processing is a data mining technique that involves transforming raw data into an understandable format. Real-world data is often incomplete, inconsistent, and/or lacking in certain behaviours or trends, and is likely to contain many errors. Data pre-processing is a proven method of resolving such issues. We can convert our data files(.xlsx) into .mat files and align the data. The purpose of optimization is to achieve the “best” design relative to a set of prioritized criteria or constraints. Selecting the suiting features are important to the mode land considerably influence the results. Quality and quantity of the features have great impact on whether the model is good or not. In order to improve the prediction model, different Data pre-processing techniques were applied Data integration is to combine data from multiple sources into a coherent store. In integration processing, the redundant data problem always occur, since the same real world entity, attribute values from different sources have different names, or one attribute may be a derived attribute in another table. Therefore, researchers should carefully identifyreal world entities from multiple data sources by using correlation analysis. Otherwise, careful integration of the data from multiple sources may help to reduce/avoid redundancies and inconsistencies and improve mining speed and quality [9].
DATA EXTRACTION: Data extraction means to analyze and scrutinize the data to retrieve relevant information from different data sources in a specific pattern. Here, the attributes are dentified for classifying process
S.No Attribute
1 Age
2 Blood pressure (SI)
3 Urea
4 Sex
5 Blood pressure(DI)
6 Creatin
7 Bilirubin
8 PR (Per Rectum)
9 SGPT (Pyruvic)
10 Sugar
11 SGOT (Serum glutamic
oxaloacetic transaminase
12 Sodium
13 HB(Hemoglobin
14
Family history
15 Stress level
16 Pottasium
17 Height
18 Smoker(yes/no)
19 Weight
ISSN(Online): 2319-8753 ISSN (Print): 2347-6710
I
nternational
J
ournal of
I
nnovative
R
esearch in
S
cience,
E
ngineering and
T
echnology
(A High Impact Factor, Monthly, Peer Reviewed Journal) Visit: www.ijirset.com
Vol. 8, Issue 8, August 2019
Fig. 5. Architecture Diagram
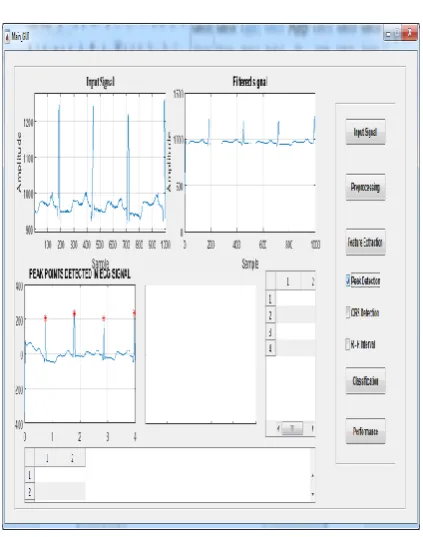
RECONSTRUCT SIGNAL: Extract the Coefficients after the transform while plotting the coefficients we observed that the frequency bands are separated and ca1, ca2, ca3 and ca4 are cleaner signal. But they will have less number of samples than the actual Signal due to down sampling. We can see that first signal resembles to the actual signal but has exactly one forth number of samples because the signal was decomposed in 4 levels. 2nd level has exactly half number of samples that of 1st level, 3rd level has exactly half number of samples than the 2nd level. Because the number of samples is reduced, such signals are also called down-sampled signal. It is clear that 2nd level decomposed data is noise free. Therefore we consider this signal as ideal ECG signal from which QRS must be detected. But the first R is located in 3rd level decomposition signal at approximately 40th sample whereas the same is located in the original signal at 260th location. Therefore once R peak is detected in 3rd level reconstructed signal, it must be cross validated in the actual signal.
ISSN(Online): 2319-8753 ISSN (Print): 2347-6710
I
nternational
J
ournal of
I
nnovative
R
esearch in
S
cience,
E
ngineering and
T
echnology
(A High Impact Factor, Monthly, Peer Reviewed Journal) Visit: www.ijirset.com
Vol. 8, Issue 8, August 2019
Figure 7 Reconstructed Signal
[c,l]=wavedec(s,4,'db4');
ca1=appcoef(c,l,'db4',1);
ca2=appcoef(c,l,'db4',2);
ca3=appcoef(c,l,'db4',3);
ca4=appcoef(c,l,'db4',4);
QT Interval Measured from beginning of QRS to end of T wave in the frontal plane
Normal: heart rate dependent (corrected QT = QTc= measured QT, sq-rootRR in seconds; upper limit for QTc = 0.44 sec)
Long QT Syndrome: "LQTS" (based on upper limits for heart rate; QTc≥ 0.47sec for males and ≥ 0.48 sec in females is diagnostic for hereditary LQTS in absence of other causes of increased QT)This abnormality may have important clinical implications since it usually indicates a state of increased vulnerability to malignant ventricular arrhythmias, syncope, and sudden death. The prototype arrhythmia of the Long QT Interval Syndromes (LQTS), a polymorphic ventricular tachycardia characterized by varying QRS morphology and amplitude around the is electric baseline. Causes of LQTS include the following:
ISSN(Online): 2319-8753 ISSN (Print): 2347-6710
I
nternational
J
ournal of
I
nnovative
R
esearch in
S
cience,
E
ngineering and
T
echnology
(A High Impact Factor, Monthly, Peer Reviewed Journal) Visit: www.ijirset.com
Vol. 8, Issue 8, August 2019
Hereditary LQTS (e.g., Romano-Ward Syndrome) Coronary Heart Disease (some post-MI patients)
No disease/ Healthy Heart
For a healthy heart the primary condition is:
ST Deviation/100 <
And for a perfect heart condition which is very rare includes these conditions:
PR Interval: 0.12 - 0.20s QRS Duration: 0.06 - 0.10s Heart Rate: 60 - 90 bpm
4.1.3 QRS Duration
Duration of QRS complex in frontal plane
Normal: 0.06 - 0.10s Prolonged QRS Duration:
QRS duration > 0.10s:
QRS duration 0.10 - 0.12s
Incomplete right or left bundle branch block
Nonspecific intraventricular conduction delay (IVCD) Some cases of left anterior or posterior fascicular block QRS duration ≥ 0.12s:
Complete RBBB or LBBB
Nonspecific IVCD
ISSN(Online): 2319-8753 ISSN (Print): 2347-6710
I
nternational
J
ournal of
I
nnovative
R
esearch in
S
cience,
E
ngineering and
T
echnology
(A High Impact Factor, Monthly, Peer Reviewed Journal) Visit: www.ijirset.com
Vol. 8, Issue 8, August 2019
ISSN(Online): 2319-8753 ISSN (Print): 2347-6710
I
nternational
J
ournal of
I
nnovative
R
esearch in
S
cience,
E
ngineering and
T
echnology
(A High Impact Factor, Monthly, Peer Reviewed Journal) Visit: www.ijirset.com
Vol. 8, Issue 8, August 2019
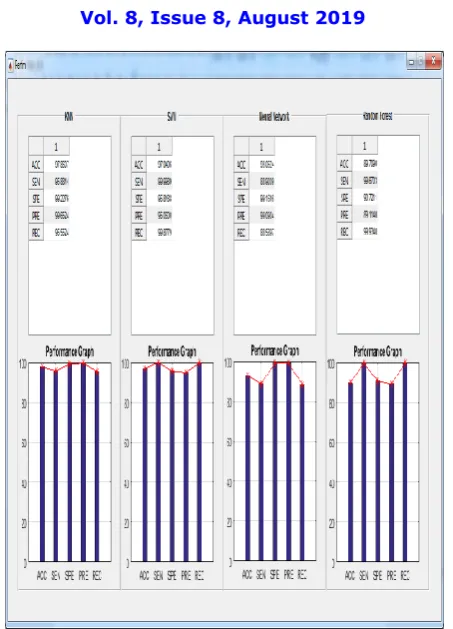
Fig. 10 classifier comparison graph
Table 2. Comparison Result
Clas sifie r
Previo us Work %
PROPOSED
Accur acy %
Sensitiv ity %
Specific ity %
Precisio n %
Recall %
SV M
85.88 97. 99.9 95.8 95.0 99.8
KN N
83.2 97.8 95.8 99.2 99.65 95.5
NN 92.21 93.0 88.9 99.1 99.09 88.0
RF 85.88
%
ISSN(Online): 2319-8753 ISSN (Print): 2347-6710
I
nternational
J
ournal of
I
nnovative
R
esearch in
S
cience,
E
ngineering and
T
echnology
(A High Impact Factor, Monthly, Peer Reviewed Journal) Visit: www.ijirset.com
Vol. 8, Issue 8, August 2019
IV. CONCLUSION
A novel ECG beat classification algorithms are proposed and the signals are taken from the data base. Provide a brief survey on ECG classification. The examination of the ECG has been comprehensively used for diagnosing many cardiac diseases. Various techniques and transformations have been proposed earlier in literature for ECG signal. This proposed provides an over view of Noise removal, Waveform detection and classification of the Heart rate. This also revealed a comparative table evaluating the performance of different algorithms that were proposed earlier for ECG signal. And also provide the problem of the existing work and gives the direction for this also. We noticed that the most of the work for the removal of noise they used combination of filters. Most of the uses QRS complex for heart rate classification the medical profiles twenty attributes are extracted such as age, blood pressure and blood sugar etc. to predict the likelihood of patient getting heart diseases. These attributes are fed in to SVM, Random forest, KNN, and ANN classification Algorithms in which SVM gave the best result with the highest accuracy. Valid performance is achieved using SVM algorithm in diagnosing heart diseases and can be further improved by increasing the number of attributes.
REFERENCES
1. Sayali Ambekar Rashmi Phalnikar Disease Risk Prediction by Using Convolution Neural Network978-1-5386-5257-2/18/$31.00 ©2018 IEEE Pune, India
2. Shraddha Subhash Shirsath, Prof. Shubhangi Patil Disease Prediction Using Machine Learn.Over Big Data”. I international Journal of Innovative Research in Science, Engineering and Technology, [2018]. ISSN (Online) : 2319-8753, ISSN (Print) : 2347-6710.
3. Vinitha S, Sweetlin S, Vinusha H, Sajini S. “Disease Prediction Using Machine Learning Over Big Data”. Computer Science & Engineering: An International Journal (CSEIJ), Vol.8, No.1, [2018].DOI: 10.5121/cseij.2018.8101Sayali Ambekar and Dr.Rashmi Phalnikar. “Disease Prediction by using Machine Learning”. International journal of computer engineering and applications, Volume XII, special issue, May 18. ISSN: 2321-3469.
4. Lohith S Y, Dr. Mohamed Rafi. “Prediction of Disease Using Learning over Big Data - Survey”. International Journal on Future Revolution in Computer Science & Communication Engineering. ISSN: 2454-4248.
5. J. Senthil Kumar, S. Appavu. “The Personalized Disease Prediction Care from Harm using Big Data Analytics in Healthcare”. Indian Journal of Science and Technology, vol 9(8), DOI: 10.17485/ijst/2016/v9i8/87846, [2016]. ISSN (Print): 0974-6846, ISSN (Online): 0974-5645 6. Gakwaya Nkundimana Joel, S. Manju Priya. “Improved Ant Colony on Feature Selection and Weighted Ensemble to Neural Network Based
Multimodal Disease Risk Prediction (WENN-MDRP) Classifier for Disease Prediction Over Big Data”. International Journal of Engineering & Technology, 7(3.27) (2018) 56-61.
7. Asadi Srinivasulu, S.Amrutha Valli, P.Hussainkhan, and P.Anitha. “A Survey on Disease Prediction in big data healthcare using extended convolutional neural network”. National conference on Emerging Trends in information, management and Engineering Sciences, [2018] 8. Stephen J.Mooney and Vikas Pejaver. “Big data in public health: Terminology, Machine Learning, and Privacy”, Annual Review of public
Health [2018].
9. Smriti Mukesh Singh, Dr. Dinesh B. Hanchate.“Improving Disease Prediction by Machine Learning”. eISSN: 2395-0056, p-ISSN:2395-0072. 10. Joseph, Nisha, and B. Senthil Kumar. "Top-K Competitor Trust Mining and Customer Behavior Investigation Using Data Mining
Technique."Journalof Network Communications and Emerging Technologies (JNCET) www. jncet. org 8.2 (2018).
11. Kumar, B. Senthil. "Adaptive Personalized Clinical Decision Support System Using Effective Data Mining Algorithms." Journal of Network Communications and Emerging Technologies JNCET) www. jncet. org 8.1 (2018).
12. Unnikrishnan, Asha, and B. Senthil Kumar. "Biosearch: A Domain Specific Energy Efficient Query Processing and Search Optimization in Healthcare Search Engine." Journal of Network Communications and Emerging Technologies (JNCET) www. jncet. org 8.1 (2017).
![Fig. 1. Action potential of cardiac muscle ([Edited from [9]).](https://thumb-us.123doks.com/thumbv2/123dok_us/1544456.1189464/2.595.194.409.186.397/fig-action-potential-cardiac-muscle-edited.webp)