11 | International Journal of Computer Systems, ISSN-(2394-1065), Vol. 06, Issue 01, March, 2019
A Heart Disease Prediction Model using Association Rule Mining Technique
Samradhi Mittal, Prof. Shraddha Kumar
Department of Computer Science and Engineering Sushila Devi Bansal College of Technology,
Indore, Madhya Pradesh , India
{Email: [email protected], [email protected]}
Abstract
The data mining is now days used for a number of applications in medical science for research and innovation. The main advantage of these methods is to reduce the human efforts for analyzing the large scale of data and discover the required application patterns. In this presented work the Heart disease prediction using the data mining technique is proposed for design and implementation. To perform this task the association rule mining technique is proposed with small modifications. This paper provides a formal survey about the different association rule mining algorithms and the recent contributions on this domain. In addition of that the Heart disease prediction model is also proposed for design.
Keywords: Association rule mining, Outlier detection, Apriori algorithm, Heart disease prediction, Rule based mining.
I. INTRODUCTION
Data mining is a process of extracting knowledge data from a large amount of database. There are different kinds and different verity of data available in a database. So if a user wants only that information which is useful for a particular purpose this can be done using data mining [1]. So here a problem arises how we can extract that information which is useful for us. To solve this problem there are numbers of an algorithm developed by data mining by which we can extract that information which is useful for us. There are different kinds of the database available in a system like the transactional database, relational database which contains a larger amount of information.
Sometimes it is also required to make the future prediction on the basis of present or past data. For e.g. in medical system user need to analyze different kinds of diseases on the basis of present and past scenario. In a market management system, a market manager needs to analysis the purchase behavior of the buyer. This kind of prediction can be done using Association Rule Mining algorithm.
Association Rule Mining:
Association rule mining is a technique of finding a frequent pattern and association rule between itemsets [2]. Association rules are the dependencies among the items i.e. how the one item is related to another foe e.g. in a super market if a customer buys a potato then it is likely to happen that he will buy tomato and onion. The transaction is a collection of items brought together. The goal of the ARM is to find frequent itemset. Then we can define the association between the items.
For e.g. Item-set A →Item-set B can be defined if both the item-set A and B is a frequent item-set. On the next
stage of ARM support and confidence is calculated. On the basis of support and confidence, those rules will be taken into consideration which will have high support and confidence value.
Methods of Association Rule Mining:
There are various methods of association rule mining some of them are apriori algorithm, FP-tree, and eclat.
1. Apriori Algorithm:
Apriori algorithm is a process of finding frequent item-sets and generate association rule from those item-set [3]. Once we find frequent item-sets then we will define an association between those item set. Support count and confidence count are the two parameters. For all item-sets, we calculate the value of support and confidence. The item sets which will satisfy the value of minimum support and confidence will be taken into consideration.
2. The FP-Growth Algorithm:
FP-Growth Algorithm finds frequent item-sets using an extended prefix tree structure call FP-Tree or frequent pattern tree. Support of each item-set is calculated and those item-sets will be taken into consideration which will have support greater than or equal to minimum support. In FP-Tree there is a root node labeled as a “null” with the set of item prefix sub trees as children. For each node consist of the three parameters Item-name, count, and Node-link. After the construction of FP-Tree, The complete set of a frequent pattern can be obtained.
3. Eclat:
calculates support count for each item set. And compare it with a threshold named “minsup”. Minsup is given by the user also called as support threshold. Eclat algorithm calls recursively. In each function call, it generates a new candidate pair. If a new candidate is frequent then it is added to the set.
II. BACKGROUND
The main motive of all the above three methods of association rule mining is to find the frequent patterns. Once we have the frequent pattern we can mine the association rules between the item sets. Using those association rules we can predict the future outcomes. For discovering different patterns all the three methods used a different approach. The efficiency of these algorithms depends on the user requirement and conditions.
A. Apriori Algorithm:
Consider a transactional database. Each transaction in a database consists of the set if items set. So in a number of transactions, we have to find a frequent pattern and to generate an association rule between them. We will generate the candidate set
Transaction Item Sets
1 A,B,C
2 A,C
3 A,D
4 B,F,E
Table 1: An example of transactions of items
Let us consider minimum support is 50% i.e. the support count of 2 which is calculated by the (support percent × no of transaction) and minimum confidence id 50%.
Step 1: Calculate support for each item and generate the candidate set
Transaction Support
{A} 3
{B} 2
{C} 2
{D} 1
{E} 1
{F} 1
Table 2: Generated candidate set
In the next step, we will take only those items which will have support count greater than or equals to 2.
Step 2: Generate a candidate set for the item A, B and C.
Transaction Support
{A,B} 1
{B,C} 1
{A,C} 2
Table 3: Generated candidate set
So in a candidate set {A, C} is the only pair which will have support count of 2. So we will not generate the next candidate set. It may be possible to generate more candidate set for other examples.
Step 3: Calculate association rule for the frequent item-set {A, C}.
Support
Rule ort Supp ce Confiden (%) Confidence
AC 2 .66 66%
CA 2 1 100%
Table 4: Generated Association Rules
Step 4: Compare the calculated confidence with the minimum confidence value Here both the rules have the confidence percent greater than the minimum confidence so we can say that if A and C is the two products then the user who buys the product a will also buys the product C with the probability.
B.FP- Growth Algorithm:
Consider the same transactions as shown in Table 1 with the same support count 2 and support percent 50%. In the FP-Growth algorithm, we don’t require confidence. In the FP-Growth algorithm, we have to calculate an FP-Tree. On the basis of FP-Tree association rules are generated.
Steps To generate FP-Tree;
Step 1: Calculate the support count for the each item This will be same as we obtain in Table 2.
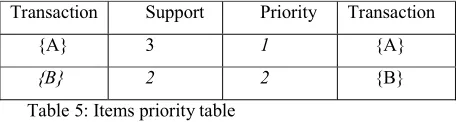
Step 2: Prioritize the items-
After calculating the support of the each item we will prioritize those filtered item which will have support count greater than or equals to 2. If the Two item have the same support count we will give the priority on the basis of FCFS (First Come First Serve).
Transaction Support Priority Transaction
{A} 3 1 {A}
{B} 2 2 {B}
Table 5: Items priority table
So we will have the order of the items {A: 3}, {B: 2}, {C: 2}.In the next step when we will generate ordered item set we will give A to the highest priority than B and so on.
which does not satisfy the value of minimum support. In our e.g., we are excluding the items D, E, F.
Transaction Item Sets Ordered
Items
1 A,B,C A,B,C
2 A,C A,C
3 A,D A
4 B,F,E B
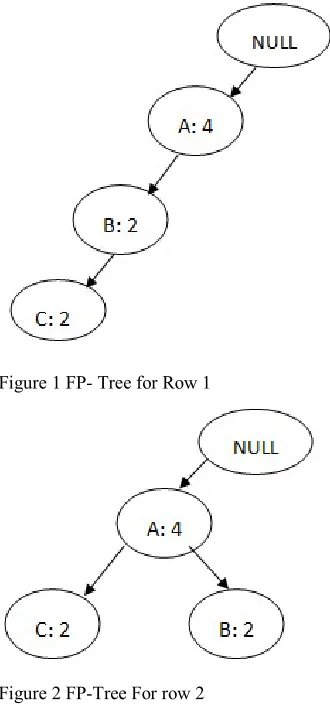
Table 6: Ordered Item Step 4: Generate FP-Tree
We have to repeats this step each row obtained in table 6 to generate an FP-Tree and in each iteration an item will is not present in the previous row are marked as a new node. If an item is present in a previous iteration, then we will decrease the count of an item by 1. The root node is always labeled as a null.
Figure 1 FP- Tree for Row 1
Figure 2 FP-Tree For row 2
After generating FP-Tree association rules are calculated on the basis of the breadth-first search. So in our e.g., we obtain an association rule {A, C} which means both the item A and C are the frequent item and relate to each other.
C.Eclat:
Consider the same transactions as shown in Table 7. In the Eclat algorithm, a frequent item-set is an item-set appearing in at least “minsup” transactions from the transaction database, where “minsup” is a parameter given by the user. Let us consider minsup = 2
Transaction Id Items
1 Bread, Butter , Jam
2 Butter ,Cake
3 Butter, Milk
4 Bread, Butter, Cake
5 Bread, Milk
6 Butter, Milk
7 Bread, Milk
8 Bread, Butter, Milk ,Jam
9 Bread, Butter, Milk
Table 7: Initial transaction
To find frequent item sets using Eclat algorithm we must follow below steps.
Step 1: Get transaction ID i.e. TID list for each item set. TID list of {a} is exactly the list of transactions containing {a}
Item Set TID set
Bread 1,4,5,7,8,9
Butter 1,2,3,4,6,8,9
Milk 3,5,6,7,8,9
Cock 2,4
Jam 1,8
Table 8: Frequent 1-Itemsets
Step 2: Intersect tid list of {a} with the tid lists of all other items, resulting in tid lists of {a, b}, {a, c}, {a, d},… = {a}-conditional database (if {a} removed)
Item Set TID Set
{Bread, Butter} 1,4,8,9
{Bread, Milk} 5,7,8,9
{Bread, Cock} 4
{Bread, Jam} 1,8
{Butter, Milk} 3,6,8,9
{Butter, Cock} 2,4
{Butter, Jam} 1,8
{Milk, Jam} 8
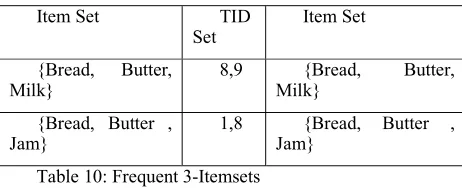
Step 3: Repeat from 1 on {a}-conditional database
Item Set TID
Set Item Set
{Bread, Butter,
Milk} 8,9 Milk} {Bread, Butter,
{Bread, Butter ,
Jam} 1,8 Jam} {Bread, Butter ,
Table 10: Frequent 3-Itemsets
Step 4: This process repeats, with k incremented by 1 each time, until no frequent items or no candidate item-sets can be found.
D.Outlier Detection
Outlier Detection is one of the major problems occurs in Data Mining; finding outliers from a collection of patterns is a popular problem in the field of data mining. An outlier is that pattern which is dissimilar with respect to all the remaining patterns in the data set [4]. An outlier can be caused due to incorrect entry, misreporting, sampling error or exceptional but true value. For e.g. it may be possible that the value 12.5 is miswritten as a 125. So this incorrect value can cause a huge difference in a data set.
For example in the scores 28, 29, 3, 32, 85, 30, 27, 28 both 3 and 85 are "outliers", because it deviates more from all the observations. 3 is an extremely small value and 85 is an extremely large value. There are various methods to detect outliners such as Z-score or extreme value analysis, probabilistic and statistical modeling, linear regression analysis, proximity-based models, information theory models.
Regression analysis is one of the most popular techniques of finding outliners. In this, a regression equation is used. Once we have regression equation we will plot a graph in this graph we have two variables one is a dependent variable and another is an independent variable. So for the different value of an independent variable value of the dependent variable is calculated. The equation where Y is a dependent variable and X is the independent variable, b is slop of the line and a is Y-intercept.
III. LITERATURE SURVEY
This section provides the details about the key contributions which are usages the techniques for association rule mining for different application areas.
Pandya Jalpa P and Morena Rustom D [1] have presented a survey on different application areas of Association Rule Mining. They have done a survey of various research papers associated with real-life application line stock marker, health care, Supermarket etc. various ARM algorithms are applied to the different applications area by the different researchers. Their motive is to find recent issues and technique used in different applications areas. After the survey of many paper authors analyzed that the researcher should be a focus on the methods of ARM as well as the results obtained from the methods. The main
steps required by the research is a dataset of any one domain, method or algorithm to apply, do the research and experiments, get the result and analyses them and do the comparative study based on the performance criteria like execution time, memory requirement, database scan, the data structure used etc. The researcher can apply the existing algorithm or improve existing algorithm by removing its drawbacks.
Charanjeet Kaur [2] presented a survey on the association rule mining using apriori algorithm. Apriori algorithm is one the most used technique of finding frequent item-sets. An author surveyed recent research paper. The author describes the ARM method in detail, the Apriori algorithm with an example of the supermarket. Rule generation in apriori algorithm. The author gives a brief idea of how the apriori algorithm is beneficial for a different purpose and how we can find the relationship among the different objects. After the survey of many research papers author analyzed that association rule mining is still in a stage of exploration and development. There are still some essential issues that need to be analyzed for identifying useful association rules. The author concludes that more research is needed to find frequent pattern, more efficient method should be proposed, single scan method should be developed, database independent measurement should be established, new application areas should be explored.
Mohammed Al-Maolegi and Bassam Arkok [3] present an improved apriori algorithm for finding association rules. Authors indicate the limitation of original apriori algorithm of wasting time for scanning the whole database searching on the frequent itemsets and present an improvement on Apriori by reducing that wasted time The main aim of an improved apriori algorithm is to reduce the time consumed by the traditional apriori algorithm considering several transactions. Their improved algorithm is very time and space efficient. Their improved Apriori reduces the time consuming by 67.38% and the time consumed to generate candidate support count in their improved apriori is less than the time consumed in the original Apriori. Along with these authors also focus on reducing the time required in transaction scanning. The authors also compare the original apriori algorithm with the improved algorithm and plot a graph. A comparison table has been made which shows the difference between the times consumed by both algorithms.
Krishna Modi and Prof Bhavesh Oza [4] presents an outlier analysis approach in data mining, In this work authors, give an introduction to outlier analysis and the problems occur due to outliers. They give different types of outliner and methods to detect outliers. They introduce various applications where outlier analysis is required. Authors give a brief idea of the types of outliers, different approaches of outliers with an example, the comparison between different methods including advantages disadvantages and applications of each algorithm. The main objective is to review various outlier detection methods and to study how the techniques are categorized. On the basis of the type of data involved outliner detection method is selected.
authors is to analyze the behavior of the market, changing trends in market behavior using changes happening in data. The aim of the MBA is to examine the customer behavior and assists in increasing the sales. Apriori algorithm is applied to the number of items present in a transactional database to find the frequent item-sets. Frequent items are the items which are brought mostly. This also helps in generating the association rules between the two or more than two items to find likely purchase behavior. They observe the purchase behavior of the last 4-month transaction. They focus on the Predicting future association rules as well as give us the right methodology to find out outliers. Authors suggested that some areas are still there which need to be focused on.
IV. PROPOSED WORK
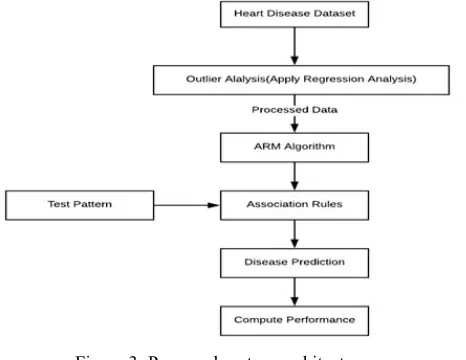
The proposed work is motivated from a research article [5]. In this work, author used ARM-Predictor algorithm to generate association rules for the analysis of market trends. In this work, a transactional database is taken and association rules are generated which predict the purchase of the buyer for increasing the sales. Therefore in this presented work for finding the applicability of the given algorithm in other applications, the ARM-Predictor Algorithm is proposed for the heart disease prediction application. ARM algorithm is applied to a medical dataset which will give the probability of heart disease in a user. The proposed system architecture is demonstrated using figure 3. In this diagram, the main aim is to process the association rule from the heart disease dataset. In the first step, the heart disease data is accepted as input. In the second step, outliers are removed using regression analysis so that we can get the most effective and filtered data to get association rules. To detect outliners the technique of linear regression is also implemented to keep fit solution development. Using the generated association rules the prediction for a test input pattern is performed. After prediction using both the techniques different performance parameters are computed and compared.
Figure 3: Proposed system architecture
In Regression analysis, we have to make an equation that fit in date. After making the regression equation we will make the prediction. Linear analysis is one of the most
popular types of regression analysis. In this, we have the coefficients which show the prediction of the future. A graph is plotted which will have two axis. The line is likely to appear to be a straight line. As we know the equation for a line is . To calculate linear regression, and find the equation .
Linear regression shows the relationship between two variables. We can also consider the equation as the slope formula. The equation has the form , where Y is the dependent variable (that’s the variable that goes on the Y axis), X is the independent variable (i.e. it is plotted on the X axis), b is the slope of the line and a is the y-intercept.
V. CONCLUSION&FUTUREWORK The proposed work is motivated for design and implementation of an accurate and efficient Heart disease prediction system. In this context the association rule mining techniques are used for target system design and implementation. In this presented work first the different association rule mining algorithms are studied, additionally for improving the performance of association rule mining the outlier detection technique is also investigated. In further the recent contributions of association rule mining in different domain of applications are studied. Based on observations and different approach a promising data model is introduced in this work. That technique is implemented in near future and their performance analysis and comparative study with the similar association rule mining technique is proposed.
REFERENCES
[1] Pandya Jalpa P, MorenaRustom D “A Survey on Association Rule Mining Algorithms Used in Different Application Areas” International Journal of Advanced Research in Computer Science Volume 8, No. 5, May-June 2017.
[2] Charanjeet Kaur “Association Rule Mining using Apriori Algorithm: A Survey” International Journal of Advanced Research in Computer Engineering & Technology (IJARCET) Volume 2, Issue 6, June 2013
[3] Mohammed Al-Maolegi, Bassam Arkok “An Improved Apriori Algorithm for Association Rules” International Journal on Natural Language Computing (IJNLC) Vol. 3, No.1, February 2014 [4] Krishna Modi, Prof Bhavesh Oza “Outlier Analysis Approaches in
Data Mining” IJIRT Volume 3 Issue 7 December 2016.
[5] Manpreet Kau, Shivani Kang “Market Basket Analysis: Identify the changing trends of market data using association rule mining” International Conference on Computational Modeling and Security (CMS 2016).
[6] Pazhanikumar kolappan, Permal Arumuga “Association Rule mining and Medical Application: A Detail Survey” International Journal of Computer Applications- October 2013.
[8] B.Santhosh Kumar, K.V.Rukmani “Implementation of Web Usage Mining Using APRIORI and FP Growth Algorithms” Int. J. of Advanced Networking and Applications400 Volume:01 (2010). [9] Rajeshri Shelke "Data Mining For Supermarket Sale Analysis
Using Association Rule" International Journal of Trend in Scientific Research and Development (ijtsrd) Volume-1 June 2017. [10] Lei Chen “The Research of Data Mining Algorithm Based on