Efficient, Low - Cost Plant Growth Canopy
Analyzer Using Image Processing for
Technical Purpose
Vaishnavi Mande, Shruti Wandre
Final year Engineering Student, Dept. of Electronics and Telecommunication, Yeshwantrao Chavan College of
Engineering, Nagpur, India
Research Fellow, Jigyasa Research and Development Centre, Nagpur, India
ABSTRACT: For decades, farming has been associated with the production of essential food crops. Farming plays a critical role in the entire life of a given economy as well as backbone of economic system of a given country. In addition to providing food and raw material, farming also provides employment opportunities to very large percentage of population. But it is not always possible to have control over calamities which possess a threat to farming.
Because of no availability of instant help losses in farming occur on a large scale.
The Natural Resources Conservation Service (NRCS) is the U.S. Department of Agriculture's principal agency for providing conservation technical assistance to private landowners, conservation districts, tribes, and other organizations. There are many laboratories which provide assistance based on sample send to the lab. But in a country like India, where it is practically not possible for small farmer to send sample to laboratory and wait for the results. In today’s era it is not always possible to physically transport plants to laboratories for their analysis. Hence Digital
Image Processing becomes a convenient method to overcome these problems. By using the image processing
techniques, we can make the work much easier not only for now, but also for the future when there will be more data and more work to do on the images. According to the Government of India ,over 70% population of Indians deals in farming. Per hundred billion square, the number of laboratories which analyze crops of farmers need to be developed
.
KEYWORDS: Calamities, Digital Image Processing, conservation, laboratories
I. INTRODUCTION
In temperate zones sunlight is one of the most deciding factors in the growth of seedlings and regeneration. It also determines the cover and composition of herbaceous species which differ in their functional responses to light
conditions
.
Source http://www.air-worldwide.com/Publications/AIR-Currents/2014/Crop-Megadisaster-in-China--Are-You-Prepared-/
All though, it is impossible to predict natural disasters, farmers in india need immediate help after any such disaster. Here digital image processing can provide first level of suggestions and immediate paln of action a farmer should adopt to save his crop
.
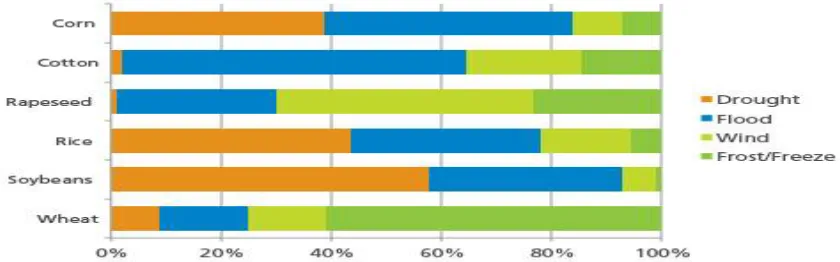
Fig 2: Losses due to pests in India
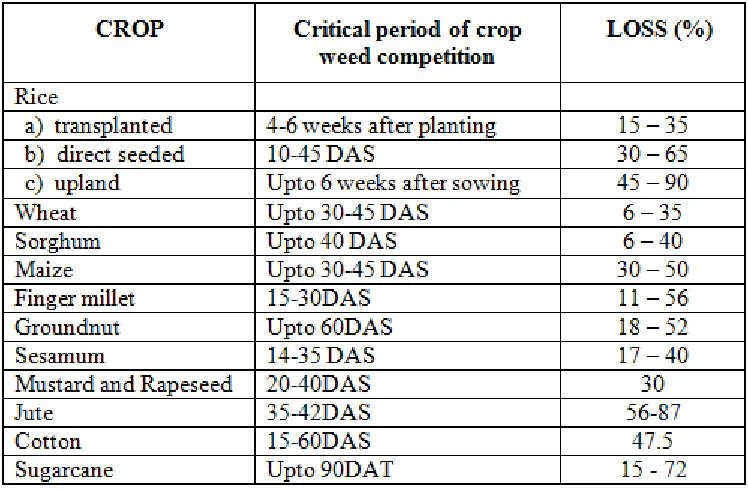
Fig 3: Losses due to weeds in different crops in India.
In recent years a number of instruments have been developed in order to directly determine the growth of plant canopies. Hence in this project we are trying to use digital image processing to determine the plant growth rate, leaf area index estimation etc. Digital image processing as a low cost approach shows a good potential to determine crop parameters. From such sensor systems not sufficient information are available for an objective comparative assessment in the case of LAI determination. Therefore, the objective of the current study was to compare performance of different crop sensors to assess the LAI of winter wheat. In addition, the potential of vegetation indices derived from digital image processing for this purpose was investigated. Digital Image Processing is an efficient , fast and convenient way to measure the plant parameters. Due to recent innovations in the field of science and technology the use image processing stretches far and wide. This method is very convenient for farmers since it gives them helps them in getting direct support from technical team.
II.RELATED WORK
1.Estimating leaf area index in different types of mature forest stands : Leaf area Index was first estimated at 15 sites using two different techniques. (a). Automatic thresholding taking given values of picture into account.(b).
Implementation of several equations to solve gap fraction inversion model froestimates.
2. Methods with forest canopy research: Problems assosciated with access and the lack of tools and methods suitable for monitoring complex bioscopes made canopy analysis difficult methods. It addresses how to replicate experiments in challenging environment and lay the foundation for creating standardized measurements.
3. Integrated method for forest canopy cover mapping using landsat ETMT imagery: This study represents a unique way to estimate forest canopy cover by using support vector machines approach method. SVM implies a simple linear method to the data but in a high dimensional feature space non-linearly related to the input space.
4. Comparative analysis in methodologies used to measure forest canopy gaps in the root river floodplain forest: Canopy gaps in an upper floodplain pot were measured as a part of a songbird nest-site selectivity study. Two methods of measuring floodplain forest canopy are to use ground crew to sweep the plot and record spatial and botanical information of canopy gaps greater than 10m in diameter.
III.METHODOLOGY
In this digital image processing project we have developed a system which caters to the problems faced by farmers pertaining to plant growth. We have developed a hardware with canopy fittings around the cage. This is done so as to get side view and top view of plants. It’s of critical importance that maximum dimensions of plants be analyzed. The cage should be kept covered with consistent brightness. All these parameters come into play while analyzingplant species. We have identified around 100 plants as specimens. Different kinds of plants with different characteristics ,different growth spurt needs to be taken into account. We fixed a specific time of the day to analyze plants to observe reactions of different plants at a particular time of day. Cover the cage. Now start taking snapshots of plants from different angles. Send the snapshots to lab for analysis and get the required results.
Fig 4: Snapshots of plants
IV. ALGORITHM
1.Develop a hardware cage with canopy fitting to get side view and top view of plant.
2.The cage must be kept covered all the time to get consistent luminance. 3.Identify around 100 plants per specimen to analyze their characteristics. 4.Fix a specific time of day to keep a tab on plant growth.
5.Place the cage on plant and take snapshots. 6.Send the snapshots to lab for analysis. 7.Get the report.
Fig 5 : Top View of Imaging Apparatus Fig 6 : Top View of Imaging Apparatus
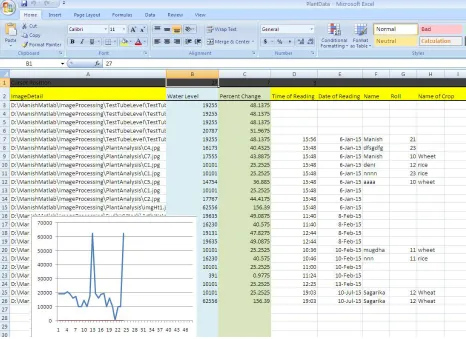
Fig 7 : Sample data in Excel sheet gathered by our system
In plant physiology, RGR (Relative Growth Rate) is a measure used to quantify the speed of plant growth. It is measured as the mass increase per aboveground biomass per day, for example as g g−1 d−1. It is considered to be the most widely used way of estimating plant growth, but has been criticised as calculations typically involve the destructive harvest of plants.[2] Another problem is that RGR nearly always decreases over time as the biomass of a plant increases, but traditionally this has been ignored when modelling plant growth. The RGR decreases for several reasons - non-photosynthetic biomass (roots and stems) increases, the top leaves of a plant begin to shade lower leaves and soil nutrients can become limiting. Overall, respiration scales with total biomass, but photosynthesis only scales with photosynthetic biomass and as a result biomass accumulates more slowly as total biomass increases.[3] The RGR of trees in particular slow with increasing size due in part to the large allocation to structural material of the trunk required to hold photosynthetic material up in the canopy. A novel
approach to separate size
effects from intrinsic growth differences is implemented and described in detail in Philipson et al. (2012).[4]RGR is calculated using the following equation:[2]
Where:
= natural logarithm
= time one (in days) = time two (in days)
= Dry weight of plant at time two (in grams
)
V.
FLOWCHARTVI.
VII. RESULTS AND SIMULATION
The figure given below describes the rate of increase in number of pigments in plants versus the number of days in which the given plant was put under observation. It can be seen from the graph that there were certain fluctuations regarding characteristics of plants. It was found that the increase in number of days corresponded to increase in number of pigments of plant.
Develop the hardware
Do the canopy fittings to get the side view and top view of plants
plants
Identify 100 plants as specimens
Check on specific time of day
Take snapshots of plants and send report to lab
Get the report
Fig 8: Graph of rate of increase in number of pigments in plants
Fig 9: Graph of rate of increase in height of plant
The above figure fig.9 depicts the rate of increase in height of plants versus the number of days. It can be deciphered that as the number of days increases the height of plant also increases. The increase in number of days is directly proportional to the increase in height of plants.
VIII. CONCLUSION AND FUTURE WORK
Hence we have studied an efficient and easy method to determie growth characteristics and productivity of different plants. This method especially proves to be beneficial in rural areas where means of communication are scarce and farmers find it hard to get immediate results. This method is less time consuming and gives immediate results. From economic point of view as well it is beneficial.
0 5 10 15 20 25 30 35
0 10 20 30
H
e
ig
h
t(
cm
)
Number of Days
Growth of Plant Height in
cm
REFERENCES
1. LAI-2200 Plant Canopy Analyzer-LI-COR Environmental – LI-COR Biosciences https://www.licor.com>env>leaf_area
2. LAI-2200C Plant Canopy Analyzer- LI-COR Environmental https://www.licor.com>env>leaf_area
3. SunScan Canopy Analysis- Canopy Analyser-LAI-PAR-Delta-T Devices www.delta-t.co.uk>product-display
4. CI-110 Plant Canopy Imager-CID https://www.cid-inc.com>products>leaf-area
5. Plant Canopy Analyzer https://www.virtualweb.co.in>assets>docs>LF_PLANT
6. Estimating leaf Area Index in different mature forest lands https://www.link.springer.com
7. Methods in forest canopy research https://www.ucpress.edu/book
8. The plants of the rainforest https://www.caltech.edu
9. Floodplain forest https://dnr.wi.gov