O R I G I N A L R E S E A R C H
Frequency-Speci
fi
c Abnormalities Of Functional
Homotopy In Alcohol Dependence: A Resting-State
Functional Magnetic Resonance Imaging Study
This article was published in the following Dove Press journal: Neuropsychiatric Disease and Treatment
Linghong Guo1
Fuqing Zhou 1
Ning Zhang1
Hongmei Kuang1
Zhen Feng2
1Department of Radiology, The First
Affiliated Hospital of Nanchang University, Nanchang, Jiangxi Province, People’s Republic of China;2Department
of Rehabilitation Medicine, The First Affiliated Hospital of Nanchang University, Nanchang, Jiangxi Province, People’s Republic of China
Purpose:Alcohol dependence (AD) is a relapsing mental disorder, typically occurring with concurrent tobacco misuse. Studies have reported disruption of the structural connectivity between hemispheres in the brain of individuals with AD. However, alterations in interhemi-spheric interactions and the specificity of frequency bands in individuals with AD remain unknown. Voxel-mirrored homotopic connectivity (VMHC) allows examination of functional interactions between mirrored interhemispheric voxels. Here, we use VMHC to investigate homotopic connectivity in AD and alcohol and nicotine co-dependence (AND) subjects.
Patients and methods: VMHC and seed-based functional connectivity (FC) in 24 AD, 30 AND, and 35 sex-, age-, and education-matched healthy control (HC) subjects were calculated for different frequency bands (slow-5, slow-4, and typical bands).
Results: Individuals with AD demonstrated significantly reduced VMHC in bilateral cere-bellum posterior lobe (CPL) and increased VMHC in bilateral middle frontal gyrus (MFG) compared to that in HCs in the typical and slow-4 bands; higher VMHC in the MFG was positively correlated with the dependence-severity score. In all bands of the VMHC analysis, no significant differences were found between the AND and other groups. Subsequent seed-based FC analysis demonstrated all regions with abnormal VMHC exhibited altered FC with its counterpart in the contralateral hemisphere in the typical and slow-4 frequency bands. The FC value between bilateral CPL within AD subjects negatively correlated with alcohol intake.
Conclusion: Our findings provide further evidence of the role of disruptions within the brain circuitry supporting cognitive control in the development of AD. Alterations in neural activities in the CPL and MFG might be a biomarker of dependence severity in AD patients as assessed using clinical questionnaire and features. Because of the frequency specificity in VMHC, we must consider frequency effects in future AD functional magnetic resonance imaging studies.
Keywords: alcohol, dependence, homotopic connectivity, frequency band, resting-state fMRI
Introduction
Alcohol dependence (AD) is a mental disorder characterized by continued alcohol seeking and consumption despite significant adverse consequences.1Globally, AD occurs in 2.6% of people aged≥15 years old, and the harmful use of alcohol results in a large burden of disease and injury, leading to more than 3 million deaths in 2016.2 In addition to alcohol, the concurrent use of other substances, especially tobacco, is also prevalent.3–6 Recently, it has been estimated that over 80% of
Correspondence: Zhen Feng
Department of Rehabilitation Medicine, The First Affiliated Hospital of Nanchang University, Number 17, Yongwaizheng Street, Donghu District, Nanchang 330006, Jiangxi Province, People’s Republic of China
Tel/Fax +86-791-88698601 Email [email protected]
Neuropsychiatric Disease and Treatment
Dove
press
open access to scientific and medical research
Open Access Full Text Article
Neuropsychiatric Disease and Treatment downloaded from https://www.dovepress.com/ by 118.70.13.36 on 25-Aug-2020
individuals with AD also smoked heavily, and about 30% of smokers are alcoholics.7 Alcohol and nicotine co-dependence may exacerbate the health effects of either substance alone.8 Thus, when studying individuals with AD-related changes in the brain, considering the effects of nicotine is necessary. Some individuals with AD man-ifest cognitive deficits, including inattention and impaired judgement and executive functions.9However, the neuro-biological underpinnings of these deficits are incompletely understood. With the rapid development of neuroimaging techniques, structural and functional brain imaging enables the exploration of the neuromechanisms of AD in vivo.
Neuroimaging Findings In AD
Plentiful morphometric magnetic resonance imaging (MRI) studies have demonstrated decreases in gray and white matter volume in individuals with AD in several brain regions (eg, dorsolateral frontal cortex, temporal cortex, and cerebellum) when compared with that in healthy con-trols (HCs).10,11 Diffusion tensor imaging (DTI) studies have shown that individuals with AD have lower white matter integrity in bundles running between the midbrain and pons compared to that in HCs.12Our previous resting-state functional MRI (rsfMRI) study showed individuals with AD exhibited different degree centrality values in widespread left lateralization brain areas compared to those in HCs.13 Aberrant regional brain activities were also detected in individuals with AD.14
Executive Control-Related Structures In
AD
Functional neuroimaging studies have reported the important role of the executive control network (ECN),15 which includes portions of the lateral prefrontal cortex and parietal cortex, in substance dependence. This network is associated with cognitive control;15 damage to the ECN will result in reduced executive control function and loss of control over drug use despite adverse consequences.16 Weaker within-network connectivity was detected in the ECN in individuals with AD compared to that in HCs,17while higher connectiv-ity within the ECN was found in abstinent AD patients,18,19 indicating an adaptive mechanism during abstinence. In addi-tion to the ECN, extensive neuroimaging and neuropatholo-gical studies have reported abnormalities in brain morphology,20white matter structure,12,21neurochemistry,22 and neural activation23 in the frontocerebellar circuitry of
individuals with AD, another important structure involved in executive control function.
Homotopic Connectivity Analysis
In a study of alcoholics, DTI measures of the corpus callosum were correlated with behavioral measurements referring to interhemispheric information transfer, refl ect-ing that disruption of the microstructural integrity of the corpus callosum affects the efficiency of interhemispheric processing.24 Furthermore, Jansen et al25 reported higher connectivity between the left and right cognitive control networks in individuals with AD compared with that in HCs. Those results indicate that interhemispheric interac-tions in AD could be abnormal, which is important for the integrity of brain function. Functional homotopy, the high degree of synchrony in spontaneous fMRI signalfl uctua-tions between geometrically symmetric interhemispheric regions, is a key characteristic of the brain’s intrinsic functional architecture.26Based on this feature, homotopic connectivity may provide a sensitive indicator of the effects of alcohol exposure on the functional architecture of brain. Voxel-mirrored homotopic connectivity (VMHC) is an approach to quantify the homotopic connectivity between each voxel in one hemisphere and its mirrored counterpart in the contralateral hemisphere.27 Several stu-dies have already shown decreased VMHC values in some regions of cocaine28 and nicotine29 dependent patients. Therefore, we hypothesize that the VMHC values in indi-viduals with AD will also be aberrant.
Multi-Frequency Band Analysis
The neuronal network demonstrated several oscillatory bands from 0.05 to 500 Hz,30 and those were linked with input selection, binding, synaptic plasticity, and consolidation of information.30 Based on the above framework, Zuo et al31 divided the frequency bands into slow-5 (0.01–0.027 Hz), slow-4 (0.027–0.073 Hz), slow-3 (0.073–0.198 Hz), and slow-2 (0.198–0.25 Hz) in a study of amplitude of low-fre-quency oscillation (LFO). They found significant slow-4 and slow-5 oscillations were primarily detected within the gray matter, while slow-3 and slow-2 oscillations were primarily restricted to the white matter. Additionally, they observed that the fractional amplitude of low-frequencyfluctuations in slow-4 and slow-5 differed between some regions.31Another study noted that functional connectivity in cortical networks is domi-nated by ultra-low frequencies (0.01–0.06), whereas that in limbic networks is found in frequency ranges up to 0.14 Hz.32 In other words, thosefindings imply that multiple spontaneous
Neuropsychiatric Disease and Treatment downloaded from https://www.dovepress.com/ by 118.70.13.36 on 25-Aug-2020
oscillations coexist during the resting state, which may have specific frequency characteristics within different brain regions;32therefore, it is necessary to consider multiple fre-quencies as factors in resting-state fMRI studies. Because slow 4–5 frequency bands (0.01–0.1 Hz) contribute to resting-state functional connectivity and slow 2–3 are responsible for respiratory and aliased cardiac signals,33 we only studied slow-5 and slow-4 bands in this study. The distinct fre-quency-specific features in LFO have already been observed in several diseases, such as internet addiction disorder,34major depressive disorder,35 and social anxiety disorder.36 Apart from the amplitude of oscillations, local connectivity,37,38 dis-tant connectivity,39and networks32,40also showed frequency-dependent properties. Thus, in view of the effects of frequency in the blood oxygen level-dependent (BOLD) signal, it is necessary to examine the VMHC in individuals with AD using different frequency bands.
The Aims And Hypothesis
The aims of the present study were to examine whether individuals with AD exhibit abnormal VMHC compared to that of HCs, and whether those abnormalities have frequency-specific features. We hypothesized that com-pared to HCs, individuals with AD will exhibit VMHC impairments in the nodes of control-function related areas, such as the ECN or frontocerebellar circuitry, in our study. In addition, because slow-4 has been reported to be more sensitive in previous studies,41 we hypothesized that any VMHC changes will be found more often in the slow-4 band. Furthermore, we also hypothesized that the altered VMHC in individuals with AD will be related to the severity of alcohol dependence.13
Materials And Methods
Subjects
From 2012 to 2019, 25 AD subjects (24 men; mean age 50.2±9.6 years), 30 alcohol and nicotine co-dependent (AND) subjects (30 men; mean age 50.4±8.5 years), and 35 sex-, age-, and education-matched (34 men; mean age 47.4±9.8 years) HCs participated in the study. All AD and AND subjects were recruited from the Department of Psychiatry at the First Affiliated Hospital of Nanchang University, whereas the HCs were recruited from the local community. The inclusion criteria for the AD or AND group were as follows: 1) met the diagnostic criteria of alcohol dependence (for AD) or alcohol and nicotine co-dependence (for AND) as defined by the Diagnostic
and Statistical Manual of Mental Disorders, 4th Edition (DSM-IV);12) no history of psychoactive medication use; 3) no history of other substance abuse or dependence, eg, cocaine, marijuana; and 4) no history of other psychiatric disorders, eg, depression, insomnia, and anxiety. All sub-jects were asked not to consume alcohol or nicotine for 24 hrs before scanning. Exclusion criteria included: 1) severe physical disease or neurological diseases, such as trau-matic brain injury, degenerative brain disease, or epilepsy; 2) the presence of brain lesions, such as a tumor, cerebral infarction, or cerebral hemorrhage; and 3) MRI contra-indications, such as claustrophobia or metallic implants. All patients underwent a series of assessments performed by a psychiatrist. The alcohol use disorders identification test (AUDIT)42 and the severity of alcohol dependence questionnaire (SADQ) scales43 were applied to assess the severity of alcohol craving in the AD and AND groups. The information regarding drinking lifetime and daily alcohol consumption were also recorded. All HCs were healthy individuals with no history of psychiatric diag-noses, including substance abuse/dependence and psychia-tric disorders.
Written informed consent was obtained from all sub-jects. This study was approved by the Ethics Committee and the Institutional Review Board of the First Affiliated Hospital of Nanchang University and was conducted in accordance with the Declaration of Helsinki.
MRI Data Acquisition
All MRI data were collected using a Trio 3.0 T scanner (Siemens, Erlangen, Germany) at the First Affiliated Hospital of Nanchang University. The scanning sequences included: 1) T1-weighted 3D MP-RAGE sequence (176 sagittal slices, TR=1900 ms, TE=2.26 ms, flip angle=9°, FOV=250 mm ×250 mm, matrix=256×256, slice thickness/ gap=1.0/0 mm); 2) echo-planar imaging (EPI) sequence (29 axial slices, TR=2000 ms, TE=30 ms, flip angle=90°, FOV=220 mm×220 mm, matrix =64×64, slice thickness/ gap=4.0/1.2 mm), this rsfMRI scan collected 240 volumes in 8 mins; and 3) conventional T1- and T2-weighted images to exclude lesions in the brain. During the resting scan, the subjects were required to keep their eyes closed and avoid thinking. Foam pads were applied to restrict head motion. An Epworth sleepiness scale questionnaire was administered immediately after the scanning sessions to ensure the sub-jects were awake during the scan.
Neuropsychiatric Disease and Treatment downloaded from https://www.dovepress.com/ by 118.70.13.36 on 25-Aug-2020
Functional Data Preprocessing
rsfMRI data were preprocessed using the Data Processing Assistant for Resting-State fMRI (DPARSF, http://www. restfmri.net) based on Statistical Parametric Mapping (SPM8,http://www.fil.ion.ucl.ac.uk) and the Resting-state Data Analysis Toolkit (REST, http://www.restfmri.net), which were run on Matlab 8.4.0 (Mathworks, Natick, MA, United States). The first 10 volumes of each subject’s rsfMRI data were discarded to eliminate the effects of scanner instability and adaptation of the subjects to the circumstances. The remaining 230 volumes were corrected for the differences in slice acquisition times. Realignment was performed for correcting small movements between scans. The subjects with head motion >3 mm of maximum displacement in any of the x, y, or z directions or >3° of angular rotation in any axis were excluded. Based on the above criteria, one AD subject was excluded. As rsfMRI measures are sensitive to micro-head motions, we calcu-lated the mean framewise displacement (FD) (Table 1), according to the FD criteria described by Van Dijk et al,44 to measure the micro-head motion of each subject. The individual T1-weighted images were co-registered to the mean realigned functional images. The realigned functional images were then normalized to Montreal Neurological Institute (MNI) space using the transformation information acquired from the segmentation of the T1-weighted images using the Diffeomorphic Anatomical Registration Through Exponentiated Lie (DARTEL) tool.45To further reduce the effects of confounding factors, the signals from the white matter, cerebrospinal fluid, whole brain, and Friston-24 head motion parameters, which include six head motion parameters, six head motion parameters one time point before, and 12 corresponding squared items,46,47 were removed through linear regression. Meanwhile, linear and
quadratic trends were removed from the data. Finally, spa-tial smoothing with an isotropic 6 mm full-width half-max-imum Gaussian kernel was performed.
Interhemispheric Functional Connectivity
We used the DPABI toolkit to compute VMHC in the typical frequency band (0.01–0.08 Hz), slow-5 band (0.01–0.027 Hz), and slow-4 band (0.027–0.073 Hz). The VMHC value was calculated as the Pearson correlation coefficient between every pair of mirrored interhemispheric voxels’ time series.27 Fisher’s Z transformation was then performed to those correlation values. The resultant corre-lation values constituted the VMHC map and were used for subsequent group-level analyses.
Seed-Based Functional Connectivity (FC)
We selected areas with significantly different VMHC between groups as regions of interests (ROIs). The mean time course of each ROI was extracted. The Pearson’s correlation coefficient was computed between each ROI and the whole brain voxel’s time course. Fisher’sZ trans-formation was performed on the correlation maps before being entered into a group comparison.
Statistical Analysis
We used the SPSS 23.0 software package (IBM Inc., Seattle, WA, USA) to compare group differences in demo-graphic and clinical variables. Appropriate statistical methods were used to assess the differences in age, educa-tion, mean FD, years of drinking, daily drinking, AUDIT, and SADQ between the three groups. We set the signifi -cance level atp<0.05.
First, one-way analysis of variance (ANOVA; full factor-ial model) was used to evaluate the main effect of group in
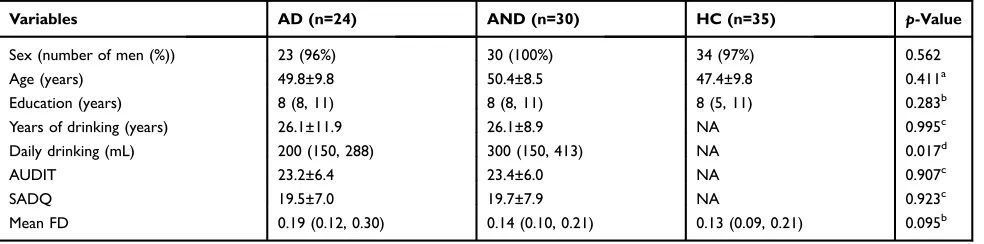
Table 1Demographics And Clinical Characteristics Of The Subjects
Variables AD (n=24) AND (n=30) HC (n=35) p-Value
Sex (number of men (%)) 23 (96%) 30 (100%) 34 (97%) 0.562
Age (years) 49.8±9.8 50.4±8.5 47.4±9.8 0.411a
Education (years) 8 (8, 11) 8 (8, 11) 8 (5, 11) 0.283b
Years of drinking (years) 26.1±11.9 26.1±8.9 NA 0.995c
Daily drinking (mL) 200 (150, 288) 300 (150, 413) NA 0.017d
AUDIT 23.2±6.4 23.4±6.0 NA 0.907c
SADQ 19.5±7.0 19.7±7.9 NA 0.923c
Mean FD 0.19 (0.12, 0.30) 0.14 (0.10, 0.21) 0.13 (0.09, 0.21) 0.095b Notes:Data are presented as mean±SD or median (P25, P75).
a
one-way ANOVA;bKruskal–WallisH-test;ctwo-samplet-test;dMann–WhitneyU-test.
Abbreviations:AD, alcohol dependence; AND, alcohol and nicotine co-dependence; HC, healthy control; NA, not applicable; AUDIT, alcohol use disorders identification test; SADQ, severity of alcohol dependence questionnaire.
Neuropsychiatric Disease and Treatment downloaded from https://www.dovepress.com/ by 118.70.13.36 on 25-Aug-2020
the typical frequency band. We then used two-samplet-tests to compare the VMHC differences between the three groups in the typical frequency band. Second, to determine the main effect of group, frequency band, and their interactions, two-way ANOVA (full factorial model) was performed. Next, the group comparison of VMHC in the slow-5 and slow-4 band was also performed using two-sample t-tests, respectively. Third, the group differences in seed-based functional con-nectivity for each ROI (areas with significantly different VMHC between groups) were also evaluated using two-sample t-tests. All multiple comparison corrections were performed using the Gaussian randomfield (GRF) correction with a voxel-level p<0.01 and a cluster-levelp<0.05. Age and education were treated as covariates. Finally, to learn about the relationship between functional results and clinical assessment performance, we further performed a partial cor-relation analysis between the VMHC and FC value of the significantly different brain areas and the clinical variables, with age and education treated as covariates.
Results
Demographics And Clinical Features
The AD, AND, and HC subjects showed no significant differences in terms of sex (p=0.562), age (p=0.411), educa-tion (p=0.283), or mean FD (p=0.095). There were no sig-nificant differences in years of drinking (p=0.995), AUDIT (p=0.907), and SADQ (p=0.923) scores between the AD and AND subjects (Table 1). However, there was a significant difference in daily drinking (p=0.017).
VMHC Analysis In Typical Frequency Band
The spatial distributions of the whole brain mean VMHC for the AD, AND, and HC groups in the typical frequency band were similar (Figure S1). There were some regions with significantly stronger VMHC than the global mean values and those regions were mainly distributed in the most prominent intrinsically connected hubs, typically referred to as the default mode network (DMN).
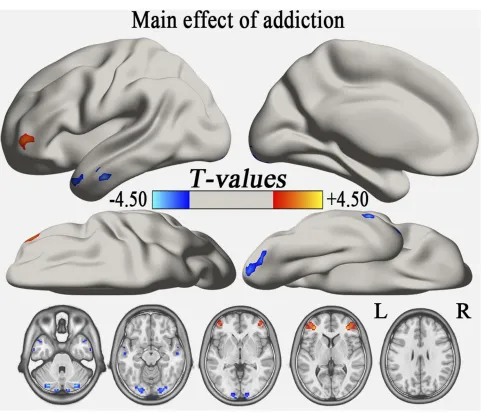
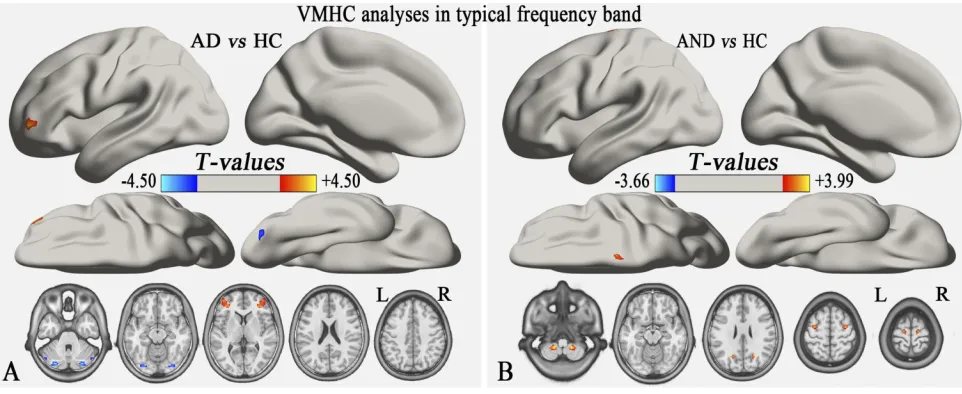
One-way ANOVA analysis showed that the main effect of group in the typical frequency band were located in the cere-bellum posterior lobe (CPL), inferior temporal gyrus (ITG), and middle frontal gyrus (MFG) (GRF correction, voxel-level p<0.01 and cluster-level p<0.05) (Table S1, Figure 1). Compared with the HC group, the AD group demonstrated significantly reduced VMHC in bilateral CPL and increased VMHC in bilateral MFG (GRF correction, voxel-levelp<0.01 and cluster-levelp<0.05) (Table 2,Figure 2A), while the AND
group exhibited higher VMHC in bilateral cerebellum 8, pre-cuneus, MFG, and superior frontal gyrus (p<0.01, uncor-rected) (Table 2and Figure 2B). No region with decreased VMHC relative to the HC group was found in the AND group. There were no significant differences following the compar-ison between the AD and AND groups after correction for multiple comparisons.
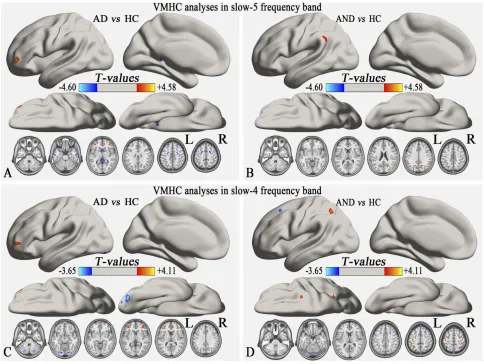
VMHC Alterations In The Slow-5 And
Slow-4 Frequency Band
The patterns of the whole brain mean VMHC in the three groups were similar in the slow-4 and slow-5 frequency bands (Figure S2). Regions with stronger VMHC than the global mean values were also mainly distributed in DMN. To explore the group and frequency changes in VMHC, we performed two-way ANOVA analysis twice with group (AD and HC, AND and HC) as a between-subject factor and frequency band (slow-4 and slow-5) as a within-subject factor. We found that the main effect of AD was located in the bilateral CPL, ITG, MFG, parahippocampal gyrus (PHG), and middle temporal gyrus (MTG) (GRF correction, voxel-levelp<0.01 and cluster-levelp<0.05;Table S2,Figure S3A), while no main effect of frequency or interaction between AD and frequency was found. Subsequently, we observed that the regions showing a main effect of AND comprised the bilateral CPL, ITG, and MFG (GRF correction, voxel-levelp<0.01 and cluster-levelp<0.05;Table S2,Figure S3B). No main effect of frequency was found, but there was a nonsignificant interac-tion between AND and frequency in the bilateral inferior occipital gyrus (p<0.01, uncorrected; Table S3,Figure S4). The results of a supplemental 3×2 ANOVA analysis (full factorial model) with group (AD, AND, and HC) as a between-subject factor and frequency band (slow-4 and slow-5) as a within-subject factor see inFigure S5.
The group comparison of VMHC in the slow-5 and slow-4 bands was furthered using two sample t-tests. In the slow-5 band, compared to the HCs, the AD group showed decreased VMHC in bilateral CPL, ITG, PHG, caudate, MTG, and superior frontal gyrus (SFG), and increased VMHC in bilateral MFG (p<0.01, uncorrected;
Table 3, Figure 3A). Compared to HCs, the AND group exhibited higher VMHC in bilateral CPL, precuneus (PCu), and supramarginal gyrus (SMG) (p<0.01, uncor-rected;Table 3, Figure 3B). In the slow-4 band, the AD group showed decreased VMHC in bilateral CPL and increased VMHC in bilateral MFG compared to HCs (GRF correction, voxel-level p <0.01 and cluster-level
Neuropsychiatric Disease and Treatment downloaded from https://www.dovepress.com/ by 118.70.13.36 on 25-Aug-2020
p<0.05;Table 3,Figure 3C). Compared to HCs, the AND group had lower VMHC in bilateral fusiform gyrus and SFG, and higher VMHC in bilateral cerebellum 8, inferior parietal lobule (IPL), and MFG (p<0.01, uncorrected;
Table 3,Figure 3D). No results survived in the comparison between the AD and AND groups after multiple compar-ison correction in the slow-4 and slow-5 bands.
Seed-Based FC Of The Regions With
Altered VMHC
We examined whole brain FC associated with the eight ROIs (one per hemisphere;Figures 2Aand3C), including the CPL and MFG, that exhibited altered VMHC in AD subjects in the typical and slow-4 bands.
All ROIs exhibited altered FC with their counterparts in the opposite hemisphere (GRF correction, voxel-levelp<0.01 and cluster-level p<0.05; Table S4, Figures 4 and 5). Consistent with the VMHC analysis, the AD group had lower FC between the CPL (seed) and its contralateral CPL compared with HCs both in the typical and slow-4 frequency bands. Compared to HCs, all MFG (seed) of the AD group showed higher FC with the contralateral MFG, which was also in accordance with the VMHC results.
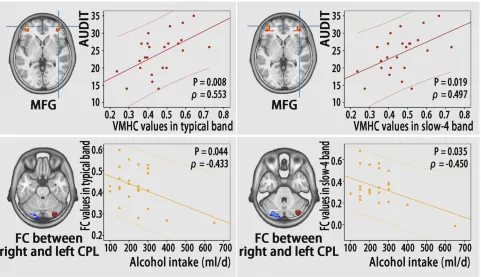
Correlations Between Functional Results
(VMHC And FC) And Clinical Variables
To calculate the relationship between functional results and clinical variables, the VMHC and FC values of
Figure 1The main effect of group (addiction) on the typical frequency band (GRF correction, voxel-levelp<0.01 and cluster-levelp<0.05). The cool color indicates brain regions with decreased VMHC, and the warm color indicates brain regions with increased VMHC. The left side of the picture represents the left side of the brain.
Abbreviations:L, left; R, right; GRF, Gaussian randomfield; VMHC, voxel-mirrored homotopic connectivity.
Neuropsychiatric Disease and Treatment downloaded from https://www.dovepress.com/ by 118.70.13.36 on 25-Aug-2020
significantly different brain regions between groups in the typical frequency band and slow-4 frequency band were extracted from the AD group. Within the AD group, sig-nificant positive correlations were observed between the AUDIT score and VMHC value in the bilateral MFG in the typical and slow-4 bands (Figure 6, Table S5). Furthermore, alcohol intake in individuals with AD was negatively correlated with the FC value between the right
CPL (seed) and contralateral CPL (Figure 6,Table S5). No significant correlations between other clinical variables and VMHC or FC value were found in any brain region (shown inTable S5).
Discussion
In this study, we studied the abnormalities of homotopic connectivity in individuals with AD and AND in different frequency bands (typical, slow-4, and slow-5 bands). We found: 1) compared to HCs, in the typical and slow-4 bands, the AD group had lower VMHC in bilateral CPL and higher VMHC in MFG. No significant difference in VMHC was found between the AND and HC groups, nor between the AND and AD group. 2) The abnormal interhe-mispheric FC in different brain regions could be better detected in the slow-4 band than in the slow-5 band. 3) The main effect of group in all the bands was mainly located in the CPL and MFG. 4) All seed (CPL and MFG) regions with group differences in VMHC showed abnormal FC only with its homotopic counterpart. 5) A significant correlational rela-tionship was observed between the functional results of the AD group and clinical features.
In our study, bilateral MFG and CPL continuously appeared abnormal in nearly all group comparative analyses, representing the crucial role of these regions in AD. The MFG is a component of the executive control network (ECN), which has specific relevance in controlling substance consumption and reacting to relevant cues.16The weakening of the ECN
Table 2Differences In VMHC Between The AD, AND, And HC Groups In The Typical Frequency Band
Brain Area BA MNI Peak Voxel
Size X, Y, Z
AD vs HC
AD<HC
Cerebellum posterior lobe
/ ±30,−81,−33 −4.453 227
AD>HC
Middle frontal gyrus 10 ±42, 54, 0 4.497 107
AND vs HC
AND>HC
Cerebellum 8 / ±18,−48,−57 3.872 16 Precuneus 7 ±24,−63,−27 3.987 16 Middle frontal gyrus 6 ±33,−6,−60 3.555 14 Superior frontal gyrus 6 ±15,−15, 72 3.702 13
Abbreviations: VMHC, voxel-mirrored homotopic connectivity; AD, alcohol dependence; AND, alcohol and nicotine co-dependence; HC, healthy control; BA, Brodmann’s area; MNI, Montreal Neurological Institute.
Figure 2(A) The VMHC differences between individuals with AD and HCs in the typical band (GRF correction, voxel-levelp<0.01 and cluster-levelp<0.05). (B) The VMHC differences between individuals with AND and HCs in the typical band (p<0.01, uncorrected). The hot color indicates that individuals with AD or AND had a significantly higher VMHC value compared to HCs, while the cool color indicates the opposite. The left side of thefigure is the left side of the brain.
Abbreviations:VMHC, voxel-mirrored homotopic connectivity; AD, alcohol dependence; AND, alcohol and nicotine co-dependence; HC, healthy control; L, left; R, right; GRF, Gaussian randomfield.
Neuropsychiatric Disease and Treatment downloaded from https://www.dovepress.com/ by 118.70.13.36 on 25-Aug-2020
will result in a loss of control over drug-related behaviors and contribute to addiction and relapse.16Disruption of the ECN has already been reported in many AD studies.17,25,48 The increased connectivity of the ECN in individuals with AD in this study is consistent with some previous studies that were performed using data-driven independent component analysis methods. Jansen et al observed higher connectivity within the left fronto-parietal control network, also referred to as the ECN, and between the left and right ECN in AD patients compared to HCs.25Zhu et al also found higher within-net-work and between-netwithin-net-work FC in the ECN in AD patients relative to HCs.48In addition, some seed-based rsfMRI studies in individuals with AD showed a similar finding as well. Camchong et al observed stronger FC in the ECN in
long-term abstinent alcoholics compared to HCs.18From the same team, higher FC in the ECN was also found in short-term abstinent alcoholics,19which correlated with behavior. Based on those results, they proposed that increased FC of the ECN reflects an ongoing compensatory mechanism for abstinent alcoholics to prepare the use of executive control when needed. However, the opposite result has also been reported in the seed-based rsfMRI literature. In a study by Muller-Oehring et al,17 lower within-network connectivity of the ECN was found in individuals with AD compared to HCs, which may be regarded as a form of functional network dedifferentiation. Above all, the different results regarding the FC of the ECN in seed-based studies may be attributed to the differences in seeds’ locations. Camchong et al18,19
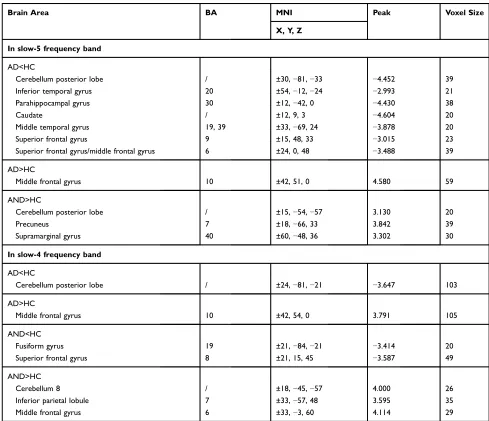
Table 3Differences In VMHC In The Slow-5 And Slow-4 Frequency Bands Between Groups
Brain Area BA MNI Peak Voxel Size
X, Y, Z
In slow-5 frequency band
AD<HC
Cerebellum posterior lobe / ±30,−81,−33 −4.452 39 Inferior temporal gyrus 20 ±54,−12,−24 −2.993 21 Parahippocampal gyrus 30 ±12,−42, 0 −4.430 38
Caudate / ±12, 9, 3 −4.604 20
Middle temporal gyrus 19, 39 ±33,−69, 24 −3.878 20 Superior frontal gyrus 9 ±15, 48, 33 −3.015 23 Superior frontal gyrus/middle frontal gyrus 6 ±24, 0, 48 −3.488 39
AD>HC
Middle frontal gyrus 10 ±42, 51, 0 4.580 59
AND>HC
Cerebellum posterior lobe / ±15,−54,−57 3.130 20
Precuneus 7 ±18,−66, 33 3.842 39
Supramarginal gyrus 40 ±60,−48, 36 3.302 30
In slow-4 frequency band
AD<HC
Cerebellum posterior lobe / ±24,−81,−21 −3.647 103
AD>HC
Middle frontal gyrus 10 ±42, 54, 0 3.791 105
AND<HC
Fusiform gyrus 19 ±21,−84,−21 −3.414 20
Superior frontal gyrus 8 ±21, 15, 45 −3.587 49
AND>HC
Cerebellum 8 / ±18,−45,−57 4.000 26
Inferior parietal lobule 7 ±33,−57, 48 3.595 35
Middle frontal gyrus 6 ±33,−3, 60 4.114 29
Abbreviations:VMHC, voxel-mirrored homotopic connectivity; AD, alcohol dependence; AND, alcohol and nicotine co-dependence; HC, healthy control; BA, Brodmann’s area; MNI, Montreal Neurological Institute.
Neuropsychiatric Disease and Treatment downloaded from https://www.dovepress.com/ by 118.70.13.36 on 25-Aug-2020
chose the subgenual anterior cingulate cortex as the seed to establish the ECN, while Muller-Oehring et al17 chose the superior frontal gyri. The different selection of seeds may have a great effect on connectivity patterns.49 In a word, those studies and our study indicated that the enhanced homo-topic connectivity and FC in the MFG in AD subjects are compensatory mechanisms, possibly related to neuroplasticity, to meet the increased requirement of cognitive control, even though it is still insufficient with regard to alcohol-related cues.25Furthermore, we observed that VMHC values of the MFG were positively correlated with AUDIT score in the AD group. This correlation further indicates that the compensatory increased VMHC in the MFG is exacerbated with the severity of dependence to meet the increased cognitive control require-ments. Based on our results and the recent findings of the correlation between resting-state FC and severity of
dependence,50,51 we propose that the VMHC of the MFG may be a biomarker of dependence severity in AD patients.
The cerebellum has usually been regarded as an area related to motor control.52However, an increasing number of studies have found that the cerebellum is also involved in many cognitive functions to regulate higher order beha-vior, such as attention, language, executive control, and affection.52,53 Neuroimaging studies have reported that different regions of the cerebellum have distinct functions and the CPL is one region that administrates cognitive abilities.54Hence, some studies have proposed that impair-ments of the cerebellum may be associated with AD. Emerging evidence of the cerebellum’s role in AD have been reported in many studies. The AD patients exhibited shrinkage of the cerebellum,20 which was correlated with performance in a spatial working memory task.55During a
Figure 3Group comparison of the VMHC in the slow-5 and slow-4 frequency bands. (A) and (B) show the group differences in slow-5 frequency band (p<0.01, uncorrected). (C) and (D) show the group differences in the slow-4 frequency band. In (C) GRF correction was applied at a voxel level ofp<0.01 and cluster-levelp<0.05, while (D) was uncorrected withp<0.01. The cool color indicates brain regions with decreased VMHC, and the warm color indicates brain regions with increased VMHC in the comparison between individuals with AD (or AND) and HCs.
Abbreviations:VMHC, voxel-mirrored homotopic connectivity; AD, alcohol dependence; AND, alcohol and nicotine co-dependence; HC, healthy control; L, left; R, right; FDR, false discovery rate.
Neuropsychiatric Disease and Treatment downloaded from https://www.dovepress.com/ by 118.70.13.36 on 25-Aug-2020
Figure 4Alterations of the FC between seeds that exhibited altered VMHC in group comparison (shown inFigure 2A) and whole brain voxels in the typical frequency band (GRF correction, voxel-levelp<0.01 and cluster-levelp<0.05). All seeds show a similar positive connectivity pattern in individuals with AD and HCs. The cool color indicates decreased seed-based FC in individuals with AD compared to HCs, while the warm color indicates increased seed-based FC.
Abbreviations:L, left; R, right; CPL, cerebellum posterior lobe; MFG, middle frontal gyrus; AD, alcohol dependence; HC, healthy control; FC, functional connectivity; ROI, regions of interest; VMHC, voxel-mirrored homotopic connectivity; GRF, Gaussian randomfield.
Neuropsychiatric Disease and Treatment downloaded from https://www.dovepress.com/ by 118.70.13.36 on 25-Aug-2020
Figure 5Alterations of the FC between seeds that exhibited altered VMHC in the group comparison (shown inFigure 3C) and whole brain voxels in the slow-4 band (GRF correction, voxel levelp<0.01 and cluster-levelp<0.05). All seeds show a similar positive connectivity pattern in individuals with AD and HCs. The cool color indicates decreased seed-based FC in individuals with AD compared to HCs, while the warm color indicates increased seed-based FC.
Abbreviations:L, left; R, right; CPL, cerebellum posterior lobe; MFG, middle frontal gyrus; AD, alcohol dependence; HC, healthy control; FC, functional connectivity; ROI, regions of interest; VMHC, voxel-mirrored homotopic connectivity; GRF, Gaussian randomfield.
Neuropsychiatric Disease and Treatment downloaded from https://www.dovepress.com/ by 118.70.13.36 on 25-Aug-2020
verbal working memory task, AD patients showed abnor-mal neural activation of the prefrontal cortex and superior cerebellum.23 Our previous study also showed lower degree centrality values in the left CPL of the AD group compared to HCs.13 In the present study, a decrease in homotopic connectivity and FC in the CPL in individuals with AD reflected damage to the CPL, which was in line with the above studies. In addition, we further observed a negative correlation between the FC of the bilateral CPL in the typical and slow-4 bands and alcohol intake per day in the current study, which may indicate that increased daily alcohol consumption will exacerbate impairment of the cerebellum.
As MFG and CPL were nodes of the frontocerebellar circuitry, even though no direct altered FC between those two regions was found in our study, thisfinding still indi-cates impairments of the frontocerebellar circuitry, which was consistent with our previous hypothesis. During afi n-ger tapping task, a reduction in the FC in the frontocerebel-lar circuitry between the prefrontal cortex and Lobule VIII of the inferior cerebellum in individuals with AD was found;56this is in accordance with our results. A consistent finding was also reported by Sullivan et al,57who detected
volume deficits in AD subjects in many nodes of the fron-tocerebellar circuitry, including the cerebellum, pons, and prefrontal cortex; furthermore, some of the regions were correlated with each other.
In addition to the above positivefindings, we also found there were no VMHC differences between individuals with AND and AD, nor AND and HCs, which means that there were no positive effects of nicotine on AD. This is not in line with previous studies, which demonstrated smoking-related aberrant brain volumes, metabolites, bloodflow, and neurocognition in smoking AD subjects.58 Compared to non-smoking AD subjects, smoking AD subjects had lower gray matter volume in the parietal, temporal, and occipital lobes; lower N-acetylaspartate concentrations in the frontal white matter; and lower N-acetylaspartate and choline in the midbrain.58Furthermore, behavioral studies indicated alcohol and tobacco potentiate each other’s health effects through cross-reinforcement and cross-tolerance psychopharmacological mechanisms.8 We speculated that the low level of nicotine dependence in individuals with AND and small samples size may be the main reasons why there were no significant differences between AND and the other groups.
Figure 6Correlations between functional results (VMHC and FC) and clinical variables (AUDIT score and alcohol intake) in individuals with AD.
Abbreviations:CPL, cerebellum posterior Lobe; MFG, middle frontal gyrus; FC, functional connectivity; AUDIT, alcohol use disorders identification test; VMHC, voxel-mirrored homotopic connectivity; AD, alcohol dependence.
Neuropsychiatric Disease and Treatment downloaded from https://www.dovepress.com/ by 118.70.13.36 on 25-Aug-2020
Several studies demonstrated that FC32 and regional homogeneity (ReHo)38in cortical networks were concentrated at ultra-low frequencies (0.01–0.04 Hz) and were more fre-quency-dependent, while in limbic networks they were dis-tributed over a wider frequency range (0.01–0.14 Hz) and were less frequency-dependent. The frequency-specific fea-tures may have contributed to the differences in the cytoarch-itecture and synaptic types in those regions59 and may be related to different neural manifestations. In the current study, we also found frequency-dependent abnormalities in VMHC in individuals with AD. Additionally, we found that the slow-4 band is more sensitive in detecting changes in VMHC in the frontal and cerebellar regions. This result was in line with previous studies that showed abnormal sponta-neous neuronal activity could be better detected by the slow-4 band41and that the slow-4 band has higher test–retest relia-bility than the slow-5 band in both amplitude of low-frequency fluctuations (ALFF) and fractional amplitude of low-fre-quencyfluctuations (fALFF).31The increased chance offi nd-ing differences in the slow-4 band may be generated by certain mechanisms and we will explore this in subsequent studies. Furthermore, the results indicated that the effects of the fre-quency band should be considered in future studies.
Although ourfindings are promising, several limitations should be noted. First, the sample size of this study was relatively small. Larger samples will be required to further replicate ourfindings. Second, as almost all AD patients in our country are male, nearly all the subjects in this study were male. However, rsfMRI research in the AD group should consider sex effects on alcohol-induced neurobiolo-gical and neurocognitive abnormalities. Thus, larger num-bers of female subjects are needed to strengthen our findings. Third, considering the reports of regional volu-metric differences in AD subjects,60,61 there may be a structural basis underlying deficits in VMHC. In order to understand the interhemispheric interaction between the structure and function of the AD brain, structural studies, especially DTI, should be implemented in those subjects in the future. Fourth, based on this cross-sectional design, we revealed the deficits of VMHC in the AD group relative to HCs. However, we also want to know how the aberrant VMHC regions change in the course of persistent addiction or abstinence. With regard to this, longitudinal studies are required. Fifth, we set the voxel-levelp-value threshold to p<0.01 in the GRF correction, which may increase the false positive rate. Hence, we should use more strict voxel-level thresholds, such asp<0.001,62in future studies. Finally, we did not use a battery of neuropsychological tests to assess
cognitive performance in the present study. However, the brain–behavior relationship is critical for clarifying the neuromechanisms of AD. Thus, we will broaden tests of cognitive function in AD subjects in future studies.
Conclusion
Abnormal VMHC and FC in AD subjects were mainly located in the bilateral MFG and CPL, which are nodes of the ECN and part of the frontocerebellar circuitry asso-ciated with executive control function. Functional altera-tions in those regions might be a biomarker of dependence severity in individuals with AD, which could be used in the prevention, clinical detection, and management of AD in the future. Meanwhile, those group differences in intrin-sic connectivity can be more easily detected in the slow-4 band than in the slow-5 band. Thus, future rsfMRI studies of AD should take frequency bands into account. There was no positive nicotine-related aberrant brain VMHC in smoking AD subjects. Further studies are needed to explore the mechanism of these effects.
Acknowledgments
The authors thank all the patients and healthy volunteers for their contributions to this work, and Jiangxi Provincial Medical and Health Technology Program of the Health Department (20185136) for funding this study.
Disclosure
The authors report no conflicts of interest in this work.
References
1. American Psychiatric Association.Diagnostic and Statistical Manual of Mental, 4th Edn Text Rev. Washington, DC: American Psychiatric Association;2000.
2. World Health Organization. Global Status Report on Alcohol and Health. World Health Organization: Geneva;2018.
3. Bjork JM, Grant SJ, Hommer DW. Cross-sectional volumetric analysis of brain atrophy in alcohol dependence: effects of drinking history and
comorbid substance use disorder. Am J Psychiatry. 2003;160
(11):2038–2045. doi:10.1176/appi.ajp.160.11.2038
4. Degenhardt L, Hall W. Patterns of co-morbidity between alcohol use and other substance use in the Australian population.Drug Alcohol Rev.2003;22(1):7–13. doi:10.1080/0959523021000059776
5. Littleton J, Barron S, Prendergast M, Nixon SJ. Smoking kills (alco-holics)! shouldn’t we do something about it?Alcohol Alcohol.2007;42 (3):167–173. doi:10.1093/alcalc/agm019
6. Roberts W, Moore KE, Pittman BP, Fillmore MT, McKee SA. High Risk of alcohol-impaired driving in adults with comorbid alcohol and substance use disorders in the U.S. population.J Stud Alcohol Drugs. 2019;80(1):114–119. doi:10.15288/jsad.2019.80.114
7. Miller NS, Gold MS. Comorbid cigarette and alcohol addiction: epide-miology and treatment.J Addict Dis.1998;17(1):55–66. doi:10.1300/ J069v17n01_06
Neuropsychiatric Disease and Treatment downloaded from https://www.dovepress.com/ by 118.70.13.36 on 25-Aug-2020
8. Adams S. Psychopharmacology of tobacco and alcohol comorbidity: a review of current evidence. Curr Addict Rep. 2017;4(1):25–34. doi:10.1007/s40429-017-0129-z
9. Oscar-Berman M, Marinkovic K. Alcohol: effects on neurobehavioral functions and the brain.Neuropsychol Rev.2007;17(3):239–257. 10. Chanraud S, Martelli C, Delain F, et al. Brain morphometry and
cogni-tive performance in detoxified alcohol-dependents with preserved psy-chosocial functioning. Neuropsychopharmacology. 2007;32(2):429– 438. doi:10.1038/sj.npp.1301219
11. Nakamura-Palacios EM, Souza RS, Zago-Gomes MP, et al. Gray matter volume in left rostral middle frontal and left cerebellar cortices predicts frontal executive performance in alcoholic subjects.Alcohol Clin Exp Res.2014;38(4):1126–1133. doi:10.1111/acer.12308 12. Chanraud S, Reynaud M, Wessa M, et al. Diffusion tensor tractography
in mesencephalic bundles: relation to mentalflexibility in detoxified alcohol-dependent subjects. Neuropsychopharmacology. 2009;34 (5):1223–1232. doi:10.1038/npp.2008.101
13. Luo X, Guo L, Dai XJ, et al. Abnormal intrinsic functional hubs in alcohol dependence: evidence from a voxelwise degree centrality analysis. Neuropsychiatr Dis Treat.2017;13:2011–2020. doi:10.2147/NDT.S142742 14. Tu X, Wang J, Liu X, Zheng J. Aberrant regional brain activities in alcohol dependence: a functional magnetic resonance imaging study. Neuropsychiatr Dis Treat.2018;14:847–853. doi:10.2147/NDT.S158221 15. Seeley WW, Menon V, Schatzberg AF, et al. Dissociable intrinsic connectivity networks for salience processing and executive control. J Neurosci.2007;27(9):2349–2356. doi:10.1523/JNEUROSCI.5587-06.2007
16. Baler RD, Volkow ND. Drug addiction: the neurobiology of disrupted self-control. Trends Mol Med. 2006;12(12):559–566. doi:10.1016/j. molmed.2006.10.005
17. Muller-Oehring EM, Jung YC, Pfefferbaum A, Sullivan EV, Schulte T. The resting brain of alcoholics.Cereb Cortex.2015;25(11):4155–4168. 18. Camchong J, Stenger A, Fein G. Resting-state synchrony in long-term abstinent alcoholics.Alcohol Clin Exp Res.2013;37(1):75–85. doi:10.1111/j.1530-0277.2012.01859.x
19. Camchong J, Stenger VA, Fein G. Resting-state synchrony in short-term versus long-short-term abstinent alcoholics. Alcohol Clin Exp Res. 2013;37(5):794–803. doi:10.1111/acer.12037
20. Harper C. The neuropathology of alcohol-specific brain damage, or does alcohol damage the brain?J Neuropathol Exp Neurol.1998;57 (2):101–110. doi:10.1097/00005072-199802000-00001
21. Yeh PH, Simpson K, Durazzo TC, Gazdzinski S, Meyerhoff DJ. Tract-Based Spatial Statistics (TBSS) of diffusion tensor imaging data in alcohol dependence: abnormalities of the motivational neuro-circuitry. Psychiatry Res. 2009;173(1):22–30. doi:10.1016/j. pscychresns.2008.07.012
22. Bendszus M, Weijers HG, Wiesbeck G, et al. Sequential MR imaging and proton MR spectroscopy in patients who underwent recent detox-ification for chronic alcoholism: correlation with clinical and neurop-sychological data.AJNR Am J Neuroradiol.2001;22(10):1926–1932. 23. Desmond JE, Chen SH, DeRosa E, Pryor MR, Pfefferbaum A, Sullivan EV. Increased frontocerebellar activation in alcoholics dur-ing verbal workdur-ing memory: an fMRI study.NeuroImage.2003;19 (4):1510–1520. doi:10.1016/S1053-8119(03)00102-2
24. Schulte T, Sullivan EV, Muller-Oehring EM, Adalsteinsson E, Pfefferbaum A. Corpus callosal microstructural integrity influences interhemispheric processing: a diffusion tensor imaging study.Cereb Cortex.2005;15(9):1384–1392.
25. Jansen JM, van Wingen G, van den Brink W, Goudriaan AE. Resting state connectivity in alcohol dependent patients and the effect of repe-titive transcranial magnetic stimulation.Eur Neuropsychopharmacol. 2015;25(12):2230–2239. doi:10.1016/j.euroneuro.2015.09.019 26. Salvador R, Suckling J, Schwarzbauer C, Bullmore E. Undirected
graphs of frequency-dependent functional connectivity in whole brain networks.Philos Trans R Soc Lond B Biol Sci.2005;360(1457):937– 946. doi:10.1098/rstb.2005.1645
27. Zuo XN, Kelly C, Di Martino A, et al. Growing together and growing apart: regional and sex differences in the lifespan developmental trajec-tories of functional homotopy.J Neurosci.2010;30(45):15034–15043. doi:10.1523/JNEUROSCI.2612-10.2010
28. Kelly C, Zuo XN, Gotimer K, et al. Reduced interhemispheric resting state functional connectivity in cocaine addiction. Biol Psychiatry. 2011;69(7):684–692. doi:10.1016/j.biopsych.2010.11.022
29. Yu D, Yuan K, Bi Y, et al. Altered interhemispheric resting-state functional connectivity in young male smokers.Addict Biol.2018;23 (2):772–780. doi:10.1111/adb.2018.23.issue-2
30. Buzsaki G, Draguhn A. Neuronal oscillations in cortical networks. Science.2004;304(5679):1926–1929. doi:10.1126/science.1099745 31. Zuo XN, Di Martino A, Kelly C, et al. The oscillating brain: complex
and reliable. NeuroImage. 2010;49(2):1432–1445. doi:10.1016/j. neuroimage.2009.09.037
32. Wu CW, Gu H, Lu H, Stein EA, Chen JH, Yang Y. Frequency specificity of functional connectivity in brain networks. NeuroImage. 2008;42 (3):1047–1055. doi:10.1016/j.neuroimage.2008.05.035
33. Cordes D, Haughton VM, Arfanakis K, et al. Frequencies Contributing to functional connectivity in the cerebral cortex in “resting-state”data.AJNR Am J Neuroradiol.2001;22(7):1326–1333. 34. Lin X, Jia X, Zang Y-F, Dong G. Frequency-dependent changes in the amplitude of low-frequencyfluctuations in internet gaming disorder. Front Psychol.2015;6:1471. doi:10.3389/fpsyg.2015.01471 35. Wang Z, Fang J, Liu J, et al. Frequency-dependent functional
con-nectivity of the nucleus accumbens during continuous transcutaneous vagus nerve stimulation in major depressive disorder. J Psychiatr Res.2018;102:123–131. doi:10.1016/j.jpsychires.2017.12.018 36. Zhang Y, Zhu C, Chen H, et al. Frequency-dependent alterations in
the amplitude of low-frequencyfluctuations in social anxiety disor-der. J Affect Disord. 2015;174:329–335. doi:10.1016/j.jad.2014.12. 001
37. Zhou F, Wu L, Guo L, Zhang Y, Zeng X. Local connectivity of the resting brain connectome in patients with low back-related leg pain: a multiscale frequency-related Kendall’s coefficient of concordance and coherence-regional homogeneity study. Neuroimage Clin. 2019;21:101661. doi:10.1016/j.nicl.2019.101661
38. Song X, Zhang Y, Liu Y. Frequency specificity of regional homo-geneity in the resting-state human brain. PLoS One. 2014;9(1): e86818. doi:10.1371/journal.pone.0086818
39. Zhou F, Wu L, Liu X, Gong H, Luk KD, Hu Y. Characterizing thala-mocortical disturbances in cervical spondylotic myelopathy: revealed by functional connectivity under two slow frequency bands.PLoS One. 2015;10(6):e0125913. doi:10.1371/journal.pone.0125913
40. Xue SW, Li D, Weng XC, Northoff G, Li DW. Different neural manifestations of two slow frequency bands in resting functional magnetic resonance imaging: a systemic survey at regional, interre-gional, and network levels. Brain Connect. 2014;4(4):242–255. doi:10.1089/brain.2013.0182
41. Zhan J, Gao L, Zhou F, et al. Amplitude of Low-frequencyfluctuations in multiple-frequency bands in acute mild traumatic brain injury.Front Hum Neurosci.2016;10:27. doi:10.3389/fnhum.2016.00027
42. Saunders JB, Aasland OG, Babor TF, de la Fuente JR, Grant M. Development of the Alcohol Use Disorders Identification Test (AUDIT): WHO collaborative project on early detection of persons with harmful alcohol consumption–II. Addiction. 1993;88(6):791– 804. doi:10.1111/add.1993.88.issue-6
43. Stockwell T, Sitharthan T, McGrath D, Lang E. The measurement of alcohol dependence and impaired control in community samples. Addiction.1994;89(2):167–174. doi:10.1111/add.1994.89.issue-2 44. Van Dijk KRA, Sabuncu MR, Buckner RL. The influence of head
motion on intrinsic functional connectivity MRI. NeuroImage. 2012;59(1):431–438. doi:10.1016/j.neuroimage.2011.07.044 45. Ashburner J. A fast diffeomorphic image registration algorithm.
NeuroImage.2007;38(1):95–113. doi:10.1016/j.neuroimage.2007.07.007
Neuropsychiatric Disease and Treatment downloaded from https://www.dovepress.com/ by 118.70.13.36 on 25-Aug-2020
46. Friston KJ, Williams S, Howard R, Frackowiak RS, Turner R. Movement-related effects in fMRI time-series. Magn Reson Med. 1996;35(3):346–355. doi:10.1002/mrm.1910350312
47. Yan CG, Cheung B, Kelly C, et al. A comprehensive assessment of regional variation in the impact of head micromovements on func-tional connectomics.NeuroImage.2013;76:183–201. doi:10.1016/j. neuroimage.2013.03.004
48. Zhu X, Cortes CR, Mathur K, Tomasi D, Momenan R. Model-free functional connectivity and impulsivity correlates of alcohol depen-dence: a resting-state study. Addict Biol. 2017;22(1):206–217. doi:10.1111/adb.2017.22.issue-1
49. Kelly AM, Di Martino A, Uddin LQ, et al. Development of anterior cingulate functional connectivity from late childhood to early adult-hood.Cereb Cortex.2009;19(3):640–657.
50. Vergara VM, Liu J, Claus ED, Hutchison K, Calhoun V. Alterations of resting state functional network connectivity in the brain of nico-tine and alcohol users.NeuroImage.2017;151:45–54. doi:10.1016/j. neuroimage.2016.11.012
51. Fede SJ, Grodin EN, Dean SF, Diazgranados N, Momenan R. Resting state connectivity best predicts alcohol use severity in moderate to heavy alcohol users.Neuroimage Clin.2019;22:101782. doi:10.1016/ j.nicl.2019.101782
52. Schmahmann JD. An emerging concept. The cerebellar contribution to higher function. Arch Neurol. 1991;48(11):1178–1187. doi:10.1001/ archneur.1991.00530230086029
53. Wolf U, Rapoport MJ, Schweizer TA. Evaluating the affective compo-nent of the cerebellar cognitive affective syndrome.J Neuropsychiatry Clin Neurosci.2009;21(3):245–253. doi:10.1176/jnp.2009.21.3.245 54. Stoodley CJ, Schmahmann JD. Functional topography in the human
cerebellum: a meta-analysis of neuroimaging studies.NeuroImage. 2009;44(2):489–501. doi:10.1016/j.neuroimage.2008.08.039
55. Chanraud S, Pitel AL, Rohlfing T, Pfefferbaum A, Sullivan EV. Dual tasking and working memory in alcoholism: relation to frontocere-bellar circuitry. Neuropsychopharmacology. 2010;35(9):1868–1878. doi:10.1038/npp.2010.56
56. Rogers BP, Parks MH, Nickel MK, Katwal SB, Martin PR. Reduced fronto-cerebellar functional connectivity in chronic alcoholic patients. Alcohol Clin Exp Res. 2012;36(2):294–301. doi:10.1111/ j.1530-0277.2011.01614.x
57. Sullivan E. Compromised pontocerebellar and cerebellothalamocor-tical systems: speculations on their contributions to cognitive and motor impairment in nonamnesic alcoholism.Alcohol Clin Exp Res. 2003;27(9):1409–1419. doi:10.1097/01.ALC.0000085586.91726.46 58. Durazzo TC, Gazdzinski S, Meyerhoff DJ. The neurobiological and
neurocognitive consequences of chronic cigarette smoking in alcohol use disorders. Alcohol Alcohol. 2007;42(3):174–185. doi:10.1093/ alcalc/agm020
59. Mesulam MM. From sensation to cognition. Brain. 1998;121(Pt 6):1013–1052. doi:10.1093/brain/121.6.1013
60. Yang X, Tian F, Zhang H, et al. Cortical and subcortical gray matter shrinkage in alcohol-use disorders: a voxel-based meta-analysis.Neurosci Biobehav Rev.2016;66:92–103. doi:10.1016/j.neubiorev.2016.03.034 61. Grodin EN, Lin H, Durkee CA, Hommer DW, Momenan R. Deficits
in cortical, diencephalic and midbrain gray matter in alcoholism
measured by VBM: effects of co-morbid substance abuse.
Neuroimage Clin.2013;2:469–476. doi:10.1016/j.nicl.2013.03.013 62. Woo C-W, Krishnan A, Wager TD. Cluster-extent based thresholding
in fMRI analyses: pitfalls and recommendations. NeuroImage. 2014;91:412–419. doi:10.1016/j.neuroimage.2013.12.058
Neuropsychiatric Disease and Treatment
Dove
press
Publish your work in this journal
Neuropsychiatric Disease and Treatment is an international, peer-reviewed journal of clinical therapeutics and pharmacology focusing on concise rapid reporting of clinical or pre-clinical studies on a range of neuropsychiatric and neurological disorders. This journal is indexed on PubMed Central, the‘PsycINFO’database and CAS, and
is the official journal of The International Neuropsychiatric Association (INA). The manuscript management system is comple-tely online and includes a very quick and fair peer-review system, which is all easy to use. Visit http://www.dovepress.com/testimo-nials.php to read real quotes from published authors.
Submit your manuscript here:https://www.dovepress.com/neuropsychiatric-disease-and-treatment-journal
Neuropsychiatric Disease and Treatment downloaded from https://www.dovepress.com/ by 118.70.13.36 on 25-Aug-2020