a
Corresponding author: [email protected]
Experimental and numerical analysis of unsteady behaviour of high
efficiency mixed-flow pump
Milan SedláĜ1,a
, Martin Komárek1, Michal Vyroubal1, Vít Doubrava2, Michal Varchola3 and Peter Hlboþan3
1
Centre of Hydraulic Research, J. Sigmunda 190, 783 49 Lutin, Czech Republic 2
SIGMA Research and Development Institute, J. Sigmunda 79, 783 50 Lutin, Czech Republic 3
Slovak University of Technology in Bratislava, Faculty of Mechanical Engineering, Námestie Slobody 17, 812 31 Bratislava 1
Abstract.This work deals with the experimental and numerical investigation of cavitating and noncavitating flow inside a mixed-flow pump and its influence on performance curves of this pump. The experimental research has been carried out in the closed horizontal loop with the main tank capacity of 35 m3.The loop is equipped with both the compressor and the vacuum pump capable of creating different pressure levels while maintaining constant volume flow rate. Pump investigated in this project has been equipped with transparent windows, which enabled the visualization of flow and cavitation phenomena for a wide range of flow conditions. A comprehensive CFD analysis of tested pump has been done both in the cavitating and noncavitating regimes. The ANSYS CFX commercial CFD package has been used to solve URANS equations together with the Rayleigh-Plesset model and the SST-SAS turbulence model. Both the experimental research and the CFD analysis have provided a good illustration of the flow structures inside the pump and their dynamics for a wide range of flow rates and NPSH values. Flow and cavitation instabilities have been detected at suboptimal flow rates which correspond to increased values of noise and vibrations. The calculated results agree well with the measurements.
1 Introduction
The requirements for the design of new pumps are continuously increasing due to the customers' demands as well as government initiatives (like European Ecodesign Directive or Product Environmental Footprint Project in the EU area). These requirements include not only the top efficiency of pumps but also the design optimised from the point of pump weight, manufacturing and application of new environment-friendly materials. The mixed-flow pumps typically suffer from a very high level of noise and vibrations at suboptimal flow rates. This negative property can be usually suppressed, but at the cost of decreasing the pump efficiency or a very robust and heavy construction. Of course, both these methods are hardly acceptable for the high performance pumps these days and that is why the detailed knowledge of the noise and vibration sources can be very useful for the pump optimisation.
Recently, many numerical and experimental studies concerning flow phenomena in the mixed-flow pumps have appeared, e.g. [1-7], but they are mostly concerned with the steady cavitation. Very comprehensive work comes from Kaupert and Staubli [8] who studied
extensively the unsteady flow phenomena in a high specific speed centrifugal pump (dimensionless specific speed N = 1.7) and their influence on the transient hysteresis in the pump characteristic. Nevertheless there is still lack of information in the literature concerning flow and cavitation instabilities in the mixed-flow or radial-flow pumps because practically all studies dealing with these instabilities are devoted to inducers which represent a special type of the axial-flow pumps.
To examine the unsteady cavitating performance, experimental methods have been widely used for a long time. Recently the progress in development of CFD tools has encouraged authors to examine unsteady flow and cavitation phenomena in the mixed-flow pumps in the numerical way, e.g. [9-10]. These CFD studies use advanced turbulence models such as the SST-SAS model for URANS (Unsteady Reynolds-Averaged Navier-Stokes) equations, or the Large Eddy Simulations (LES). The numerical tests indicate that there are some limitations in modelling of flow and cavitation instabilities using URANS based codes and that the future work will tend to the Detached Eddy Simulations (DES), though they are still far from currentengineering practise.
C
2 Description of pump and experimental
facility
The pump which is an object of this paper has the dimensionless specific speed N = 1.75 and is produced in the configuration with the axial diffuser (with nine vanes) and 90° elbow (figure 1). The mixed-flow impeller is open with the tip clearance of 0.002 RT2, where RT2is the radius of the blade tip at the impeller outlet. It has five blades. The pump provides a very high efficiency and stable characteristics for the flow regimes above 70% of the optimal flow rate Q_opt, but it shoves flow and cavitation instabilities below the flow rate of 0.7 Q_opt.
Figure 1. Mixed flow pump with 90° elbow.
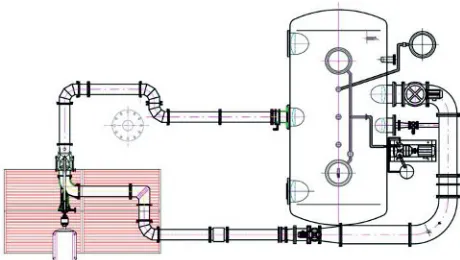
The test rig represents a closed, horizontal plane water circuit for model pumps with the power input up to 400 kW (figure 2). The loop is equipped with both the compressor and the vacuum pump capable of creating different pressure levels while maintaining constant volume flow rate. The capacity of the main tank is 35 m3. To maintain the quality of water and to remove the solid particles which could affect the heterogenous nucleation in the water during the tests, the filtration unit was added in the bypass between the end of the discharge piping and the main tank. The filter is able to treat the particles with the minimum size of 10 µm. To measure the volume flow rate, the magnetic-inductive flowmeter is applied. It works in the accuracy class of 0.3%. For all measurements of the pressure differences, the transducers of the accuracy class 0.1% are used. The temperature of the water is measured with the platinum thermometer in the class of accuracy 0.5%. To enable monitoring of the cavitation nuclei in the inlet flow, a bypass section is installed allowing to measure the nuclei content using the ABS acoustic bubble spectrometer.
Figure 2. Closed experimental loop with main tank.
Pump investigated in this project has been equipped with transparent windows and inspection holes for an endoscope, which enabled (together with a stroboscope) the visualization of flow and cavitation phenomena for a wide range of flow conditions (figure 3).
Figure 3. Pump at the test rig and transparent windows in the pump suction part.
3 CFD tools and computational model
The computational domain includes the comlete pump as well as the straight pipes in front of the pump and behind the elbow so as to set the boundary conditions correctly. Fully transient calculations have been applied with the time step chosen according to the angular speed ȍ; there are 180 time steps during one shaft revolution, which means that every time step the rotor rotates by 2 degrees. With such a time step five inner coefficient loops per step are sufficient to reach a convergent solution. Two transient rotor-stator interfaces have been used; one between the inlet piping and the impeller and the other one between the impeller and the diffuser. To control the flow rate, the net positive suction head as well as the turbulence during calculation, we have set the total pressure together with the flow direction, the 5% turbulence intensity and the zero void fraction at the inlet of the computional domain and the bulk mass flow rate at the outlet.
4 Flow instability at high NPSH values
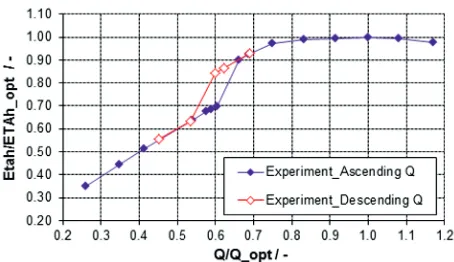
As it has been already said the pump provides a stable H(Q) curve and a very flat efficiency curve Ș(Q) for the flow regimes above 70% of the optimal flow rate, but it shoves the instability in the flow characteristic at approximately 60% of the optimal flow rate. Moreover this instability is accompanied with the transient hysteresis. Figures 4-5 show the normalized H(Q) and Ș(Q) curves as they were measured in the test rig. It is possible to compare them with the data obtained from the CFD analysis (figures 6-7). As there is a small difference between the optimal flow rates for the measurements and numerical analysis, we refer in this article to the relative
Figure 4. Pump H(Q) characteristic. Experiment.
Figure 5. Pump overall efficiency Ș(Q). Experiment.
flow rate Q/Q_opt . It can be seen that the drop of the pump total head depends on the direction in which the flow rate changes during the tests, both in the case of experiments and CFD calculations.
The visualiations of flow phenomena in the suction part of the pump indicated that at the flow rates approximately 60% of the optimal one there are sudden changes of the flow in front of the impeller close to the shroud. It corresponds well with the measurements made by Kaupert and Staubli [8] who linked the flow instability to the behaviour of the impeller inlet recirculation and the hysteresis of the characteristic to the significant dynamics of this recirculation.
Figure 6. Pump H(Q) characteristic. CFD.
Figure 7. Pump hydraulic efficiency Șh(Q). CFD.
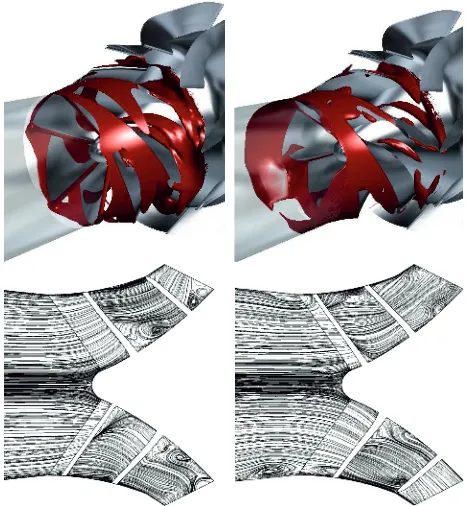
A comprehensive CFD analysis has been done to clear the flow in the pump impeller up for critical flow regimes (Q/Q_opt in the range from 0.54 to 0.7) which are indicated schematically in figure 8. Figures 9-10 show the impeller inlet recirculation in the points P0 and P4.
In points P0 and P1d there is practically no impeller inlet recirculation and the backflow in front of the impeller is caused only by the tip leakage. In point P4 we can find fully developed impeller inlet recirculation. In the rest of the points we can find very ubstable behaviour of the backflow region which changes its size and shape in time as it can be seen in figure 11.
Concerning the instability shown above there are two important questions. The first one concerns the difference between the experimental data and the CFD analysis as the head drop and hysteresis are considerably stronger in the results of measurements. The second question is linked to the influence of cavitation phenomena on the instability. The measurements were carried out at different values of the net positive suction head (NPSH) between NPSHi and NPSH3 (figures 12-13). Here NPSH3 is defined as the net positive suction head required for the 3% drop of the total head of the pump and NPSHi represents the net positive suction head required for the cavitation inception. Results indicate that the head drop as well as the shape of hysteresis only weakly depend on the pressure level in front of the pump. On the other hand the CFD analysis was performed as the fully noncavitating flow. As we can see, in the critical regimes (Q/Q_opt in the range from 0.54 to 0.7) the NPSHi and NPSH3 curves reach their local maxima. The local maxima of the NPSHi and NPSH3 curves correspond also well with the position of sudden rise of noise and vibrations in the pump (figures 14-15). It means that the cavitation phenomena may influence the flow pattern in the suction part of the pump in some way.
Figure 9. Backflow (in red/dark) in front of the impeller and streamlines in the meridional cross-section.
Point 0 from figure 8.
Figure 10. Backflow (in red/dark) in front of the impeller and streamlines in the meridional cross-section.
Point 4 from figure 8.
Figure 11. Periodic changes of backflow (in red/dark) in front of the impeller. Point 2a from figure 8.
investigastions, both experimental and numerical, in spite of the fact that it will require very comprehensive measurements, visualizations and calculations for a large set of flow regimes.
Figure 12. Cavitation inception in pump. CFD analysis.
Figure 13. NPSH3 and NPSHb values of pump.
Figure 14. Noise level. NPSH = 17 m.
Figure 15. Vibrations at the pump outlet. NPSH = 17 m.
Figure 16. Dynamics of cavitation regions (in white) in the impeller. CFD. Void fraction 10%. Point P2a from figure 8, NPSH = 17 m.
Figure 17. Dynamics of cavitation regions (in white) in the impeller. Experiment. Point P2a from figure 8, NPSH = 17 m.
5 Cavitation instability close to NPSH3
value
of the cavitation dynamics at the flow rate Q/Q_opt= 0.6 and gradually decreasing values of NPSH. We have found the instability in which the cavitation clouds in front of the impeller change their size and shape and separate from the blades with frequency lower than the shaft rotational frequency fȍ (figure 18). This instability starts
at low NPSH values very close to NPSH3, which agrees well with the results obtained in [10].
Figure 18. Cavitation instability in backflow vortices. CFD. Void fraction 10%, Q/Q_opt = 0.6, NPSH = NPSH3. Backflow is in red/dark, cavitation in white.
To determine correctly the frequency spectrum we performed the frequency analysis based on the Fast Fourier Transformation (FFT). The results are shown in figure 19. The dominant frequencies can be found at the values of about 0.44fȍ and 3.8fȍ and we can also see the
increased amplitudes close to the value of 1.4fȍand in the vicinity of the shaft frequency. As far as the amplitudes in the vicinity of fȍ are concerned, they reflect the fact that the calculated flow inside the impeller passages is not perfectly periodic. The lowest frequency 0.44fȍ can be
connected with the cavitation clouds, which separate periodically from the backflow region in front of the impeller. The second frequency which characterizes the periodic changes of the cavitation in the backflow region is 3.8fȍ. Another periodic phenomenon which was detected is connected with the cavitation regions on the suction side of the impeller blades. They change their size and shape with the frequency of 1.4fȍ.
Figure 19. FFT analysis of cavitation instability in backflow vortices. CFD. Q/Q_opt = 0.6, NPSH = NPSH3.
It is interesting that the frequencies of 0.44fȍ and
3.8fȍ are suppressed when the NPSH drops to the value
of NPSHb (figure 13), where NPSHb is defined as the net positive suction head in which the total cavitation breakdown appears. We have found that in this regime the cavitation clouds remarkably block the impeller passages and so the backflow in front of the impeller practically vanishes. We can therefore conclude that frequencies of 0.44fȍ and 3.8fȍ are strongly linked to the interaction of cavitation and the backflow in front of the impeller.
6 Conclusion
The presented experimental and numerical analysis has provided a good picture of the cavitation structures inside the pump and their dynamics for a wide range of flow rates and NPSH values. Both flow and cavitation instabilities were detected at the flow rate about 60% of the optimal one, causing the sudden drop of the pump total head and strong vibrations and noise. These instabilities are linked with the impeller inlet recirculation. Consequently the question arises if there is a treatment which could reduce the backflow region close to the shroud in front of the impeller for suboptimal flow rates. This treatment should not decrease a very high hydraulic efficiency of the pump close to the best efficiency point but also should not worsen the pump cavitation properties including the cavitation erosion risk. The matter of our continuous work should be therefore the design and verification of such device.
Acknowledgments
This work has been supported by the Czech Science Foundation under the grant no. 101/13/23550S “Experimental Research and Mathematical Modelling of Unsteady Phenomena Induced by Hydrodynamic Cavitation”.
References
1. M.J. Os, J.G.H. Op de Woerd, and J.B. Jonker, ASME FEDSM97-3374 (1997)
2. T. Nagahara, T. Sato and T. Okamura, CAV2001:sessionB8.006 (2001)
3. M. Sedlar, TASK QUARTERLY 5, 4 (2001) 4. M. Sedlar, F. Marsik and P. Safarik, 3rd Heat (2002) 5. K. Yamamoto and Y. Tsujimoto, IJFMS, 2, 1 (2009) 6. H.W. Oh, IMechE 224, JPE986 (2010)
7. I. Harada, K. Kobayashi, and S. Ono, IJFMS 3, 2 (2010)
8. K. A. Kaupert and T. Staubli, ASME J. Fluid E. 121 (1999)
9. K. Kobayashi and Y. Chiba, IJFMS 3, 2 (2010) 10. M. Sedlar, O. Sputa and M. Komarek, IJFMS 5, 1
(2012)