1
Reusability of SPE and Sb-modified SPE sensors for trace Pb(II) determination
Matjaž Finšgar∗,1, David Majer1, Uroš Maver2, Tina Maver3
1University of Maribor, Faculty of Chemistry and Chemical Engineering, Smetanova ulica 17, 2000
Maribor, Slovenia
2University of Maribor, Faculty of Medicine, Institute of Biomedical Sciences, Taborska ulica 8, SI-2000
Maribor, Slovenia
3University of Maribor, Faculty of Mechanical Engineering, Smetanova ulica 17, 2000 Maribor,
Slovenia
Graphical abstract
Abstract
In this work, unmodified screen-printed electrode (bare SPE) and Sb-film modified SPE (SbFSPE) sensors were employed for the analysis of trace amounts of Pb(II) in non-deaerated water solutions. The modified electrode was performed in situ in 0.5 mg/L Sb(III) and 0.01 M HCl. The methodology was validated for an accumulation potential of –1.1 V vs. Ag/AgCl and an accumulation time of 60 s. A comparative analysis of bare SPE and SbFSPE showed that the detection and quantification limits decrease for the bare SPE. The method with the bare SPE showed a linear response in the 69.8–368.4 µg/L concentration range, whereas linearity for the SbFSPE was in the 24.0– 319.1 µg/L concentration range. This work also reports the reason why the multiple standard addition method instead of a linear calibration curve for Pb(II) analysis should be employed. Furthermore, the analytical method employing SbFSPE was found to be more accurate and precise compared to the use of bare SPE when sensors were employed for the first time, however this performance changed significantly when these sensors were reused in the same manner. Furthermore, electrochemical impedance spectroscopy was used for the first time to analyse the electrochemical response of sensors after being used for multiple successive analyses. Surface characterisation before and after multiple successive uses of bare SPE and SbFSPE sensors, with atomic force microscopy and field emission scanning electron microscopy, showed sensor degradation. The interference effect of Cd(II), Zn(II), As(III), Fe(II), Na(I), K(I), Ca(II), Mg(II), NO3– Bi(III), Cu(II), Sn(II), and Hg(II) on the Pb(II) stripping signal
was also studied. Finally, the application of SbFSPE was tested on a real water sample (from a local river), which showed high precision (RSD = 8.1%, n = 5) and accurate results.
Keywords: Screen-printed electrode; Sb-film electrode, SPE; SbFE; stripping analysis; EIS
∗Corresponding author
Address: University of Maribor, Faculty of Chemistry and Chemical Engineering, Smetanova ulica 17, 2000 Maribor, Slovenia
e-mail: [email protected]; phone: +386 2 2294 447
2
1. Introduction
The natural environment and the environment polluted by humans contain different types of heavy metals. Monitoring of trace heavy metals is extremely important in order to prevent their bioaccumulation and other health-related problems. Such analyses are usually carried out using spectroscopic techniques, such as inductively coupled plasma mass spectrometry (ICP-MS), inductively coupled plasma optical emission spectrometry (ICP-OES), and atomic absorption spectrometry (AAS). An alternative is electroanalytical analysis, which is advantageous not only due to its low instrumentation and analysis costs, but also as it enables on-site analysis, directly after the sampling is carried out (e.g. from a lake, river, etc.). Among the electroanalytical techniques, anodic stripping voltammetry (ASV) is among the most effective due to a pre-concentration step enabling trace or ultra-trace analysis of different heavy metals with high sensitivity, accuracy, and precision [1].
This work is focused on the detection of Pb(II), a heavy metal with proven toxicity for humans. The usual consequences of Pb uptake can be observed in gastrointestinal, neuromuscular, and neuropathological symptoms. These are most severe after longer exposure times and are especially serious in children below six years of age, whose mental and physical development can consequently decrease. Pb poisoning can also be fatal [2]. Considering everything mentioned above, it is clear that a disposable, low cost, and portable sensor for Pb(II) detection could be highly beneficial for human health.
Modified electrodes, especially glassy carbon electrodes (GCE), have recently been replacing classic polarography, which uses Hg-based electrodes. In such a manner, mercury waste, following analysis, is avoided – in accordance with the Minamata Convention on Mercury, which has been signed by 128 countries in order to protect human health [3]. Another advantage of some modified electrodes is that they eliminate the need for oxygen removal, which is a necessary and time-consuming step in polarography. Various modified electrodes have been reported, whereas the bismuth-film glassy carbon electrode (BiFE) seems to be one of the best substitutes for the Hg electrode in the electroanalytical determination of traces of heavy metals [4-6]. On the other hand, other substitutes are currently being sought [7]. Among them, antimony-film GCE (SbFE) is another attractive substitute for polarography and even for BiFE [8-16]). Despite the relatively low number of studies in the last decade, this research area is still very attractive due to the advantages compared to classic polarography-based methods and as such is currently being extensively explored. For example, the advantage of using SbFE over BiFE lies in the analysis of Cu(II) traces [17], its wider potential window, the low stripping signal for Sb, the low background contribution, and the possibility of working in more acidic solution with pH ≤ 2 [8, 10, 12]. The above-mentioned electrodes are usually employed in combination with the ASV technique.
Another field in electroanalytical research that is currently expanding is the use of screen-printed electrodes (SPE). The advantages of using SPEs over a conventional three-electrode configuration (working, reference, and counter) are the more convenient setup and the miniaturisation of the system, which facilitates portability. SPE electrodes are widely available from different producers. These electrodes can also be manufactured in an ordinary research laboratory on site by using inexpensive screen-printing equipment, a platform (e.g. ceramic of plastic), and a special ink. Compared to GCE, no polishing step is carried out before the analysis with the SPE [18, 19], which makes these electrodes far more convenient. By combining the above-mentioned technologies, a new system can be developed, i.e. the antimony-film screen-printed electrode (SbFSPE). Currently, the most used working electrode platform material for SPE is carbon [8]. Sb-film can be electrodeposited on the working electrode in situ during the pre-concentration step or ex situ before the pre-concentration step [8, 12, 13, 17, 20-22].
3 performance after reuse. Evaluation of the possible reusability of such electrodes is one of the main focuses of the present study. Moreover, the evaluation of SbFSPE sensors has never before been evaluated using electrochemical impedance spectroscopy (EIS). In this work, square-wave anodic stripping voltammetry (SWASV) was used to analyse Pb(II) using bare SPE or SbFSPE. These sensors were also microscopically investigated before and after the analytical work. Finally, the interference effect of various ions was checked and the applicability of SbFSPE to real water samples was checked.
2. Materials and methods
All of the electrochemical experiments were performed with a PGSTAT204 potentiostat/galvanostat controlled by Nova 2.1.3 software (Metrohm Autolab B.V., Utrecht, Netherlands) under laboratory conditions (23° ± 2° C).
Where applicable, outliers were checked with both Dixon’s and Grubbs’ statistical tests with 95% confidence [23], but none were detected, and, where applicable, the average values are reported.
2.1 Electrodes
For partial method optimisation and the determination of the optimum accumulation potential (Eaccu), a glassy carbon electrode (GCE) with a diameter of 3 mm (Cat. No. 6.1204.300) and a
Pt wire counter electrode was used. All the potentials in this work refer to an Ag/AgCl electrode filled with saturated KCl (the potential of this reference electrode is 0.197 V vs. standard hydrogen electrode, SHE, at 25 °C). GCE, Ag/AgCl, and Pt electrodes were supplied by Metrohm (Herisau, Switzerland). Polishing of the GCE was performed with 0.05 µm Al2O3 (Buehler, Illinois, USA), followed by washing in
ultra-pure water, cleaning for 5 min in an ultrasound bath containing ultra-pure water, and drying (with a paper towel without touching the active surface).
SPE sensors (DS 110) were supplied by DropSens (Llanera, Spain). These sensors were constructed of carbon-based working (4 mm in diameter) and counter electrodes, and an Ag pseudo reference electrode. In all experiments using SPE sensors an external Ag/AgCl electrode was employed instead of an Ag pseudo reference electrode to better control the reference potential.
2.2 Solutions and reagents
All of the analytical work was performed in a 0.01 M HCl supporting electrolyte. HCl and KCl were supplied by Carlo Erba Reagents (Val de Reuil, France). Atomic absorption standard stock solutions (1000 mg L–1) of Pb(II), Sb(III), Cd(II), Zn(II), Sn(II), Bi(III), Cu(II), and As(III) were purchased
from Merck (Darmstadt, Germany). (NH4)2Fe(SO4)2 · 6H2O, NaCl, and KNO3 were purchased from Sigma
Aldrich (St. Louis, Missouri, USA), while CaCl2 and MgCl2 were supplied by Acros Organics (New Jersey,
USA). Potassium hexacyanoferrate(III) powder was supplied by Sigma Aldrich. All chemicals were of analytical grade purity.
Ultra-pure water with a resistivity of 18.2 MΩ cm was employed to prepare all solutions (prepared using the Milli-Q water purification system, Millipore Corporation, Massachusetts, USA).
2.2.1 Real sample analysis
4 additions). By using Whattman glass fibre filters (0.45 µm pore size), the water sample was filtered after preparation and before analysis [13].
2.3 Cyclic voltammetry
In order to check the reversibility of the SPE sensor, a cyclic voltammetry (CV) test was performed. This experiment was carried out in 1.0 M KCl containing 10 mM K3[FeCN6]. The CV experiment started
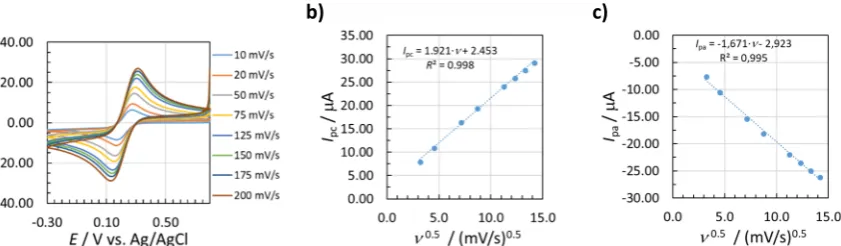
at 0.8 V with a negative-going potential scan until –0.3 V was reached (switching potential). Then the potential scan was reversed towards more positive potentials until the starting potential was reached. Different sweep rates (ν) were employed in sequence, i.e. 10, 20, 50, 75, 125, 150, 175, and 200 mV/s. During these measurements the solution was not stirred.
2.4 SWASV experiment
The Eaccu was set at –1.1 V for 60 s (pre-concentration step), followed by 15 s equilibration time,
before starting the SWASV experiment. The SWASV measurements were performed using a positive-going square-wave potential scan in the potential region from –1.1 V to 0.3 V, with a potential step of 4 mV, an amplitude of 25 mV, and a frequency of 25 Hz [24]. After each SWASV experiment, a cleaning cycle was performed by applying a potential of 0.3 V for a period of 30 s. During the accumulation and cleaning steps, the solution was stirred, whereas during the equilibration and measurement steps no stirring was employed. All the CV and SWASV experiments were performed without deaeration of the solutions.
2.5 Electrochemical impedance spectroscopy
EIS measurements were performed in the 106–5·10–2 Hz frequency range using an excitation signal
with an amplitude (peak-to-peak) of 10 mV. Five points were measured in each frequency decade. A pre-concentration step (the same as for the Pb(II) analysis, as described in Section 2.4) was performed before EIS analysis was carried out. EIS measurements were performed at –1.1 V. This procedure was performed for both bare SPE and SbFSPE sensors.
2.6 ICP-OES
An ICP-OES instrument, i.e. Agilent 5110 VDV (Santa Clara, California, USA), was used for the determination of Pb(II) in the real water sample. The gas employed was argon with 99.9999% purity (Messer, Maribor, Slovenia). The calibration curves were performed in the presence of yttrium as an internal standard.
2.7 Surface analysis
The surface morphology of the working electrode surfaces were analysed by field emission scanning electron microscopy (FE-SEM). Prior to imaging, the sensors were pressed on double-sided adhesive carbon tapes (SPI 116 Supplies, USA). Micrographs were taken using FE-SEM (Supra 35 VP, Carl Zeiss, Germany) operated at 1 keV at room temperature [25].
The surface topography and roughness parameters of the sensors were measured using an atomic force microscope (AFM) in tapping mode (7500 AFM model, Keysight, Santa Barbara, USA). Silicon cantilevers (ATEC-NC-20, Nanosensors, Germany) with a resonance frequency of 210–490 kHz and a force constant of 12–110 N m–1 were used for all measurements, which were performed at room
temperature. All surfaces were scanned with spot sizes of 1 × 1, 5 × 5, and 10 × 10 μm2, recorded with
5
3. Results and discussion
Hereinafter, the term SbFSPE shall be used for the Sb-film SPE electrode formed in situ using an SPE sensor immersed in 0.01 M HCl containing 0.5 mg/L Sb(III). Thus, in situ Sb-film along with Pb is accumulated on the working electrode during the accumulation step (pre-concentration). The term bare SPE shall hereinafter stand for the system, where the Pb(II) analysis was performed in 0.01 M HCl without Sb(III) in the solution. The 0.01 M HCl supporting electrolyte was chosen in accordance with the first report on the use of an in situ Sb-film formed GCE electrode (SbFE) in that medium [10]. Furthermore, it has been reported that HCl stabilises antimony film [17].
First, partial method optimisation for Pb(II) determination in 0.01 M HCl, in terms of Eaccu (at
taccu = 60 s), was performed using the GCE system and the same Sb-containing solution as in subsequent
SbFSPE experiments. The purpose of this step is to find the optimal Eaccu for the subsequent analyses
with SbFSPE. Partial method validation was performed at Eaccu = –1.0 V, –1.1 V, and –1.2 V. More
negative Eaccu than –1.2 V were not employed due to the intensive hydrogen evolution that starts at
about –1.1 V (as shown below). The optimum Eaccu was determined to be at –1.1 V, where the method
provided the highest precision and accuracy and the widest linear range (as SbFE was not the focus of this study, these results are not shown herein). This analytical method was then transferred to SPE sensors (both SbFSPE and bare SPE), where all Pb(II) measurements were performed at Eaccu = –1.1 V
and taccu = 60 s.
3.1 The reversibility of the redox system for bare SPE
Using CV, the reversibility of the redox reaction was first checked for the potassium hexacyanoferrate system (i.e. a one-electron transfer reaction). The criteria for the reversibility of this system are the following: 1) the anodic peak height (Ipa) and cathodic peak height (Ipc) increase linearly
with an increase in √; 2) the anodic peak potential (Ea) and cathodic peak potential (Ec) do not change
with ν; 3) ΔE = Ea – Ec = 59 mV; and 4) the Ipa/Ipc at a specific ν is 1 [28].
Figure 1a shows the change in the shape of the CV voltamogramms with an increase in ν. Ipa and
Ipc increased linearly with increasing ν(Figures 1b and c) and therefore satisfy criterion 1 (as given
above). On the other hand, Ea slightly shifts to more positive potentials and Ec slightly shifts to more
negative potentials with increasing ν. Moreover, the ΔE values were in the range of 90–95 mV for all three measurement replications at ν = 10 mV/s, and this potential difference increased with increasing ν. Finally, the values of the ratio Ipa/Ipc were 0.89–0.95 when employing ν of 10–200 mV/s. Therefore,
we can conclude that bare SPE deviates slightly from the ideal criteria 2–4 (as given above).
This testing reversibility reaction protocol cannot be repeated with SbFSPE as the Sb-film would dissolve in the anodic cycle at about –0.15 V (shown below).
a) b) c)
Figure 1: SPE electrode immersed in 1.0 M KCl containing 10 mM K3[FeCN6]: a) CV at different scan
6
3.2 Method validation
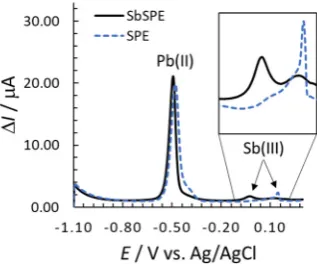
Figure 2 shows SW voltammograms measured in 0.01 M HCl by employing SbFSPE and bare SPE sensors. Intensive hydrogen evolution starts at –1.1 V, otherwise the background signal is low for both sensors. There is a well-defined stripping signal for Pb(II) around –0.5 V for both the SbFSPE and bare SPE sensors. The advantage of using the Sb-film electrode compared to, e.g., the Bi-film electrode lies in its low oxidation stripping signal for Sb(III), as seen at a potential of approx. –0.15 V (for Bi(III) it would be significantly more intensive) [10].
The relatively low intensity peak, which is clearly expressed for bare SPE, at slightly more positive potentials than 0.10 V (as seen from the insert in Figure 2), is related to the oxidation of species present in the bare SPE electrode (the exact composition of this species is not known or important in that stage, as the signal occurs at more positive potentials than for Pb(II)). This peak was shown to always be present in such stripping analyses, as reported below.
Figure 2: Stripping signals of Pb(III) and Sb(III) using SbFSPE and stripping signals of Pb(III) for bare SPE in 0.01 M HCl. The Pb(II) concentration was 164.8 µg/L.
3.2.1 LOD and LOQ determination
The limit of detection (LOD) and limit of quantification (LOQ) were determined experimentally based on the signal-to-noise ratio (S/N) obtained by performing a SWASV measurement by successively injecting trace amounts of Pb(II) and measuring the current response in voltammograms. LOD and LOQ were determined based on the S/N ratio at a certain Pb(II) concentration, for which S/N ≥ 3 and S/N ≥ 10, respectively.
For SbFSPE, the determined LOD was 1.5 µg/L (at S/N = 4.6) and the LOQ was 3.0 µg/L (at S/N = 12.3). For bare SPE, the LOD and LOQ were determined to be 0.5 µg/L (at S/N = 3.5) and 1.5 (at S/N = 11.5), respectively. Considering the above results, it can be concluded that the formation of the in situ SbFSPE increases the LOD and LOQ values.
3.2.2 Linearity
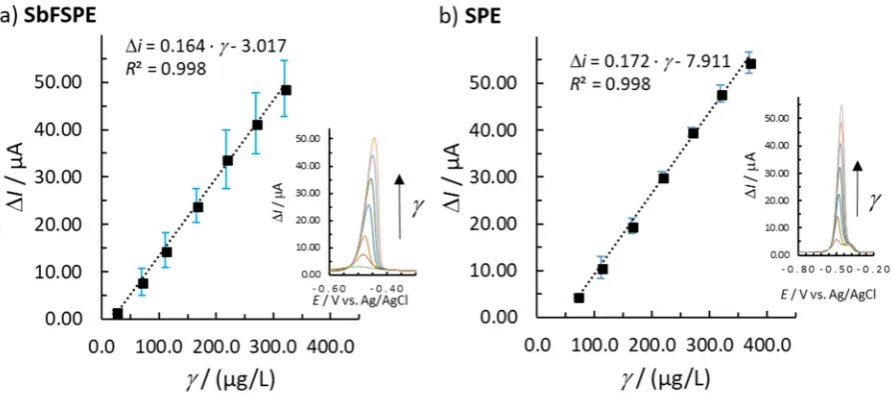
Figure 3 shows the concentration range for Pb(II) determination, regarding which the response (Δi) was fitted with the linear calibration plot using the linear least squares regression method. Linearity was confirmed if a correlation coefficient of R2 > 0.99 was obtained. Moreover, to accept the
linear concentration range, y-residuals (ymeasured – ymodel, i.e. Δimeasured – Δimodel) needed to be randomly
distributed with increasing Pb(II) concentration. Finally, to accept linearity in a certain concentration range, the data also needed to pass the quality coefficient test with a QC < 5.0%. The normal distribution was also checked by the quantile-quantile or Q-Q plot [29].
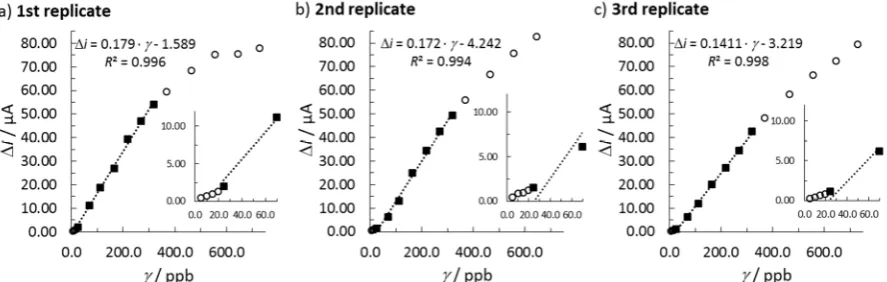
7 the 5.0–69.8 µg/L concentration range was also checked to determine if a second linearity existed, but the presence of such was not determined (the same was also checked for SbFSPE for concentrations lower than 24.0 µg/L and such linearity was not determined). Measurements were performed in triplicates; each point shown is an average signal and the corresponding error bars represent the standard deviation at each concentration point measured. The determined standard deviations are not large for the measurements with bare SPE, whereas they are relatively large for a single response at a certain concentration point for SbFSPE (the standard deviations also increase with increasing Pb(II) concentration). This could indicate a heteroscedastic data distribution and the need for the weighted regression. However, in the performed analyses three new sensors were employed, which could potentially mean that the sensors exhibit minor differences (e.g. a minor composition difference, slightly different measurement areas, etc.). Due to the latter, it is rather recommended to employ the multiple standard addition method for the determination of an unknown Pb(II) concentration instead of using the calibration plot method. This is confirmed by the fact that the slope and the intercept change when successive linear calibration plots are performed with new SbFSPE sensors (also seen in Figure 6a). However, for these measurements the linear range is preserved (Figure 4). Moreover, compared to the results reported in Refs. [12, 13], it can be concluded that by employing shorter taccu
the linear range substantially increases, but the sensitivity decreases (evaluated from the slope of the calibration curve).
The stripping signal for Pb(II) develops in a potential range from –0.575 V to –0.449 V for SbFSPE, and in a potential range from –0.493 to –0.414 V for bare SPE by increasing the Pb(II) concentration from 5.0 to 555,6 µg/L. In general, the peak potential shifts to more positive potentials with increasing Pb(II) concentration for both bare SPE and SbFSPE systems (Figure 5), apart from one break in the case of bare SPE when the Pb(II) concentration increases from 47.6 µg/L to 69.8 µg/L (Figure 5b). The reason for such a feature lies in the formation of two peaks (as seen in Figure 5c). At Pb(II) concentrations higher than 69.8 µg/L, the peak at more negative potentials prevails, which is then used as a representative signal and for this reason the method linearity starts at that concentration point. The development of two peaks for Pb(II) was also found previously using a multi-walled carbon nanotube modified screen-printed electrode. For such electrode, this phenomena was ascribed to the lack of uniformity in the sample, which enabled the antimony ions to deposit in different ways in the pre-concentration step [13].
8 Figure 4: Individual calibration plots for SbFSPE. The rectangles represent the linear range, and the circles represent measurements outside the linear concentration range.
Figure 5: a) The change in peak potential vs. Pb(II) concentration for a) SbFSPE and b) bare SPE. Figure c shows the corresponding voltammograms for bare SPE; the error bars represent the standard deviation.
3.2.3 Accuracy and precision
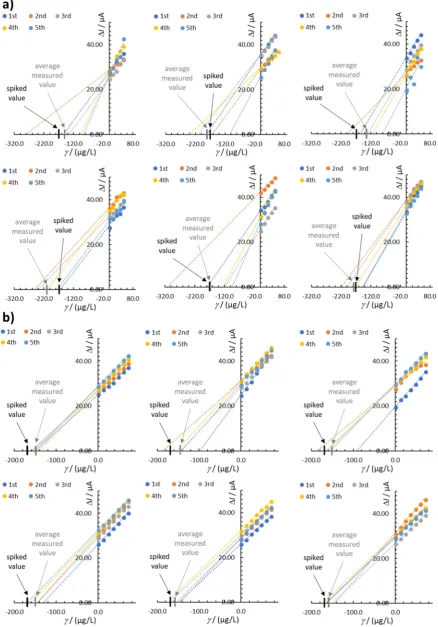
The accuracy was evaluated by spiking 169.1 µg/L Pb(II) in 0.01 M HCl solution using both SbFSPE and bare SPE electrodes (both sensors were shown to have a linear response at this concentration). Figure 6 shows the results obtained by employing the multiple standard addition method using 12 completely new sensor electrodes (6 for analyses with SbFSPE and 6 for bare SPE). The measured (determined) value of the Pb(II) concentration should be considered as the value where the curve crosses the x-axis in Figure 6. The analytical method using SbFSPE for Pb(II) determination seems to be more accurate (the difference between the average measured value and the true value is lower) compared with that for bare SPE (Figure 6a vs. Figure 6b) when using single sensors for the first time. The average recovery for SbFSPE was 97.0%, whereas the average recovery for bare SPE was 77.4%. The accuracy was also evaluated using a Student’s two-tailed t-test at 95% confidence. According to that test, the t values were 0.87 and 3.14 for SbFSPE and bare SPE, respectively. Therefore, according to the desired texp < ttab (0.05; 5) = 2.57, SbFSPE reported accurate results,
whereas bare SPE did not (as texp = 3.14 > ttab = 2.57) for the first use of the respective sensor.
Higher precision was also determined in the case of SbFSPE compared with bare SPE when performing the first analysis with 6 new sensors. This can also be seen in Figure 6b, where the measured values were more intensively scattered around the average value compared with that in Figure 6a. The RSD values for SbFSPE and bare SPE were 8.7 % (n = 6) and 22.7% (n = 6), respectively.
9 method using bare SPE. It is important to note once more that this is true for the first-time use of the sensor. After reuse, different performances of the electrodes were determined, which will be further explained below.
Figure 6: Representation of the accuracy and precision by employing the multiple standard addition method for six new electrodes used for the first time in 0.01 M HCl solution spiked with 169.1 µg/L Pb(II): a) SbFSPE and b) bare SPE.
3.2.4 Reusability of SbFSPE and bare SPE sensors
One of the most important (and yet to be answered) questions with regard to SPE sensor use is how many consecutive analyses can be conducted using one electrode (reusability). SPE electrodes are in general meant to be disposable, but this does not mean that they can only be used to conduct one analysis. As already mentioned in the introductory section, this is the first study to determine the number of successive (and reliable) measurements using these sensors before discarding them.
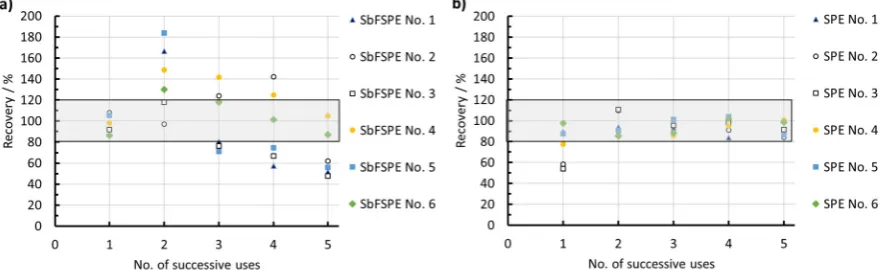
11 Figure 8 shows how the performance of SbFSPE and bare SPE sensors change in terms of recovery values when using the same sensor for five successive determinations of Pb(II) by the multiple standard addition method. The 0.01 M HCl solution was spiked with a 169.1 µg/L Pb(II) concentration. As reported above, SbFSPE produced accurate and precise results when a completely new sensor was employed (i.e. it was used for the first time). When the same SbFSPE sensors were used for the second time, four of six SbFSPE sensors showed results that were outside the 80–120% recovery values, and thus produced inaccurate results (Figure 8a). With further use (from the third to fifth instance of use), the SbFSPE sensors mainly produced inaccurate results outside the 80–120% recovery range (the method was deemed to be accurate when the recovery was between 80–120% [30]).
In contrast to the SbFSPE sensor, the first use of the bare SPE sensor in general produced inaccurate results (three out of six sensors reported recovery values outside the 80–120% recovery range and the determined average values of the six sensors used did not pass the t-test, as reported above), further use of the same sensors resulted in recovery ranges inside the 80–120% recovery range limits. It seems that the bare SPE sensor in this medium needs some pre-activation to provide accurate results. The change in electrochemical performance with successive use is also demonstrated (and further discussed) below in Section 3.3 using the EIS technique.
Figure 8: Recovery vs. the number of successive multiple standard addition analyses using the same sensor (repeated for six a) SbFSPE and six b) bare SPE sensors).
3.3 Electrochemical impedance spectroscopy measurements
Figure 9 shows the Nyquist spectra measured after the accumulation step (repeated five times; at Eaccu = –1.1 V, taccu = 60 s) and cleaning step. Using such an approach, electrochemical evaluation of the
change in sensor performance after reuse can be reported. The shape (a semicircle) of the spectra for SbFSPE indicates a charge-transfer-controlled reaction (a kinetic-controlled reaction). On the other hand, the Nyquist spectra for the bare SPE sensor show that the system is also under diffusion control (besides kinetic control), as the measured curve deviates from a semicircle in the low frequency region (at high Zreal) in a manner typical of a diffusion-controlled reaction [31, 32].
Figure 9a shows that the electrochemical performance of the SbFSPE sensor changes with successive use, with a decrease in the resistance of the system after each use (Zreal decreases with
12 Figure 9: Successive EIS measurements for a) SbFSPE and b) bare SPE.
3.4 Surface morphology and topography characterisation
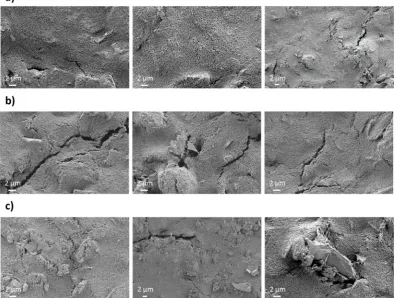
Figure 10 shows the surface morphology of the working electrode before and after five-time use (the micrographs shown are only for those electrodes that produced results, which are reported in Figure 6 – measurements for three out of six sensors are presented). The surface morphology of the SPE sensors before use is given in Figure 10a, with some minor cracks present in the surface of the working electrodes. The reusability of such sensors in the system containing Sb(III) (SbFSPE) induces wider cracks on the surface, as seen in Figure 10b. In certain places on the working electrode surface the carbon-based working material starts to peel off. The latter effect was even more expressed for bare SPE, as seen in Figure 10c.
13 Figure 11 shows 3D-profiles and the corresponding extracted profiles for the sensor before use, and bare SPE and SbFSPE sensors after five successive uses (the same as for the SEM analyses). Based on the measured 3D-profiles, mean surface roughness, Sa, was calculated. Sa is based on general
surface roughness; the higher the Sa value, the rougher the surface is [34]. AFM measurements were
performed on three different sensors (before use, bare SPE, and SbFSPE) and one of these measurements is presented.
Figure 11a shows the surface topography of the SPE sensor before use. The surface of this working electrode is relatively smooth. No significant defects (e.g. deep holes) were found at different places on the working electrode. The average Sa value for that system was 52±20 nm (calculated on
the basis of 12 measurements at different places and on 3 sensors). On the other hand, some minor defects were observed for SbFSPE after being reused five times; however, no deep holes were detected (Figure 11b). The roughness of that working electrode surface was similar compared to that for the SPE sensor before use. The average Sa value for SbFSPE was calculated as being 49±22 nm. On the
other hand, Figure 11c shows a typical defect formed on a working electrode surface of bare SPE after five successive uses by employing the multiple standard addition method to determine Pb(II) concentration. The corresponding profile shows that a hole approx. 0.6 µm deep was formed after five successive uses of that sensor. The average Sa value for the latter system was 68±32 nm. Therefore,
the reusability of bare SPE induces changes in the working electrode topography more significantly compared to SbFSPE (as also confirmed by SEM measurements).
14
3.5 Interference study
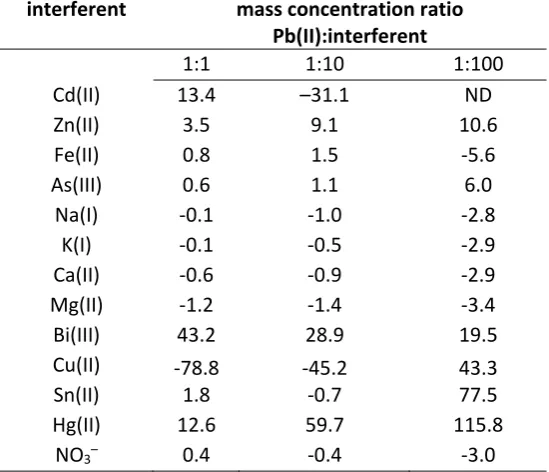
The interference effect of different compounds (probable interferents) on the Pb(II) stripping signal, which could possibly be present in real water samples, was checked by preparing solutions with a Pb(II):interferent mass concentration ratio of 1:1, 1:10, and 1:100 [15]. The analysis was performed for SbFSPE as it showed accurate and precise results when used for the first time in 0.01 M HCl solution (see Section 3.2.4). The calculated influence as to how much the interferents increase or decrease the Pb(II) stripping signal is summarised in Table 1. By means of this approach it was possible to clearly show which interferent has an influence on the Pb(II) stripping signal (if any influence is present, the ratio deviates from 1). The influence can be observed by either an increase in the Pb(II) peak (a positive effect) or a decrease in the Pb(II) peak (a negative effect).
In the case of equal amounts of Cd(II) and Pb(II), i.e. a 1:1 ratio, a more intensive Pb(II) signal was obtained. On the other hand, at higher Cd(II) concentrations the Pb(II) signal decreased. At a 1:100 Pb(II):Cd(II) ratio, the Pb(II) and Cd(II) stripping peaks overlapped, and therefore Pb(II) cannot be detected (Figure 12a).
Zn(II), Fe(II), Na(I), As(III), K(I), Ca(II), and Mg(II), and NO3– have a minor influence on the Pb(II)
signal (Figure 12b-h,m). As expected, Bi(III), Cu(II), Sn(II), and Hg(II) significantly influence the Pb(II) stripping signal when they are employed at high concentrations (Figure 12i-l), as these ions are used to form the in situ electrode.
Table 1: The influence of different compounds on the Pb(II) peak height: the values are calculated as the change in % = ∙ 100%, where Iinterferent and IPb(II) are the stripping signals for
Pb(II) at 200.0 µg/L, with and without the presence of interferent, respectively, in 0.1 M HCl solution [15].
interferent mass concentration ratio Pb(II):interferent
1:1 1:10 1:100
Cd(II) 13.4 –31.1 ND
Zn(II) 3.5 9.1 10.6
Fe(II) 0.8 1.5 -5.6
As(III) 0.6 1.1 6.0
Na(I) -0.1 -1.0 -2.8
K(I) -0.1 -0.5 -2.9
Ca(II) -0.6 -0.9 -2.9
Mg(II) -1.2 -1.4 -3.4
Bi(III) 43.2 28.9 19.5
Cu(II) -78.8 -45.2 43.3
Sn(II) 1.8 -0.7 77.5
Hg(II) 12.6 59.7 115.8
NO3– 0.4 -0.4 -3.0
15 Figure 12: SWASV voltammograms measured using SbFSPE in 0.01 M HCl containing 200.0 µg/L Pb(II) with and without possible interferents at a mass concentration ratio of 1:1, 1:10, and 1:100 relative to Pb(II).
3.6 Analytical application of real water samples
The applicability of the SbFSPE sensor was also checked with regard to a real water sample (as it showed accurate and precise results when used for the first time in the model 0.01 M HCl solution (see Section 3.2.4)). As shown above, the standard addition method had to be employed when using the SbFSPE sensor. Moreover, by using this procedure the matrix effects in the analysis of the real water sample are minimised. The applicability of the SbFSPE sensor was tested regarding a real river water sample in order to check for possible interference effects. Five replicate measurements using the multiple standard addition method were performed, each time using a new sensor and freshly prepared solutions.
No stripping Pb(II) signal was detected for the river water sample (the results are not shown herein), therefore the Pb(II) concentration in this sample was below the LOD of the method. The same was confirmed by the ICP-OES referential technique. Next, this water sample was spiked with 169.1 µg/L Pb(II), and the multiple standard addition method was employed to determine the Pb(II) concentration to check for any possible interference effect. A well-defined Pb(II) stripping peak developed (the same as for the calibration plots given above; the voltammograms are not shown). The interference effect was assessed based on a two-sample t-test (two-tailed and small sample populations) for equal means. The river water sample and the model solution (prepared with ultra-pure water, as was done for the method validation study presented above) had statistically equal variances (assessed on the basis of a two-tailed F-test at 95% confidence). Moreover, based on the calculated experimental t-value for the two sample means with statistically equal variances at 95% confidence, which was lower than the critical t-value (as texp = 0.68 < ttab = 2.30), it can be concluded
16
4. Conclusions
Screen-printed electrode (SPE) sensors are, in general, meant to be disposable. However, possible reuse – for at least a few times before being discarded – is frequently not, if at all, reported. In this work, SPE with a carbon-based working electrode was employed for Pb(II) trace analysis. First, the reversibility of the system using potassium hexacyanoferrate-containing solution and cyclic voltammetry was checked, where some deviation from the ideal reversible diffusion-controlled system was noted. Despite this, the SPE sensor was shown to be suitable for Pb(II) determination. Next, the method’s analytical performance in 0.01 M HCl solution with an accumulation potential of –1.1 V vs. Ag/AgCl and an accumulation time of 60 s was validated. The carbon-based surface of the working electrode was employed in either an unmodified (bare SPE sensor) or Sb-film modified (formed in situ, SbFSPE sensor) form. It was found that the detection and quantification limits were lower when employing the bare SPE sensor. Linear concentration ranges were 69.8–368.4 µg/L and 24.0–319.1 µg/L, for the bare SPE and SbFSPE sensors, respectively. The accuracy and precision were significantly better for SbFSPE compared with SPE when these sensors were employed for the first time. However, with successive use of the same sensors, the accuracy and precision became worse for SbFSPE, whereas bare SPE produced even more accurate results when used for the second time (even up to the fifth use). This implies that bare SPE in such medium needs pre-activation, which was ascertained by the first analysis. Electrochemical impedance spectroscopy measurements showed that successive use of SbFSPE and bare SPE sensors change their electrochemical properties. It was also shown that the system was under kinetic-control in the case of SbFSPE, whereas bare SPE followed a kinetic- and diffusion-controlled process. AFM and SEM showed that successive use degrades the surface of both sensors (SbFSPE and bare SPE) after multiple use. In the interference study for SbFSPE, the presence of Cd(II) increased the Pb(II) signal when present at equal concentrations, whereas at a 10-time higher Cd(II) concentration compared to Pb(II), the Pb(II) signal decreased. When Zn(II), As(III), and Fe(II), Na(I), K(I), Ca(II), and Mg(II), and NO3– ions were present individually, along with Pb(II), no significant
change in the Pb(II) signal was found. On the other hand, Bi(III), Cu(II), Sn(II), and Hg(II) significantly influenced the Pb(II) stripping signal. The applicability of the SbFSPE sensor was also proven for the real sample analysis, i.e. river water, which provided accurate and precise results. This work, therefore, reports an analytical method that is inexpensive, produces a relatively fast analysis, and enables use on-site.
Acknowledgements
The authors would like to acknowledge the financial support for this project received from the Slovenian Research Agency (Grant Nos. P2-0032, P3-0036, and J1-9169).
5. References
1. Lu, Y.; Liang, X.; Niyungeko, C.; Zhou, J.; Xu, J.; Tian, G., A review of the identification and detection of heavy metal ions in the environment by voltammetry. Talanta 2018, 178, 324-338.
2. Jovanovski, V.; Hrastnik, N. I.; Hočevar, S. B., Copper film electrode for anodic stripping voltammetric determination of trace mercury and lead. Electrochemistry Communications
2015, 57, 1-4.
3. Minamata Convention on Mercury, http://www.mercuryconvention.org/
4. Wang, J.; Lu, J.; Hocevar, S. B.; Farias, P. A. M.; Ogorevc, B., Bismuth-Coated Carbon Electrodes for Anodic Stripping Voltammetry. Anal Chem 2000, 72, (14), 3218-3222. 5. Jovanovski, V.; Hočevar, S. B.; Ogorevc, B., Bismuth electrodes in contemporary
electroanalysis. Current Opinion in Electrochemistry 2017, 3, (1), 114-122.
17 7. Koshy, O.; Pottathara, Y. B.; Thomas, S.; Petovar, B.; Finšgar, M., A flexible, disposable
hydrogen peroxide sensor on graphene nanoplatelet-coated cellulose. Current Analytical Chemistry 2017, 13, (6), 480-487.
8. Serrano, N.; Díaz-Cruz, J. M.; Ariño, C.; Esteban, M., Antimony- based electrodes for analytical determinations. TrAC Trends in Analytical Chemistry 2016, 77, 203-213.
9. Pauliukaite, R.; Metelka, R.; Švancara, I.; Królicka, A.; Bobrowski, A.; Norkus, E.; Kalcher, K.; Vytřas, K., Screen-printed carbon electrodes bulk-modified with Bi2O3 OR Sb2O3 for trace determination of some heavy metals. Sci. Pap. Univ. Pardubice, Ser. A 2004, 10, 47-58. 10. Hocevar, S. B.; Švancara, I.; Ogorevc, B.; Vytřas, K., Antimony Film Electrode for
Electrochemical Stripping Analysis. Analytical Chemistry 2007, 79, (22), 8639-8643. 11. Pérez-Ràfols, C.; Trechera, P.; Serrano, N.; Díaz-Cruz, J. M.; Ariño, C.; Esteban, M.,
Determination of Pd(II) using an antimony film coated on a screen-printed electrode by adsorptive stripping voltammetry. Talanta 2017, 167, 1-7.
12. Sosa, V.; Barceló, C.; Serrano, N.; Ariño, C.; Díaz-Cruz, J. M.; Esteban, M., Antimony film screen-printed carbon electrode for stripping analysis of Cd(II), Pb(II), and Cu(II) in natural samples. Analytica Chimica Acta 2015, 855, 34-40.
13. Pérez-Ràfols, C.; Serrano, N.; Díaz-Cruz, J. M.; Ariño, C.; Esteban, M., New approaches to antimony film screen-printed electrodes using carbon-based nanomaterials substrates. Analytica Chimica Acta 2016, 916, 17-23.
14. Vasko, J.; Samo B., H.; Božidar, O., Ex Situ Prepared Antimony Film Electrode for
Electrochemical Stripping Measurement of Heavy Metal Ions. Electroanalysis 2009, 21, (21), 2321-2324.
15. Marija, S.; B., H. S.; Lucie, B.; Eva, T.; Ivan, S.; Bozidar, O.; Karel, V., Antimony Film
Microelectrode for Anodic Stripping Measurement of Cadmium(II), Lead(II) and Copper(II). Electroanalysis 2010, 22, (14), 1617-1622.
16. Sebez, B.; Ogorevc, B.; Hocevar, S. B.; Veber, M., Functioning of antimony film electrode in acid media under cyclic and anodic stripping voltammetry conditions. Analytica Chimica Acta
2013, 785, 43-49.
17. Ashrafi, A. M.; Vytřas, K., New procedures for voltammetric determination of copper (II) using antimony film-coated carbon paste electrodes. Electrochimica Acta 2012, 73, 112-117. 18. Li, M.; Li, D.-W.; Xiu, G.; Long, Y.-T., Applications of screen-printed electrodes in current
environmental analysis. Current Opinion in Electrochemistry 2017, 3, (1), 137-143. 19. Rawlinson, S.; McLister, A.; Kanyong, P.; Davis, J., Rapid determination of salicylic acid at
screen printed electrodes. Microchemical Journal 2018, 137, 71-77.
20. Maczuga, M.; Economou, A.; Bobrowski, A.; Prodromidis, M. I., Novel screen-printed antimony and tin voltammetric sensors for anodic stripping detection of Pb(II) and Cd(II). Electrochimica Acta 2013, 114, 758-765.
21. Niu, X.; Zhao, H.; Lan, M., Disposable screen-printed antimony film electrode modified with carbon nanotubes/ionic liquid for electrochemical stripping measurement. Electrochimica Acta 2011, 56, (27), 9921-9925.
22. Chen, C.; Niu, X.; Chai, Y.; Zhao, H.; Lan, M.; Zhu, Y.; Wei, G., Determination of Lead(II) Using Screen-Printed Bismuth-Antimony Film Electrode. Electroanalysis 2013, 25, (6), 1446-1452. 23. Massart, D. L.; Vandeginste, B. G. M.; Buydens, L. M. C.; Jong, S. D.; Lewi, P. J.;
Smeyers-Verbeke, J., Handbook of Chemometrics and Qualimetrics: Part A. Elsevier: Amsterdam, 1997; p p. 112.
24. Wang, J.; Lu, J.; Hocevar, S. B.; Farias, P. A. M., Bismuth-Coated Carbon Electrodes for Anodic Stripping Voltammetry. Anal. Chem. 2000, 72, 3218-3222.
25. Maver, U.; Xhanari, K.; Zizek, M.; Korte, D.; Gradisnik, L.; Franko, M.; Finsgar, M., A
18 26. Mohan, T.; Findenig, G.; Hollbacher, S.; Cerny, C.; Ristic, T.; Kargl, R.; Spirk, S.; Maver, U.;
Stana-Kleinschek, K.; Ribitsch, V., Interaction and enrichment of protein on cationic polysaccharide surfaces. Colloids and surfaces. B, Biointerfaces 2014, 123, 533-41.
27. Horcas, I.; Fernandez, R.; Gomez-Rodriguez, J. M.; Colchero, J.; Gomez-Herrero, J.; Baro, A. M., WSXM: A software for scanning probe microscopy and a tool for nanotechnology. Rev Sci Instrum 2007, 78, (1), 013705.
28. Matjaz, F.; Klodian, X.; Helena Otmacic, C., Cyclic Voltammetry as an Electroanalytical Tool for Analysing the Reaction Mechanisms of Copper in Chloride Solution Containing Different Azole Compounds. Current Analytical Chemistry 2018, 14, 1-10.
29. Van Loco, J.; Elskens, M.; Croux, C.; Beernaert, H., Linearity of calibration curves: use and misuse of the correlation coefficient. Accreditation and Quality Assurance 2002, 7, (7), 281-285.
30. Laboratory and Scientific Section United Nations Office on Drugs and Crime, V., Guidance for the Validation of Analytical Methodology and Calibration of Equipment used for Testing of Illicit Drugs in Seized Materials and Biological Specimens, A commitment to quality nd continuous improvement. United Nations: New York, 2009.
31. Finšgar, M.; Kek Merl, D., 2-Mercaptobenzoxazole as a copper corrosion inhibitor in chloride solution: Electrochemistry, 3D-profilometry, and XPS surface analysis. Corrosion Science
2013, 80, 82-95.
32. Petovar, B.; Xhanari, K.; Finšgar, M., A detailed electrochemical impedance spectroscopy study of a bismuth-film glassy carbon electrode for trace metal analysis. Analytica Chimica Acta 2018, 1004, 10-21.
33. Shi, L.; Li, Y.; Rong, X.; Wang, Y.; Ding, S., Facile fabrication of a novel 3D graphene
framework/Bi nanoparticle film for ultrasensitive electrochemical assays of heavy metal ions. Analytica Chimica Acta 2017, 968, 21-29.