Optimization of a neutron dosimeter for the high energy accelerators
Alexey Sokolov1,,Georg Fehrenbacher1,Ekaterina Kozlova1,Torsten Radon1, andIzabella Zahradnik1
1GSI, Darmstadt (Germany)
Abstract.In high energy accelerator facilities the neutron radiation should be continuously measured during operation to control the ambient dose. This requires a reliable neutron dosimeter in a wide energy range. In this work we present an optimization of a compact cylindrical passive neutron dosimeter for the usage in wide energy neutron fields.
1 Introduction
For various high energy physics experiments, ions are ac-celerated to high energies and in collision with a target or losses in a beam line produce neutrons. These neutron fields are possibly harmful not only to the personnel be-hind the shielding, but also to electronics located in the vicinity of a radiation source. The energy range of neu-trons at accelerator complexes, such as the future Facility for Anti-proton and Ion Research (FAIR) [1] can vary from thermal up to GeVs. The position of the ion losses in the beam line are often unpredictable and time dependent thus an accumulative dose measurement of the ambient dose is preferred for monitoring over a wide area. This and neces-sity in a reliable measurements during a long period, for instance one year, can be provided with thermolumines-cence detector (TLD) based dosimeters [2, 3]. In the TLD cards the neutrons are detected via a6Li(n, α)3Hreaction
whose cross section increases for low energy neutrons. To perform neutron fluence to equivalent ambient dose con-version an appropriate combination of a neutron modera-tor and absorber layouts should be used. In this work we present the results of simulations and test measurements of a recently developed compact dosimeter layout [4] and continue to search for new materials and layouts for fur-ther improvements. The choice of materials and dimen-sions of different layers were tested with simulations using the FLUKA code [5], results were processed using FLAIR [6].
2 Dosimeter reading calculations
The TLD cards signal is proportional to the absorbed dose in the TL chips. In the simulations the energy absorbed in TL chips under irradiation in isotropic neutron fields was scored. The fields used are simple parallel neutron beams of certain energy and additionally a241AmBe source
spec-trum which was also used for calibration purposes. The
e-mail: [email protected]
TLD card of Harshaw type consists of two pairs of chips, ‘TLD-600’ based on6Li, sensitive to gamma and neutron
radiation and ‘TLD-700’ based on 7Li, sensitive to the gamma radiation. So the simulated relative reading or re-sponse of the dosimeter to a certain neutron energy was obtained as a sum of the absorbed dose in the TLD-600 crystals minus the dose in the TLD-700 crystals and di-vided by the same value for the neutrons of a241AmBe
source spectrum. The calculated relative reading is further compared to the fluence-to-dose values according to Pelli-cioni’s publication [7] normalized to 391 pSv·cm2, which
is a reference for241AmBe source provided by ISO
Stan-dard 8529-1 [8]. The closer are the relative readings to the mentioned values, the closer are the ambient dose readings of the dosimeter to the real equivalent dose H*(10).
FLUKA is also capable to predict an amount of pro-duced isotopes in reactions of neutrons with matter. Sev-eral simulations were performed to count the number of
3H andα-particles produced in TLD-600 chips during the
detection time and the relative dosimeter reading was ob-tained as:
RR =NE(3H, α)/NAmBe(3H, α) (1)
where NE(3H, α) is either the number of produced
tri-tium or helium nuclei for a certain neutron energy E and NAmBe(3H, α) is the number of those produced under
irra-diation with neutrons of a 241AmBe spectrum. Such an
approach provided the same response characteristics as in the first method, which takes into account the absorbed en-ergy. This shows that the neutron capture process releases the energy which contributes mostly to the absorbed dose in the TL chips even for fast neutrons.
The method calculating the amount of e.g. 3H –
par-ticles is very suitable to estimate the dose reading of ac-tive detectors, where the dose is calculated as a number of pulses. Each pulse corresponds to a neutron capture event. As a couple of tests we have also performed some simu-lations for active3He dosimeters where neutrons are
absorption energy for detection and as usually both meth-ods of isotope counting and energy deposition calculations gave the same response characteristics of the investigated dosimeter layouts.
The energy dependence of the capture cross sections for 3He and 6Li are pretty similar and our simulations showed that exchange of a TLD card with a3He propor-tional counter is possible. Exchanging the sensitive ele-ment of the dosimeter in studied layouts should provide close relative read-out. Of course the response character-istics are influenced by the size of the3He tube as well as
by the gas pressures of the counter. The active dosimeter prototypes are to be tested in the near future.
3 Compact cylindrical dosimeter
Figure 1. (left) Neutron dosimeter layout with a sensitive ele-ment – TLD card, PVC, lead and PE layers. Upper green squares in the TLD card depict 700 chips and lower blue ones TLD-600 chips. (right) Prototype 2 of the dosimeter and the 12” sphere [3] currently used at GSI for ambient dose measurements.
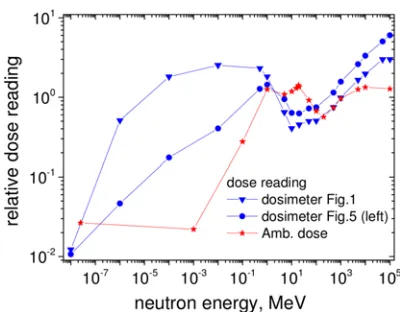
As it was shown by us previously [4, 9] compact sizes of broad energy range neutron dosimeters are possible, in-troducing a polyvinylchloride (PVC) layer, which serves for both absorption and moderation. This material also re-duces the production costs and makes the dosimeter design simple. In Fig. 1 (left) one can see a schematic layout of a cylinder dosimeter and a photo of a built prototype Fig. 1 (right). The dosimeter has an outer PVC layer, afterwards a lead layer used to increase the response for high energy neutrons [3]. In the middle are an additional moderating high density polyethylene (PE) layer and the TLD card, as a sensitive element. The developed design with height and diameter of only 14 cm and weight of 4.5 kilogram pro-vided a very good response of the dosimeter in high energy region (MeVs - GeVs) critical at high energy accelerators. Still the over-response in medium (eVs-keVs) energy re-gion leads to a dose overestimation. The relative dosime-ter reading calculated using FLUKA simulations can be found in Fig. 2. In further sections we describe a possibil-ity to improve the response in the eVs-keVs energy inter-val. This is necessary even if the measured neutrons are of higher energies, because the over- or underestimation in the low energy region can influence the calibration and lead to a incorrect dose reading.
The readings of the described compact dosimeter lay-out with the PVC layer were tested at the CERN-EU high-energy Reference Field (CERF) facility [10] and can be found in Table 1. CERF is the facility providing neutron fields in a wide energy range typically produced by cos-mic rays interacting with the atmosphere and by ions at
Figure 2.The relative dose readings for different dosimeter lay-outs from Fig. 1 and Fig. 5 and their comparison to the expected ambient dose. The values are normalized to the reading for the 241AmBe source neutrons.
Table 1.The ratios of the measured at CERF ambient dose equivalent to the reference value and to the expected from
FLUKA simulations with and without correction of the calibration to the scattered neutrons.
irradiation CERF FLUKA CERF FLUKA
direction corrected corrected
front 120% 100% 145% 121%
top 129% 109% 155% 131%
high energy accelerators. The first column ‘CERF’ are the ratios of the value measured with a dosimeter to the pro-vided reference ambient dose equivalent value [11]. The measured value applied a calibration done with a241AmBe source under an assumption of only direct neutrons from the source with average fluence-to-dose conversion equal to 391 pSv·cm2mentioned in calculation section. Two
val-ues of a column are for the irradiation perpendicular to the TLD card surface and for the irradiation from the top of the dosimeter, both indicating angular dependence of the dosimeter response. Also to be mentioned is that the val-ues in the table are the results averaged over several ex-perimental runs with only slight deviations of few percent between the runs. In the second column ‘FLUKA’ are the ratios between the measured value and the one obtained folding the provided neutron spectrum during irradiation at the CERF facility and the calculated dosimeter response from simulations. The reference equivalent ambient dose value is a result of folding between the given spectrum and Pellicioni’s fluence-to-dose coefficients. So the ‘CERF’ value shows the precision of the fluence-to-dose conver-sion of the dosimeter and the ‘FLUKA’ value shows the precision of the simulations. In the first approximation the dosimeter overestimated the H*(10) value only about 20 %. FLUKA simulations of the dosimeter response are de-fined to be 100 % precise for the frontal irradiation.
The calibration of the neutron dosimeters, typically done using241AmBe or252Cf sources, requires the
simulations should be used. If the scattered neutrons con-tribute significantly to the neutron spectrum and are not taken into account the calibration can be underestimated and can provide lower measured values.
Another pair of columns in Table 1 marked as ‘CERF corrected’ and ‘FLUKA corrected’ are the ratios men-tioned above, taking into account the experimentally veri-fied neutron scattering.
Figure 3. Simulated spectra of neutrons from the 241AmBe source at the calibration point, behind the ‘shadow cone’ and be-hind the ‘blackhole’ providing only scattered neutrons.
The neutron scattering for the calibration procedure was simulated using the FLUKA code. The 241AmBe
source was positioned in FLUKA geometry inside the room, 1.6 m above the floor, 2.5 m below the ceiling, 3 m away from concrete walls in one direction and 6 m in another direction. To separate the scattered neutrons from those coming directly from the source so called ‘black-hole’ material was inserted into the FLUKA geometry be-tween the source and the dosimeter. This FLUKA ‘ma-terial’ is introduced to stop the transport of particles and thus very suitable for our purposes. Instead of ‘black-hole’ in another simulation a paraffin wall was inserted with varying thickness. It was found that a 25 cm wall thickness is sufficient enough to stop the direct flux of neu-trons from the source so having almost the same effect as the ‘blackhole’. In Fig. 3 one can see the spectra for the described simulations. After folding the neutron spectra with and without the paraffin wall, or so called shadow cone, with Pellicioni’s values it was found that the contri-bution from the scattered part to the dose is almost 20% of the initially expected. To test the simulation results the GSI ball dosimeter [13], with approved close to ideal re-sponse characteristics, was used. The measured readings of the dosimeter with and without the wall also showed 17 % difference for the doses absorbed by the TLD cards and thus around 17 % difference for H*(10) value, confirming the simulation results.
Coming back to the Table 1, the 20 % contribution to the equivalent ambient dose from the scattered neutrons, taken into account for calibration, changes the dosime-ter reading. The ambient dose measured at CERF for the frontal irradiation is increased from 120 % to 145 %. Still
the 45 % overestimation of the dose for the compact cylin-drical dosimeter is a rather good agreement, which hap-pens due to the good fluence-to-dose response in the re-gion of interest for the accelerator complexes, i.e. thermal and from MeVs to few GeVs intervals [4]. Still the over-estimation can be reduced if the response of the dosimeter will be improved in eVs-keVs energy region. The overes-timation also occurs for the comparison between FLUKA simulations and measurements, if the scattered neutrons are taken into account. Thus our simulation instead of al-most perfect fit shows a 20 % overestimation for the cal-culated dose values, which is also quite acceptable and ap-proves our simulation approach. As it is also clear from
Figure 4.The relative dose readings of the compact 14 cm large dosimeter layout for irradiations from aside and from top for var-ious configurations of TL chips in TLD card.
the table the response of the dosimeter is almost the same for irradiation from aside and from the top, despite the lack of the top and bottom caps of the lead cylinder. Thus the dosimeter read-out is quite angular independent though having only a cylindrical shape and rather small dimen-sions. The only requirement is set to the location of the chips in the card, they should be vertically the same in configuration A and not B as depicted in Fig. 4 with the responses for different irradiation directions and different TL chips configurations. For any irradiation perpendicu-lar to the symmetry axis the readings are almost identi-cal to the front irradiation and are independent on chips configuration. For the irradiation from top for the con-figuration B the material thickness pathed by neutron to-wards the TLD-600 chips is bigger and response of the dosimeter in low energy region decreases as it will be dis-cussed below. In our measurements the configuration A was used and though the response for the irradiation from top is close to frontal irradiation (see Fig. 4) the simula-tions show bigger deviation from the measurements as can be seen in Table 1.
4 Modification of the Andersson-Braun
dosimeter
low energy region. A solution could be a separation of the outer layer into 2 as in the modified Andersson-Braun type [14]. In Fig. 5 (left) one can see a schematic layout of a cylinder dosimeter, which has an outer 16 cm in diameter and 16 cm in height moderating high density polyethy-lene layer, afterwards a 10% borated PE or rubber to in-crease the absorption, then a lead layer and again a PE layer used to increase the response in the high energy re-gion. In the middle of the dosimeter a TLD card is used
Figure 5. The modified Andersson-Braun dosimeter (left) and its further modification with concentric openings in the borated PE layer, side view relative to the TLD card (right).
as a sensitive element. Detailed description of the dimen-sions for the mentioned geometry and materials composi-tion and densities can be found in [4]. The relative reading of the dosimeter can be found in Fig. 2 in comparison to the dosimeter from Fig. 1. The improved dose reading is clearly seen.
Figure 6. Dose readings of the dosimeter with varying borated polyethylene layer composition.
In Fig. 6 one can see the response of the dosimeter if the borated PE layer is modified. Using just a PE without any absorptive admixtures increases the response of the dosimeter at low and medium neutron energies, while an addition of 10 % boron to the layer drastically improves the response. Further increase of the boron doping in-creases the underestimation of the dose at lower energies and for 40% of the mass the response at thermal energy is more than two orders of magnitude less than required. Fol-lowing an idea in [15] to increase the response for low en-ergy neutrons holes can be drilled in the dosimeter to pro-vide more transparent flow of neutrons towards the TLD cards. Modifying the dosimeter with 40% doped PE layer as depicted in Fig. 5 (right), introducing concentric
open-ings has the same influence as a decrease of the boron ad-mixture.
5 Modification of the compact dosimeter
Another solution to improve the response of the compact dosimeter with a PVC layer could be changing the outer diameter of the dosimeter. For different neutron energies the relative ambient dose readings of the dosimeters with varying PVC layers can be seen in Fig. 7. For consistency in the figure the neutron energies are limited to 10 MeV, the red curve represents the expected values according to [7]. Decrease of the dimension leads to the reduced ab-sorption and moderation, which makes it unfavourable to decrease further the size of the dosimeter. Still in high en-ergy region the readings of more compact layouts are close to the one from Fig. 2 and thus even smaller dosimeters can be used for detection in the energy region above 1 MeV. The neutron spectra typically have a peak in the
vicin-Figure 7.Readings of the dosimeter in low and medium energy region for different diameters of the PVC layer from 10 cm to 20 cm.
ity of thermal energies requiring an appropriate reading around 25 meV. A diameter of 14 cm of the current com-pact PVC cylinder is optimal for such energies. Increase of the dosimeter dimension bends the response curve in such a way that the dose reading is underestimated around 25 meV and for eVs-keVs region it is better due to more effi -cient moderation. For the dosimeter with the diameter and height of 20 cm the reading in the thermal region is almost two orders of magnitude smaller due to strong absorption and thus not acceptable, though in eVs-keVs region the reading is drastically improved in comparison to the 14 cm layout. Following our investigations with the dosimeter layout from Fig. 5 the openings were cut through the PVC layer. In Fig. 8 the simulated relative readings are shown when additional openings 1 mm and 0.5 mm in width are introduced in PVC layer, as depicted in the insertion of the figure. Such dosimeters would have very angular depen-dent response and are not usable in practice.
Figure 8.Responses of dosimeters having 20 cm diameter with and without openings and comparison to the required ambient dose values. Insertion shows the layout with 1 mm wide open-ings.
optimal configuration providing nearly angular indepen-dent reading is achieved for a dosimeter layout shown on Fig. 9. The initial 6.7 cm in diameter (d) and 7.1 cm in
Figure 9. Neutron dosimeter in 3D view (obtained using Flair [6]) with openings in PVC layer. Material colours correspond to those in Fig. 1.
height (h) lead cylinder containing high density polyethy-lene cylinder (d=4.7 cm and h=7.1 cm) is located in futur-istic structure of PVC layer cut to a depth of 5.5 cm from the side and to 5 cm from the top and bottom with open-ings, each 2 mm in width. The openings release some of material making the dosimeter up to 0.5 kg lighter. The inner PVC part and openings can be varied in such a way that increase of the openings width or their amount can be compensated with the increase of the non-cut PVC region.
6 Summary and conclusion
The final neutron dosimeter layout shown in Fig. 9 im-proves the fluence-to-ambient dose conversion and pro-vides almost angular independent equivalent dose read-ing. In Fig. 10 one can find the simulated reading of the dosimeter in wide energy range, green curve with
square symbols. Folding the response of the dosime-ter from Fig. 9 with the CERF spectrum should provide almost 100 % fit with the expected equivalent ambient dose value. Taking into account our comparison between FLUKA simulations and measurements would most prob-ably lead to a dose overestimation of around 20 %. The
Figure 10. Readings for the dosimeters: (green curve) layout from Fig. 9; (brown curve) the same layout with PE instead of lead; (blue curve) layout from Fig. 1; (black curve) example of a dosimeter with d=h=30 cm; (red curve) expected ambient dose equivalent.
dosimeter can be further increased in dimensions and pro-vided with the openings will have even more improved reading, example of such dosimeter response can be also found in Fig. 10, black curve for a 30 cm diameter dosime-ter, though such a dosimeter is already quite bulky, heavy and complicated for production. Additionally a reading for the dosimeter with the same layout as in Fig. 9, but with a polyethylene instead of lead, is also depicted in Fig. 10 and provides even better response for low and medium en-ergies.
The final design from Fig. 9 consumes an appropri-ate response from the initial design in high energy neu-tron fields and improves it for medium energies. Thus the dosimeter response is covering almost 12 orders of mag-nitude of neutron energies and is rather sufficient for the usage at high energy accelerators.
References
[1] https://www.gsi.de ; https://www.fair-center.de. [2] M. Awschalom and R. S. Sanna, Applications of
Bon-ner sphere detectors in neutron field dosimetry, Radia-tion ProtecRadia-tion Dosimetry,Vol.10No. 1-4 pp. 89-101 (1985).
GSI ball at high-energy accelerators, Radiation Protec-tion Dosimetry (2007), Advance Access publicaProtec-tion 16 September 2007,Vol. 125, No. 1-4, pp. 209-212. [4] A. Sokolov, G. Fehrenbacher, T. Radon , Design
Development of a passive neutron dosemeter for the use at high-energy accelerators, Radiation Protection Dosimetry 2015; doi: 10.1093/rpd/ncv489
[5] A. Fasso‘, A. Ferrari, J. Ranft and P. R Sala, FLUKA: a multi-particle transport code, CERN-2005-10 (2005), INFN/TC 05/11, SLAC-R-773.
[6] V. Vlachoudis, FLAIR: A Powerful But User Friendly Graphical Interface For FLUKA Journal Name, Saratoga Springs, New York, 2009.
[7] M. Pelliccioni, Radiation Protection Dosimetry, Nu-clear Technology Publishing, 88, 279-297 (2000). [8] ISO, International Standardization Organization,
Neu-tron Reference Radiations for Calibrating NeuNeu-tron Measurement Devices Used for Radiation Protection-Purposes. ISO 8529, 1st Edition, 1989.
[9] I.A. Zahradnik, Development of the passive neutron dosimeter, ANDREA, for high energy accelerators, ver-ification measurements and simulation of the dose re-sponse using the Monte Carlo code , bachelor thesis,
THM Giessen, 2015.
[10] A. Mitaroff and M. Silari, The CERN-EU high-energy Reference Field (CERF) facility for dosimetry at commercial flight altitudes and in space, Radiation Protection Dosimetry 102, 7-22, 2002.
[11] http://cerf-dev.web.cern.ch/content/ fluka-reference-values.
[12] H. Kluge, A.V. Alevra, S. Jetzke, K. Knauf, M.Matzke, K. Weise and J. Wittstock, Scattered neu-tron reference fields produced by radionuclide sources, Radiation Protection Dosimetery, Nuclear Technology Publishing, 70, Nos. 1-4, pp. 327-330 (1997).
[13] F. Gutermuth, T. Radon, G. Fehrenbacher and J.G. Festag, The response of various neutron dosemeters considering the application at a high energy particle ac-celerator. Kerntechnik 68, 172–179 (2003).
[14] V. Mares, A.V. Sannikov and H. Schraube, Response functions of the Andersson–Braun and extended range rem counters for neutron energies from thermal to 10 GeV, Nuclear Instruments and Methods in Physics , Vol. 476, Issues 1–2, 1 Jan 2002, p. 341–346.