Los Alamos National Laboratory, XCP-5, MS F663, Los Alamos, NM, USA
Abstract. Intense impulses applied to solid materials result in high strain rates, strong plastic strains and significant temperature increments. Data in such regimes would allow confidence in extending material strength models to strain rates of 106–107s−1. High
ex-plosives can be used to accelerate a plate with a perturbation on the side facing the HE, resulting in a Rayleigh-Taylor-like perturbation growth that depends on amplitude and wavelength of the initial surface perturbation, strength of the material, time dependence of the driving pressure force, and temperature of the material. Such experiments have been conducted on perturbed copper plates at LANL, using the LANSCE proton radiography beam to obtain multiple frames of data for each experiment. The results of numerical simulations of these experiments using a 2-D ALE code are presented.
1 The experiment
In its most basic form, the experiment consists of a planar high explosive (HE) lens and a copper (or other material) plate. Sinusoidal perturbations of a given wavelength and amplitude are machined into the “front” side of the plate (see Fig. 1), which faces the HE lens. A gap exists between the HE and the plate, allowing the expanding HE products to fill the gap and provide a shockless driving force on the plate. In addition, the edge of the plate is beveled to allow the plate to remain flat as the HE products expand around the outer edge of the plate. A typical wavelength for the perturbation is 2 mm; a typical peak-to-peak amplitude of the perturbation is 0.07–0.11 mm; a typical gap is 2–3 mm. The perturbations undergo a Rayleigh-Taylor-like growth that depends on amplitude and wavelength of the initial surface perturbation, thickness of the plate, strength of the material, time dependence of the driving pressure force, and temperature of the material.
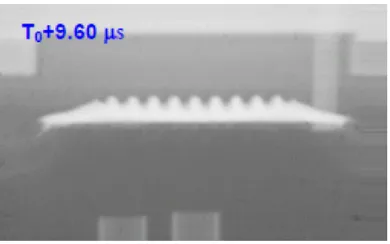
The LANSCE proton radiography beam is used to obtain multiple frames of data for each exper-iment. One such frame is shown in Fig. 2. The edge of the perturbation is then extracted from the radiograph and the data is typically presented as peak-to-peak amplitude as a function of either time or distance of plate movement. In addition, photon Doppler velocimetry (PDV) is used to provide a record of the velocity of the “back”, initially unperturbed side of the plate.
These experiments follow in the footsteps of Barnes at LANL [1] and Raevsky at VNIIEF [2].
2 Full simulation
The largest issue for 2-D simulations of this experiment is the lack of a consistent 2-D symmetry. While the HE lens is obviously axisymmetric, the plate is a combination of an initially axisymmetric plate with a superimposed Cartesian perturbation. The best way to model the sinusoidal perturbations is to use a Cartesian description of the plate, using a mesh as shown in Fig. 3. Only one side of the plate is modeled, with a reflective boundary at the plate center.
Use of a Cartesian geometry for the plate negates the use of an axisymmetric model for the HE lens. Thus, the HE lens is modeled by a planar equivalent of slabs of HE, ignited by a planar wave. The slabs match the center line of the lens in thickness.
Fig. 2. Proton radiography image of dynamic plate.
Fig. 3. Typical Lagrangain mesh for perturbed plate.
Fig. 4. “Full” simulation, initial time on left, final time on right.
Fig. 5. Enlargement of simulated final time.
Fig. 6. Plastic enclosure on right replaced with reflective boundary on left.
3 Mesh refinement
The mesh shown in the previous figures is extremely coarse, with only six cells across the plate thick-ness. As might be expected, the resulting simulations smear out the anticipated localizations of material properties and predict virtually no growth in perturbation amplitude. Mesh refinement is required to make more accurate predictions in this situation, so a simpler model with fewer cells needing fewer processors and shorter run times is needed.
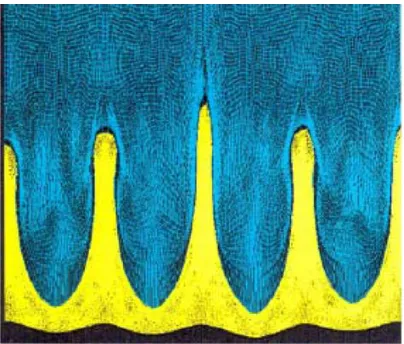
Using the previously mentioned observation that the plate edge effects did not propagate into the center section of the plate, the chosen simpler model consists of only the center section of the plate, with reflective boundaries placed on both sides of four wavelengths of the plate. Effectively this represents an infinite plate and lens configuration. The final time for three simulations with mesh sizes of 0.1, 0.05 and 0.025 mm, respectively, are shown in Figs. 7–9. The plate is shown in either yellow or red, while the HE products are shown in either aqua or blue. It can be seen that with increasing mesh refinement, the expected bubbles on the spikes begin to appear. It should be noted that this is only the beginning of convergence in the simulations.
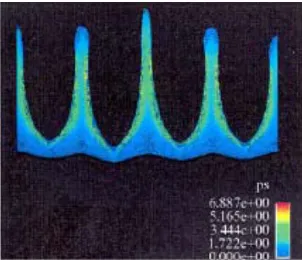
The change in shape appears to be due to the increasing localization of plastic strain possible with a finer mesh. The final plastic strain calculated for the 0.025 mm mesh is seen in Fig. 10. The maximum cellular plastic strain in this simulation is almost 700 percent, while the maximum cellular plastic strain in the 0.1 mm mesh is approximately 280 percent.
Fig. 7. Final simulation time for 0.1 mm mesh.
Fig. 8. Final simulation time for 0.05 mm mesh.
Fig. 10. Final plastic strain in 0.025 mm mesh.
Fig. 11. Plate velocity as a function of time, simulated vs. data.
Fig. 12. Peak-to-peak perturbation amplitude as a function of time, simulated vs. data.
rate of perturbation growth for all three cell sizes. It could be argued that one needs to use the 0.025 mm size to adequately capture the shape of the perturbation growth.
4 Gaussian plate
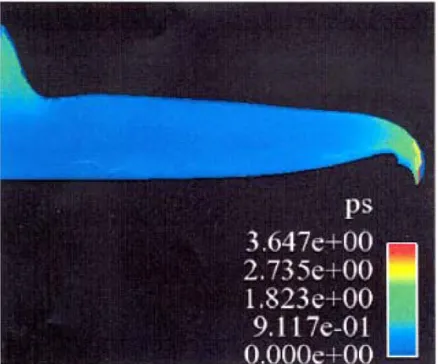
In order to address the lack of symmetries in the previous experiment, a different plate shape has been attempted. This plate has a single Gaussian point in the center of the side facing the HE lens, as shown in Fig. 13. There is no bevel on the edge of the plate. The same lens is used as in the previous exper-iment. Again, a gap exists between the HE and the plate so that the HE products provide a shockless loading to the plate.
Fig. 14. Simulation of plastic strain in Gaussian point plate.
Fig. 15. Pressure vs. time for Gaussian plate perturbed surface.
into the radiographic line of sight, obscuring the growth of the center perturbation. The expansion of the HE products into the gap between the plate and the reflective boundary (the plastic enclosure in the experiment) produces a variation in pressure as function of time across the perturbed surface, as can be seen in Fig. 15.
Fig. 16. Simulated plastic strain in revised Gaussian plate.
5 Conclusions
Data on solid material response to the application of high strain rates, strong plastic strains and signifi-cant temperature increments allows confidence in extending material strength models to these regimes. In order to develop such data, the LANSCE proton radiography beam was used to radiograph high ex-plosives driven perturbed plates. The numerical simulations of these experiments using a 2-D ALE code presented in this paper show that the Preston-Tonks-Wallace strength model for annealed copper is adequate to capture the experimental behavior, given enough refinement in mesh size. Several sim-plifications to the model reduced the complexity of the simulation, while still allowing for accurate prediction of the experimental results.
To allow the simulations to more easily capture the HE lens behavior, an axisymmetric Gaussian plate is currently being developed for use in future experiments. The developed simulation capability is being used to help refine the new plate shape. Additionally, simulations of experimental variations such as the plate material and gap width are now possible.