City, University of London Institutional Repository
Citation:
Blake, D. (2018). Longevity: A New Asset Class. Journal of Asset Management, doi: 10.1057/s41260-018-0084-9This is the accepted version of the paper.
This version of the publication may differ from the final published
version.
Permanent repository link:
http://openaccess.city.ac.uk/19924/Link to published version:
http://dx.doi.org/10.1057/s41260-018-0084-9Copyright and reuse: City Research Online aims to make research
outputs of City, University of London available to a wider audience.
Copyright and Moral Rights remain with the author(s) and/or copyright
holders. URLs from City Research Online may be freely distributed and
linked to.
City Research Online: http://openaccess.city.ac.uk/ [email protected]
Longevity: A New Asset Class
Professor David Blake Pensions Institute Cass Business School
[email protected] June 2018
Abstract
A little over a decade ago, a new asset class emerged, one linked to longevity risk, i.e., unanticipated changes in life expectancy. The Life Market has two segments: a macro segment with assets linked to groups of lives, such as members of a pension plan or a book of annuitants; and a micro segment with assets linked to individual lives, such as life settlements. For the market to become global certain market requirements need to be satisfied, such as understanding the causal factors underlying longevity and the development of market indices and mortality forecasting models. The government has a role in contributing to the development of the market, as do pricing models. By addressing these issues, as well as understanding the needs of investors better, the asset class can become global, by attracting new groups of investors seeking returns that are uncorrelated with existing financial instruments.
TABLE OF CONTENTS
1. Introduction ... 1
2. Longevity risk: The key risk to quantify ... 1
3. The birth of a new capital market: The Life Market ... 5
3.1 What are the conditions for a new capital market succeed? ... 5
3.2 Quantifying the potential size of the longevity risk transfer market ... 5
3.3 The structure of the longevity market ... 5
4. Market requirements ... 6
4.1 Causal factors underlying longevity ... 7
4.2 Mortality indices and mortality forecasting models ... 10
4.2.1 Mortality indices ... 10
4.2.2 Mortality forecasting models ... 10
5. The macro-longevity risk market ... 13
5.1 Bonds ... 13
5.2 Derivatives ... 14
5.2.1 Mortality forwards ... 14
5.2.2 Longevity (or survivor) swaps ... 15
5.2.3 Longevity bull call spreads (or tail-risk protection) ... 16
5.3 Total size of the macro-longevity market ... 20
6. The micro-longevity risk market ... 20
7. A role for government? ... 24
8. Pricing ... 25
9. Investor engagement ... 27
9.1 Investor segmentation ... 28
9.2 Expanding the asset class ... 30
9.3 A new vehicle – reinsurance sidecars ... 32
9.4 Longevity assets in a diversified portfolio ... 33
10. Conclusion ... 33
1.INTRODUCTION
A new global capital market, known as the Life Market, is developing, one which trades longevity-linked assets and liabilities that are related to changes in human life expectancy (LE). One of the main attractions of longevity-linked assets is that they are to a first-order uncorrelated with financial assets, such as equities and bonds. This makes them an attractive asset to hold in a diversified portfolio. Nevertheless, the risk is unusual in terms of financial assets, since it is a ‘trend’ risk – a risk that increases with time. Most financial risks do not trend, but instead are ‘cyclical’ – such as the equity premium, the credit premium, the liquidity premium, and the real risk-free interest rate. The price level is one of the few trend risks in finance – as a consequence of persistent positive inflation.
There have been previous historical examples of longevity-linked assets being traded. For example, Tontine bonds were issued by European governments in 17th and 18th Centuries and a secondary market in life insurance policies began in mid-19th Century when Foster & Cranfield auctioned an endowment life insurance policy in UK in 1844. However, the new market – which began in the UK in 2006 – has the potential to become global.
2.LONGEVITY RISK:THE KEY RISK TO QUANTIFY
The market started because a new risk emerged, namely longevity risk.1 Previously actuaries had assumed that human life expectancy was fairly predictable. But from the 1990s, actuaries, first in the UK and then elsewhere, noticed that they had been systematically underestimating how long people are going to live. Instead, they came to realize that longevity is a trend risk.
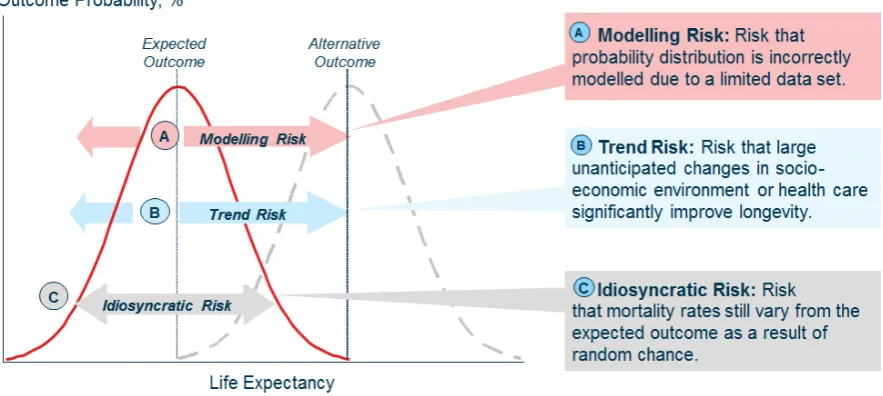
As a consequence of this, there is the danger of individuals outliving their savings. Pension plans must provide retirement income security for however long people live and corporate pension plan sponsors face the risk of having to divert resources away from dividend and investment programmes to fill plan deficits. Similarly, life offices selling life annuities face the risk of inadequately reserving. It is possible to decompose longevity risk into two components as follows:
Total longevity risk = Systematic longevity risk [Trend risk]
+ Specific longevity risk [Idiosyncratic and modelling risks].
Specific longevity risk is itself the sum of idiosyncratic risk (different individuals from the same population of interest have different lengths of lifetime) and modelling risk (different models will project different lifetimes for these individuals) – see Figure 1. But these risks get diversified in sufficiently large populations of interest.
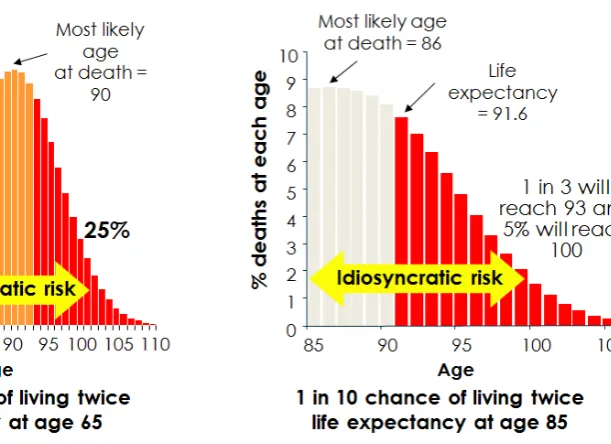
But systematic longevity risk is a slowly developing trend risk and getting the trend right is key to the successful management of this risk. Figure 2 shows that, for almost two centuries, life expectancy has been increasing in advanced economies by 2.5 years per decade. Figure 3 shows the variability for UK males aged 65 and 85.
Turning to the future, will longevity continue to improve? There are alternative expert views. On the one hand, there are the ‘pessimists’ led by Jay Olshansky (see, e.g., Olshansky et al (2001), Carnes et al (2003), and Olshansky et al (2005)) who suggest that life expectancy might level off or decline due to the impact of obesity, global warming etc. On the other hand, there are the ‘optimists’ led by Jim
Vaupel (see, e.g., Oeppen and Vaupel (2002))who argue there is no natural upper limit to human life, pointing to future scientific and medical advances, such as regenerative medicine.
Figure 1: Longevity risk is driven by three underlying risks
[image:5.595.75.512.423.696.2]Source: Prudential
Figure 2: Life expectancy in developed countries since 1840
Figure 3: Variability in life expectancy
Source: PNMA00 medium cohort
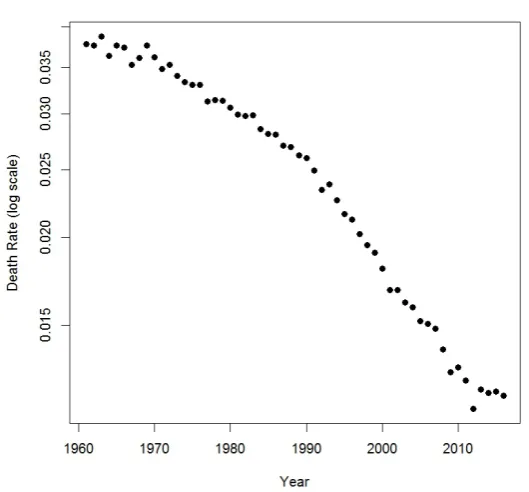
Official projections have underestimated recent improvements in life expectancy – see Figure 4. Figure 5 shows that mortality is a stochastic process. Mortality rates in the UK have been declining since the 1970s, but the declines have been volatile. Mortality modelling needs to account for this. There are a range of stakeholders who bear longevity risk: individuals; company pension funds; annuity providers, principally insurance companies; the government through public pension systems; and investors in longevity-linked products.
Those bearing longevity risk face a range of responses. They can accept longevity risk as legitimate business risk, although this only makes sense if they earn a suitable longevity risk premium. They can share longevity risk, e.g., through participating annuities with survival credits, conditional indexation, and caps. They can use reinsurance to lay-off or hedge the risks: key examples are buy-outs and buy-ins.2 Finally, they can manage the risk with longevity-linked products or securitize the risk. These last two options constitute the Life Market.
2 With a buy-out, an insurance company buys out the liabilities of a pension plan which is paid for with the
Figure 4: Poor accuracy of official projections - Actual and projected period life expectancy at birth, UK males, 1966-2031
Source: Shaw (2007, Figure 5)
Figure 5: Mortality is now recognized as being a stochastic process
[image:7.595.158.423.477.723.2]3.THE BIRTH OF A NEW CAPITAL MARKET:THE LIFE MARKET
3.1 What are the conditions for a new capital market succeed?
There are five conditions for a new capital market to succeed:
• It must provide an effective exposure, or hedging, to a state of the world that is
• economically important
• and cannot be hedged through existing market instruments.
• It must use a homogeneous and transparent contract to permit exchange between agents
• in a way that provides an attractive investment exposure.
Loeys et al (2007) argue that ‘longevity meets the basic conditions for a successful market innovation’. In fact, two Life Markets are developing: a macro-longevity market, dealing with corporate pension plan liabilities and annuity books; and a micro-longevity market, dealing with individual life insurance policies (or life settlements). Both markets will be built around indices. A reference population underlying the calculation of a mortality index is central to both the viability and liquidity of contracts.
3.2 Quantifying the potential size of the longevity risk transfer market
The potential size of the global longevity risk market for (state and private sector) pension liabilities is estimated at between $60trn and $80trn.3 The main countries with private corporate sector pension liabilities are: US ($14.460trn), UK ($2.685trn), Australia ($1.639trn), Canada ($1.298trn), Holland ($1.282trn), Japan ($1.221trn) and Switzerland ($0.788trn).
However, only the UK, US, Canada and Holland currently have the conditions for a longevity risk transfer market to develop. These conditions are: low interest rates which, by increasing the present value of more distant pension payments, has exposed the real extent of longevity risk in pension plans; inflation uplifting of pensions in payment (especially in the UK and Holland); constant updating by the actuarial profession of longevity projections; the introduction of market-consistent valuation methods; increased accounting transparency of pension assets and liabilities; and increased intervention powers by the pensions regulator.
3.3 The structure of the longevity market
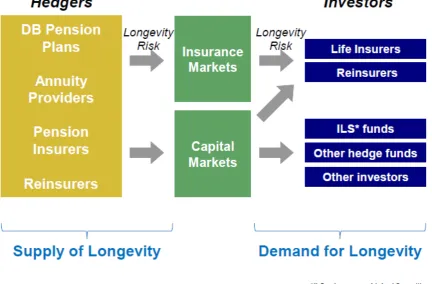
Figure 6 shows the structure of the longevity market. The supply of longevity comes from longevity ‘hedgers’, entities that hold longevity risk and want to offload it (known as ‘cedants’ in the reinsurance industry). Examples include a defined benefit (DB) pension plan and an annuity provider that are looking to transfer/reinsure their longevity risk. Both institutions will consider buying longevity protection, including a hedge related to a reference population, such as the national population. However, if the reference population is very different from hedger’s specific population, then the hedger will be exposed to significant ‘basis risk’,4 and might conclude that longevity hedging is ineffective.
3 Michaelson and Mulholland (2015).
Figure 6: Supply and demand in the longevity market
Source: Coughlan (2011)
The demand for longevity comes from longevity ‘investors’, entities that take longevity risk and receive a risk premium for it. There are a number of potential types of investor. First, there are the life insurers and reinsurers via the insurance markets. Such organisations are willing to sell longevity protection as part of their business model, e.g., by writing annuities. Second, there are medium- and long-term investors, via the capital markets. These include insurance-linked securities (ILS) investors, other hedge funds, and other (longer term) investors, such as sovereign wealth funds, endowments and family offices – all seeking assets that have low correlation with existing financial instruments. Next there are other institutions naturally long longevity, such as pharmaceutical companies and long-term care homes, that might in due course consider selling longevity protection. Then there are pension plans that have not hedged their longevity risk: they are also (possibly reluctant) investors. Finally, there are short-term investors or speculators which might become interested in the market if there is sufficient liquidity.
4.MARKET REQUIREMENTS
4.1 Causal factors underlying longevity
There are five key causal factors underlying longevity differences:
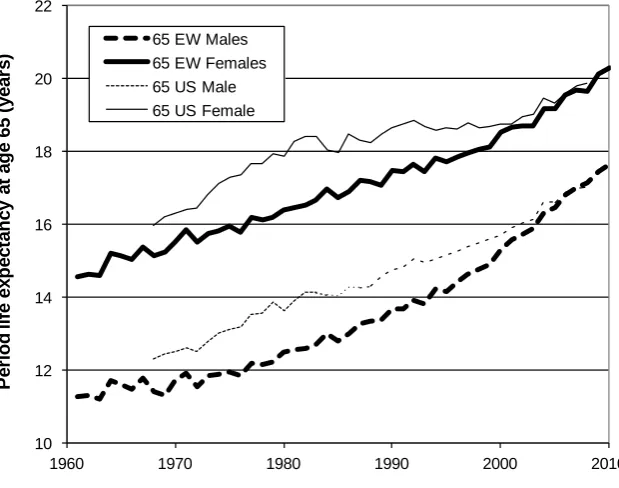
• Gender: female life expectancy is higher than that of males, but the difference is narrowing, as Figure 7 shows for both England & Wales and for the US.
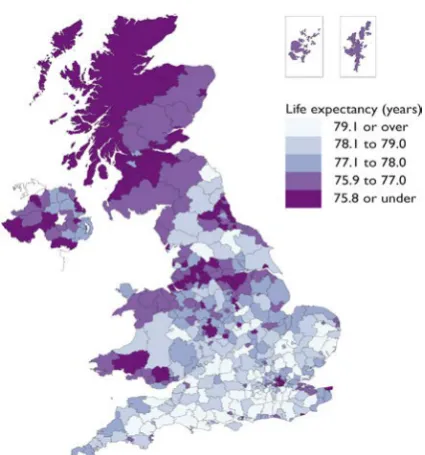
• Geographical location: there are significant differences in life expectancy depending on geographical location, even down to the level of post code as Figure 8 shows.
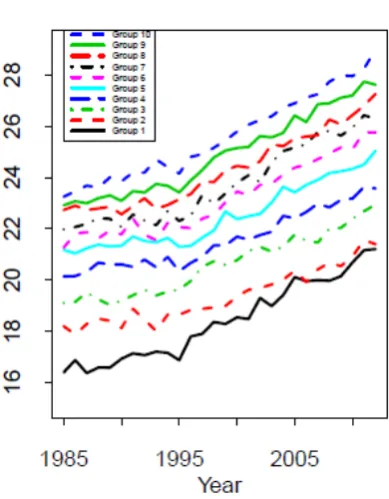
• Social class: Figure 9 shows that life expectancy is positively related to social class and that the difference is widening in England & Wales.
• Income/wealth. Life expectancy is positively related to income and wealth as Figure 10 shows for Danish males aged 65.
[image:10.595.138.448.441.685.2]• Year of birth (cohort): In some countries there is evidence of a cohort effect (see, e.g., Willets (2004)). Life expectancy is linked to year of birth: some birth cohorts have higher life expectancy than the birth cohorts on either side for reasons that are not fully understood. Figure 11 shows the so-called UK male 1930 golden cohort which has exhibited higher annual improvements in mortality rates than adjacent birth cohorts. Possible explanations include good diets between 1939-1945 and the introduction of the National Health Service in 1948.
Figure 7: Life expectancy at age 65 in England & Wales and the US, 1960-2010
10 12 14 16 18 20 22
1960 1970 1980 1990 2000 2010
65 EW Males 65 EW Females 65 US Male 65 US Female
P er io d l if e exp ect an cy at ag
e 65 (
year
s)
Figure 8: Male life expectancy at birth in different parts of the UK
Source: Office for National Statistics
Figure 9: Differences in life expectancy due to social class
Source: Longitudinal Study, Office for National Statistics Life expectancy for men at 65 by Social Class, England and Wales
Years
11 12 13 14 15 16 17 18 19
1972-76 1977-81 1982-86 1987-91 1992-96 1997-01 2002-05
[image:11.595.78.428.538.735.2]Figure 10: Differences in life expectancy due to income/wealth in Denmark
Source: Cairns et al (2017)
Figure 11: Differences in life expectancy due to year of birth with the UK male 1930 golden cohort shown
[image:12.595.110.356.497.727.2]4.2 Mortality indices and mortality forecasting models
4.2.1 Mortality indices
As has been shown in other markets, such as the equity and bond markets, trading is built around market indices. In the context of the Life Market, mortality indices will depend on the availability of timely high-quality mortality data.
Credit Suisse introduced a Longevity Index in 2005, but it lacked transparency and no transactions were executed using it. In 2007, the LifeMetrics Indices were introduced by J.P. Morgan, Towers Watson and the Pensions Institute. They covered the UK, the US, Holland and Germany and were fully transparent and objective. The indices were transferred to the Life & Longevity Markets Association (LLMA)5 in 2011. Deutsche Börse introduced monthly Xpect-Indices on mortality and life expectancy.
Indices were also introduced in the life settlements market. For example, Goldman Sachs started the QxX Life Settlements Index in 2007, but there was insufficient trading and it was discontinued. In 2010, the Fasano Longevity Life Settlements Index was launched.
4.2.2 Mortality forecasting models
It is essential to get unbiased estimates of future life expectancies. This requires good mortality forecasting models. These are divided into three different classes.
The first is ‘process-based’ models which model either the causes of death or the processes underlying mortality improvements. These models use research from demography, medical science, and healthcare economics to: improve understanding of the drivers of historical mortality change; and build models to predict how social change and medical improvements will influence future changes.
With cause-of-death models, the total mortality rate is decomposed amongst a number of diseases. Models are fit and projected stochastically for each underlying cause. Causes are then re-aggregated to give a forecast for total mortality or life expectancy. These models are highly subjective. A large number of competing processes need to be calibrated from sparse data and decisions on the likely path of medical progress need to be made.
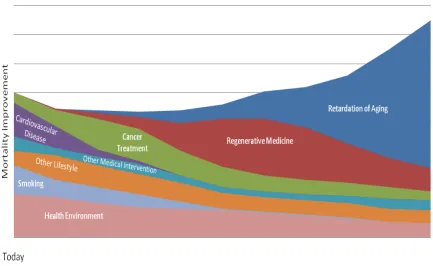
An example of the second type of model in this class is the Risk Management Solutions (RMS) Longevity Risk Model. This uses ‘vitagion categories’ or individual sources of mortality improvement: changing lifestyle trends, such as reduced smoking prevalence; improvements in the general health environment; progress in medical intervention; regenerative medicine, such as stem cell research, gene therapy and nanomedicine; and retardation of ageing, including telomere shortening and caloric restriction. Figure 12 shows a stylized representation of the impact of successful interventions in each of these ‘vitagion categories’.
Figure 12: Timeline into the future
Source: RMS (2010) ‘Longevity Risk’
The second is ‘explanatory’ and ‘causal’ models which model death using exogenous explanatory variables, such as macro-economic variables or socio-economic indicators. Mortality rates for different causes are regressed on different macro-economic variables such as GDP growth, inflation and unemployment. GDP growth is directionally correlated with mortality improvements. Allowing for macro health indicators (smoking history) can account for most of the mortality differences between men and women. Post code is used as an indicator of social class.
The third is ‘extrapolative’ projection models. These are purely data-driven, and will only be reliable if past trends continue. Clearly, medical advances can invalidate extrapolative projections by changing the trend.
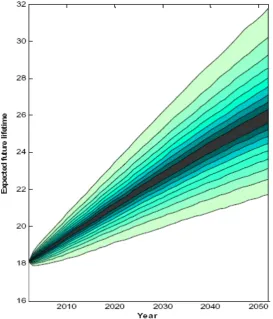
The main extrapolative models are the Lee-Carter model (which assumes no smoothness across ages or years), the P-spline model (which assumes smoothness across years and ages) and the Cairns-Blake-Dowd (CBD) model (which assumes smoothness across ages in same year).6 Figure 13 shows a longevity fan chart7 for 65-year old UK males. UK male life expectancy at age 65 is expected to be 26 years in 2050, within a possible range of 21 to 32 years. Figure 14 presents a survivor fan chart8 for 65-year old UK males. The figure shows that there is little longevity risk up to age 75: we can be fairly confident that around 18% of 65-year olds will have died before 75. Longevity risk reaches a peak at age 90, and then there is a long tail out to age 115.
Figure 13: Longevity fan chart for 65-year old UK males (CBD model)
[image:15.595.79.497.476.714.2]5.THE MACRO-LONGEVITY RISK MARKET
The key macro-longevity assets are longevity-linked bonds and derivatives, principally forwards, swaps and options. Since the instruments are not publicly traded, it is hard to get reliable information on investor returns, but industry insiders suggest returns in the range 12-18% for investments in swap format and 5-8% for investments in bond format. Recently, a new vehicle – the reinsurance sidecar – has been introduced.
5.1 Bonds
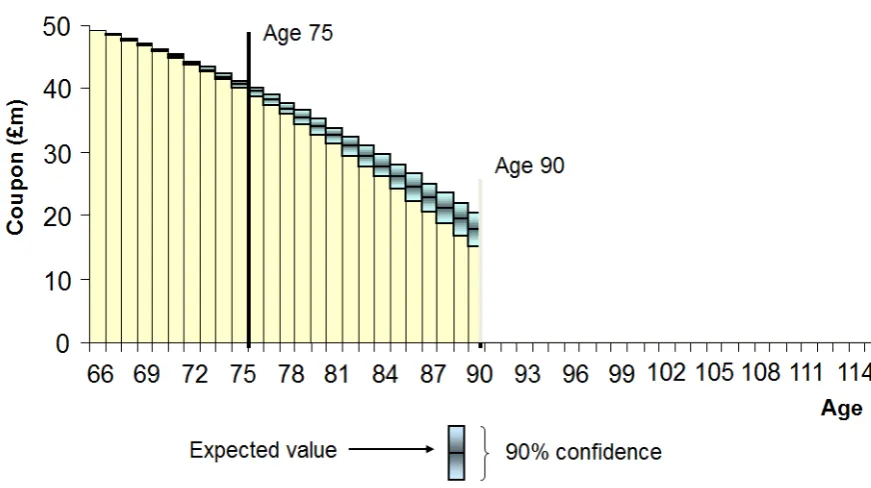
[image:16.595.76.512.373.617.2]The first longevity bond was proposed in November 2004.9 The proposed issuer was the European Investment Bank. The structurer of the bond was BNP Paribas, with PartnerRe as reinsurer of the longevity risk. The issue size was £540m, the maturity 25 years, and the initial coupon was £50m. Future coupon payments would be linked to a mortality index of 65-year-old males from England & Wales. Figure 15 shows the projected cash flows on the bond; there would be no return of principal. The bond was targeted at UK pension funds and would have provided a hedge against the systematic longevity risk that they faced. Unfortunately, the bond failed to attract sufficient investor interest and was withdrawn.10
Figure 15: Projected cash flows on the EIB longevity bond
More successful was the Swiss Re mortality catastrophe bond launched in December 2003. It was designed to hedge Swiss Re’s own holding of mortality risk.11 Known as Vita I, it was a 3-year contract (maturing on 1 January 2007) which allowed the issuer to reduce its exposure to
9 It was based on the bond design in Blake and Burrows (2001). 10 For further details, see Blake et al (2006).
11 This is the risk that people die sooner than expected, so that insurance companies that sold life policies (and
catastrophic mortality events, such as a severe outbreak of influenza, a major terrorist attack (using weapons of mass destruction), and a natural catastrophe. The mortality index (MI) was: US (70%), UK (15%), France (7.5%), Italy (5%), Switzerland (2.5%); male (65%), female (35%); also with age bands. The bond was a principal-at-risk bond and holders would have their principal reduced if MI exceeded an attachment point and lost altogether if it exceeded an exhaustion point. Similar mortality catastrophe bonds were subsequently issued by both Swiss Re and other insurers.12
A Swiss Re longevity spread bond, called Kortis, was issued in December 2010. The issue size was $50m and the maturity was 8 years. Bond holders were exposed to the risk of an increase in the spread (Longevity Divergence Index Value (LDIV)) between the annualized mortality improvements in English & Welsh males aged 75-85 v US males aged 55-65. The bond’s purpose was to hedge Swiss Re's own exposure to longevity risk. The bond was also a principal-at-risk bond.13
5.2 Derivatives
5.2.1 Mortality forwards
[image:17.595.160.437.445.532.2]A mortality forward rate contract is also referred to as a ‘q-forward’ because the letter ‘q’ is the standard actuarial symbol for mortality rate. It is the simplest type of instrument for transferring longevity (and mortality) risk. It was the first capital markets derivative to be executed (in January 2008): the hedger was Lucida, the hedge provider was J.P. Morgan, and the payments were linked to the LifeMetrics index based on England & Wales national male mortality for a range of different ages.
Figure 16: A q-forward which exchanges fixed mortality for realized mortality at the maturity of the contract
Specifically, a q-forward is a contract between two parties in which they agree to exchange an amount proportional to the actual realized mortality rate of a given population (or subpopulation), in return for an amount proportional to a fixed mortality rate that has been mutually agreed at inception to be payable at a future date (the maturity of the contract): see Figure 16. In the case of hedging longevity risk in a pension plan using a q-forward, the plan will receive the fixed mortality rate and pay the realized mortality rate at the end of the contract (and hence locks in the future mortality rate it has to pay whatever happens to actual rates). The counterparty to this transaction,
12 For further details, see Blake et al (2006). 13 For further details, see Hunt and Blake (2015).
Pension
Plan Provider Hedge
Amount x
realized mortality rate
Amount x
fixed mortality rate
typically an investment bank, has the opposite exposure, paying the fixed mortality rate and receiving the realized rate.14
5.2.2 Longevity (or survivor) swaps
[image:18.595.189.410.237.478.2]A longevity swap – also known as a survivor swap15 – is an instrument which involves exchanging actual pension payments for a series of pre-agreed fixed payments, as indicated in Figure 17, where each payment is based on an amount-weighted survival rate.
Figure 17: A longevity swap involving the regular exchange of actual realized pension cash flows and pre-agreed fixed cash flows
The Swiss Re – Friends’ Provident longevity swap was the world’s first publicly announced swap in April 2007. It was a pure longevity risk transfer, but in the form of an insurance contract not a capital markets instrument. The swap was based on Friends’ Provident’s £1.7bn book of 78,000 pension annuity contracts written between July 2001 – December 2006. Swiss Re makes payments and assumes longevity risk in exchange for an undisclosed premium.16
The J.P. Morgan – Canada Life longevity swap was the world’s first capital markets longevity swap in July 2008. Canada Life hedged £500m of its annuity book, representing 125,000 lives, using a 40-year swap customized to insurer’s longevity exposure. The longevity risk was fully transferred to investors, which included ILS and hedge funds. J. P. Morgan acted as the intermediary and assumed the counter-party credit risk.17
14 For further details, see Coughlan et al. (2007) and Blake et al (2013). 15 See Dowd et al (2006).
16 For further details, see Blake et al (2013). 17 For further details, see Blake et al (2013).
(400) (200) 0 200 400
2012 2014 2016 2018 2020 2022 2024 2026 2028 2030 2032 2034 2036 2038 2040 2042 2044 2046 2048 2050
Year C ash p aym en t ( £ m il li o n s)
Pension plan receives actual pension payments reflecting realized longevity
5.2.3 Longevity bull call spreads (or tail-risk protection)
To date there have been five publicly announced deals involving tail risk protection. The first two involved Aegon: one in 2012 was executed by Deutsche Bank and another in 2013 by Société Générale. The second two involved Delta Lloyd and Reinsurance Group of America (RGA Re) in 2014 and 2015, respectively. The most recent occurred in December 2017 between NN Life and Hannover Re and is similar to the Société Générale deal discussed below.
Société Générale’s tail risk protection structure was described in Michaelson and Mulholland (2015).18 It is an index-based hedge using national population mortality data, but with minimal basis risk,19 and is designed around the following set of principles (p.30-31):
In general, capital markets will be most effective in providing capital against the most remote pieces of longevity risk, called tail risk. This can be accomplished by creating ‘out-of-the-money’ hedges against extreme longevity outcomes featuring option-like payouts that will occur if certain predefined thresholds are breached. These hedges would be capable of alleviating certain capital requirements to which the (re)insurers are subject, thereby enabling additional risk assumption.
However, a well-constructed hedge programme must perform a delicate balancing act to be effective. On the one hand, it must provide an exposure that sufficiently mimics the performance of the underlying portfolio so as not to introduce unacceptable amounts of basis risk; while, on the other hand, it must simplify the modelling and underwriting process to a level that is manageable by a broad base of investors. Further, the hedge transaction must compress the 60+ year duration of the underlying retirement obligations to an investment horizon that is appealing to institutional investors.
Basis risk will reduce hedge effectiveness and this will, in turn, reduce the allowable regulatory capital relief. However, basis risk can be minimized if the hedger can customize three features of the hedge exposure:
• The hedger is able to select the age and gender of the ‘cohorts’ (also known as model points) they want in the reference exposure. For example, the hedger selects an exposure totalling 70 cohorts – males and females aged 65–99 – to cover all the retired lives in the pension plan.
• The hedger is able to choose the ‘exposure vector’, i.e., the ‘relative weighting’ of each cohort over time. This will equal the anticipated annuity payments for each cohort in each year of the risk period (see Table 1 for an example).
• The hedger is able to select an ‘experience ratio matrix’, based on an experience study of its underlying book of business. For each cohort, in each year of the risk period, a fixed adjustment is applied to the national-population mortality rate to adjust for anticipated differences between the mortality profile of the hedger’s book of business and the corresponding reference population. So if the hedger’s underlying lives are healthier than the general population, they will assign experience ratios of less than 100% to ‘scale down’ the mortality rate applied in the payout (see Table 2 for an example).
18 See, also, Cairns and El Boukfaoui (2018) for a more detailed description.
19 Basis risk is the residual risk associated with imperfect hedging where the movements in the underlying
Table 1: Exposure vector: Relative weighting of cohorts over time Cohort Year
1
Year 2
Year 3
… Year
15
Year 16
Year 17
… Year
54
Year 55
Male 65
1000 995 985 … 590 565 535 … 65 55
Male
66 980 975 960 … 505 485 450 … 45 40
… … … …
Female 99
125 120 115 … 20 10 5 … 0 0
Source: Michaelson and Mulholland (2015, Exhibit 1)
Table 2: Experience ratio matrix
Cohort Year 1
Year 2
Year 3
… Year
15
Year 16
Year 17
… Year
54
Year 55
Male 65
90% 89% 88% … 81% 80% 80% … 75% 75%
Male 66
89% 88% 87% … 80% 79% 79% … 75% 75%
… … … …
Female 99
77% 77% 76% … 75% 75% 75% … 75% 75%
Source: Michaelson and Mulholland (2015, Exhibit 2)
A risk exposure period of 55 years – as shown in Tables 1 and 2 – is unattractive to capital markets investors for a number of reasons. Liquidity in this market is still low and would be completely absent at these horizons. The maximum effective investment horizon is no more than 15 years. Just as important, the risks are too great. The likely advances in medical science suggests that the range of outcomes for longevity experience will be very wide for an investment horizon of more than half a century.
To accommodate both an ‘exposure period’ of 55 years or more and a ‘risk period’ (or transaction length) of 15 years, the hedge programme uses a ‘commutation function’ to ‘compress’ the risk period. As explained in Michaelson and Mulholland (2015, pp.32-33):
[image:20.595.67.501.311.491.2]• Selecting an appropriate longevity risk model and establishing the initial parameterization of the model using publicly available historical mortality data that exist as of the trade date. For a basic longevity model, the parameters that may be established, on a cohort-by-cohort basis, are (i) the current rate of mortality; (ii) the expected path of mortality improvement; and (iii) the variability in the expected path of mortality improvement.
• ‘Freezing’ the longevity risk model, with regard to the related structure; but also defining, in advance, an objective process for updating the model’s parameters based on the additional mortality experience that will be reported over the risk period. A determination needs to be made as to which parameters are subject to updating, as well as the relative importance that will be placed on the historical data versus the data received during the risk period.
• Re-parameterizing the longevity model by incorporating the additional mortality data reported over the life of the trade. This occurs at the end of the transaction risk period, once the mortality data for the final year in the risk period have been received.
• Calculating the present value of the remaining exposure using the re-parameterized version of the initial longevity model. This is done by projecting future mortality rates, either stochastically or deterministically, and then discounting the cash flows using forward rates determined at the inception of the transaction.
The benefit of this approach to the hedger is that ‘roll risk’20 is reduced, since, by taking account of actual mortality rates over the risk period, there will be a much more reliable estimate at the end of the risk period of the expected net present value of the remaining exposure than if only historical mortality rates prior to the risk period were used. The benefit to the investor is that the longevity model is known and not subject to change, so the only source of cash flow uncertainty in the hedge is the realization of national population mortality rates over the risk period – see Figure 18.
The hedge itself is structured using a long out-of-the money call option bull spread on future mortality outcomes. The spread has two strike prices or, using insurance terminology, an attachment point and an exhaustion point. The spread is constructed using a long call at the lower strike price and a short call at the upper strike price – see Figure 19. These strikes are defined relative to the distribution of ‘final index values’ calculated using the agreed longevity model. The final index value will be a combination of:
• The ‘actual’ mortality experience of the hedger throughout the risk period which is calculated by applying the reported national population mortality rates to the predefined ‘exposure vector’ and ‘experience ratio matrix’ for each cohort in each year of the risk period, and accumulating with interest, using forward interest rates defined on the trade date.
• The ‘commutation calculation’ which estimates the expected net present value of the remaining exposure at the end of the risk period, calculated using the re-parameterized version of the initial longevity model.
20 This is the risk that arises when a hedger is not able for some reason to put on a single hedge that covers the
Figure 18: Mortality rates before, during and after the risk period
Note: Projected mortality rates are calculated using experience data available at end of the risk period. Source: Michaelson and Mulholland (2015, Exhibit 3)
Figure 19: Bull call spread payoff to hedger
Note: Both axes in $m
Given the distribution of the final index, the attachment and exhaustion points are selected to maximize the hedger’s capital relief, taking into account the investors’ (i.e., risk takers’) wish to maximize the premium for the risk level assumed. Investors might also demand a ‘minimum
[image:22.595.72.525.346.666.2]premium’ to engage in the transaction. The intermediary – e.g., the investment bank – therefore needs to carefully work out the optimal amount of risk transfer, given both the hedger’s strategic objectives and investor preferences.
The hedger then needs to calculate the level of capital required to cover possible longevity outcomes with a specified degree of confidence. For example, if the ‘best estimate’ of the longevity liability is $1bn, the (re)insurer may actually be required to issue $1.2bn, $200m of which is reserve capital to cover the potential increase in liability due to unanticipated longevity improvement with 99% confidence.
[image:23.595.79.514.348.510.2]The (re)insurer may then decide to implement a hedge transaction with a maximum payout of $100m. This transaction would begin making a payment to the hedger in the event the attachment point is breached, and then paying linearly up to $100m if the longevity outcome meets or exceeds the exhaustion point – see Figure 19. This hedge provides a form of ‘contingent capital’ from investors (up to $100m of the $200m required), enabling the hedger to reduce the amount of regulatory capital it must issue – see Figure 20.
Figure 20: Distribution of the final index value and the potential for capital reduction
Source: Michaelson and Mulholland (2015, Exhibit 3) – not drawn to scale
5.3 Total size of the macro-longevity market
Figure 21 shows that $366bn of longevity risk transfers have taken place between 2007 and 2017.
6.THE MICRO-LONGEVITY RISK MARKET
The principal product subject to micro-longevity risk is a life settlement. This is a life insurance policy sold by its owner for more than the surrender value21 but less than face value.
Figure 21: Cumulative Pension Risk Transfers by Product and Country, 2007-17
Sources: LIMRA, Hymans Robertson, LCP and PFI analysis as of 31 December 2017
2007 2008 2009 2010 2011 2012 2013 2014 2015 2016 2017
$22 bn
Canada All
$101bn
UK Longevity Swaps
$128bn
UK Buy-outs and Buy-ins
$115bn
The secondary market in life insurance policies is dominated by the US. The US market took off in the 1990s when viatical settlements were introduced. Viators are owners of life policies who are very close to dying, such as AIDS sufferers who needed to sell their policies to pay for medical treatment. That market ceased suddenly in 1996 when protease inhibitors were introduced. It was replaced by a senior life settlements (SLS) market which deals with the whole life policies22 of elderly high net worth individuals. Two medical doctors or underwriters are used to assess each policyholder’s life expectancy (LE). The most important criterion for successful investment in life settlements is a good estimate of LE. The investor purchasing the life settlement has to continue paying the premiums on the underlying policy while the original policyholder is still alive.
LE estimates vary widely. A study by A.M. Best of 909 life portfolio underwritten by the three major LE underwriters found that there was an average spread of 8 months between the longest and second longest underwriter, and an average spread of 24 months between longest and shortest underwriter. These differences can have a significant effect on investor returns. The implied return on the portfolio based on the shortest LE underwriter was 12.4%, while it was 8.3% based on second longest underwriter and 6.5% based on longest underwriter.
Underestimating LE is the key micro-longevity risk faced by investors in life settlements, since this makes the promised returns on life settlements more attractive than the realized returns. The SLS market experienced a significant setback when, in 2008, the shortest of the LE underwriters revised upwards their LEs by between 20 and 25%, while the second longest revised upwards by between 5 and 10%. LE providers were forced to respond by establishing the Life Expectancy Providers Focus Group in October 2010 with the aim of offering a comprehensive and consistent set of best practices and performance standards to all life markets that make use of life expectancy and mortality information. The group also addresses issues such as privacy, fraud, and confidentiality policies. The group’s founding members were Advanced Underwriting Solutions, AVS Underwriting, Examination Management Services, Inc., ISC Services and 21st Services.
A number of solutions have been put forward to hedge micro-longevity risk or ‘extension risk’ as it is more commonly known. One is a hedge offered by certain investment banks based on a synthetic index of life settlements. Another is known as FAIRE and consists of both individual and portfolio extension risk hedges, priced off the LE underwriter Fasano’s LEs. FAIRE is provided by Fasano Associates and Augur Capital, a German investment manager of life insurance and life settlement assets.
In 1994, the Life Insurance Settlement Association (LISA) was established in Orlando, Florida as a trade association for viatical and life settlement companies.23
In 2005, the Life Exchange was established with an objective ‘to provide the secondary life insurance market with the most advanced and independent electronic trading platform available by which to conduct life settlement transactions with the highest degree of efficiency, transparency, disclosure, and regulatory compliance’. This was not a success and later delisted.
22 A whole life policy has two components, a life insurance component and an investment component: periodic
premiums (monthly, quarterly, annual, single, for example) cover the cost of the life insurance, with the surplus going into an investment fund. In the US market, the insurance company typically invests the surplus premium in fixed-income securities to build up a ‘cash value’. The cash value is separate from the ‘face value’ of the policy, which is the guaranteed insurance value.
In 2007, the Institutional Life Markets Association (ILMA), started in New York with the mission ‘to expand and apply capital market solutions in life insurance, educate consumers that their insurance may be a valuable asset, expand consumer choices about how to manage it, and support the responsible growth and regulation of the industry. We believe that expanded consumer choice and full disclosure of all fees is good for the consumer and for the industry’.24
In 2008, Institutional Life Services (ILS) and Institutional Life Administration (ILA), a life settlements trading platform and clearing house, were launched by Goldman Sachs, Genworth Financial, and National Financial Partners. ILS/ILA was designed to modernize dealing in life settlements and meet the needs of consumers (by ensuring permanent anonymity of the insured) and of the capital markets (by providing a central clearing house for onward distribution of life settlement assets, whether individually or in structured form). In 2010, National Financial Partners became the sole owner of ILS/ILA.25
One of the latest developments is the attempt to introduce a synthetic life settlements market. This is to avoid some of the costs, monitoring, and ethical issues associated with the physical life settlements market.26The synthetic market would be based on indices and the returns will depend on the performance of the pool of lives in the index. The first attempt to do this was by Goldman Sachs which introduced a QxX Life Settlements Index in 2007. This market failed to take off – the spreads offered were too wide to making trading profits – and the index was discontinued in 2009.
In 2008, Credit Suisse initiated a longevity swap with Centurion Fund Managers, whereby Centurion acquired a portfolio of synthetic life policies, based on a longevity index built by Credit Suisse. In 2010, the Fasano Longevity Life Settlements Index was introduced. In April 2011, the International Society of Life Settlement Professionals (ISLSP)27 formed a life settlement and derivatives committee and announced that it was developing a life settlement index. The purpose of the index is to benchmark net asset values in life settlements trading. Investors need a reliable benchmark to measure performance and the index will help turn US life insurance policies into a tradable asset class according to ISLSP. The calculation agent for the index is AA Partners.
There are a number of other much smaller secondary markets in life insurance policies, including:
• Traded endowment policies in the UK. The maturity date of policies is fixed, but the maturity value of the policy depends on the performance of an investment fund. The policy premiums are invested in a risk-graded with-profits fund established by the life company selling the policy. There is a fixed minimum return in the event of policy holder dying during term.
• Secondary market for life insurance in Germany.German consumers have been able to sell life and pension insurance policies to professional policy buyers since 1999. The trade body
24 www.lifemarketsassociation.org 25 http://www.ils-us.com/
26 It is an expensive process to acquire suitable life policies for settlement with a range of intermediaries who
for the secondary market in life insurance is the Bundesverband Vermogensanlagen im Zweitmarkt Lebensversicherungen (BVZL).28 There is also the European Life Insurance
Settlement Association (ELSA).29
7.A ROLE FOR GOVERNMENT?
In principle, longevity bonds could be issued by private-sector organizations. As previously mentioned, pharmaceutical companies would be natural issuers, because their revenues are positively linked to survivorship: the longer people live, the more they will spend on medicines. Although this is true, the scale of the demand for longevity bonds far exceeds conceivable private-sector supply from companies such as pharmaceuticals. Further, there would be significant credit risk associated with the private-sector issuance of an instrument intended to hedge a systematic risk many years into the future.
In practice, therefore, the only realistic issuer of longevity bonds in scale is the government. The UK Pensions Commission also suggested the government should consider the use of longevity bonds to absorb tail risk for those over 90 or 95, provided it exits from other forms of longevity risk pre-retirement, which it has done by linking state pension age to increases in life expectancy and by raising the future state pension age from 65 to 69 by 2050: ‘One possible limited role for government may, however, be worth consideration: the absorption of the ‘extreme tail’ of longevity risk post-retirement, i.e., uncertainty about the mortality experience of the minority of people who live to very old ages, say, beyond 90 or beyond 95’.30
Blake et al (2014) argue that there are three important reasons why the government should engage in sharing longevity risk with the private sector:
• It has an interest in ensuring there is an efficient annuity market.
• It has an interest in ensuring there is an efficient capital market for longevity risk transfers.
• It is best placed to engage in intergenerational risk sharing, such as providing tail risk protection against systematic trend risk, and in exchange earn a longevity risk premium.
There are two areas where government support is required.
First, the government can help with the construction of national longevity indices. It is for reasons of accuracy that longevity indices would most likely have to be based on national mortality data – which only the government collects. A key component of the success of the new capital market will be the timely publication of accurate and independently calculated longevity indices. The longevity indices would cover mortality rates, survivor rates, and life expectancies for both males and females.
Second, the government can make an important contribution by issuing longevity bonds to facilitate price discovery, thereby encouraging capital market development. Longevity risk is not currently actively traded in the capital markets, so we do not have a good estimate of its market price or premium. But if the government issued a small number of longevity bonds, this would help to establish and maintain the market-clearing ‘price points’ for longevity risk at key ages and future dates, and hence establish a market price for longevity risk. In other words, the bonds would help to
28 www.bvzl.de 29 www.elsa-sls.org
establish the riskless term structure for survivor rates for ages above 65 for future years. There is a clear analogy with the fixed-income and index-linked bond markets. In these markets, the issue of government bonds helped to establish the riskless term structures for interest rates and inflation rate expectations, respectively, for terms out to 50 years or more. The private sector was then able to issue corporate fixed-income and index-linked bonds with different credit risks (AAA, AA, etc.) and establish credit term structures above the riskless benchmark curves.
[image:28.595.81.525.356.612.2]The longevity risk term structure is more complex than either the interest rate or inflation term structures, since it is two dimensional – involving age as well as time – whereas the latter are one-dimensional, involving only time. The longevity risk term structure is therefore a two-dimensional surface, rather than a line: cohorts move diagonally across the surface over time, getting one year older with every passing year, with some members of the cohort dying each year. This is demonstrated in Figure 22, which shows the cash flows on two deferred longevity bonds: one bond based on male lives from the national population aged 65 and one bond based on male lives from the national population aged 75. Each bond is specified by four dates: the birth year of the cohort being tracked (e.g., 1945), the issue date (e.g., 2010), the first payment date (e.g., 2020), and the last payment date (e.g., 2050). There is a corresponding mortality term structure for females, so longevity bonds are also identified by gender (M or F).
Figure 22: Longevity bond cash flows across ages and time
Source: Blake et al (2014)
8.PRICING
The same will be true of the Life Market to begin with. In this section, we consider the pricing of a fairly simple longevity-linked instrument, namely a longevity bond issued by the government, following the framework outlined in Blake et al (2014). Clearly the demand for longevity bonds will depend on their price. Demand will be higher the closer the government offers the bonds at true economic cost, that is, charges a fair, but not excessive, longevity risk premium.
Blake et al (2014) accept it is appropriate that the government seeks to charge a fair risk premium on longevity bonds because this ensures intergenerational fairness. The expected cost of the longevity risk should be borne by those whose retirement incomes will be derived from the bonds. Some might argue that the government should seek to charge a risk premium in excess of the economic cost. For example, if, in a Solvency II world, insurance companies writing annuity business end up having to hold capital in excess of true economic levels, because they are unable to hedge longevity risk, then they might be prepared to pay a premium price for longevity bonds if, by doing so, they can reduce their capital requirements. This would obviously depend on the Solvency II treatment of longevity bonds and the capital reduction that the regulators would allow. Blake et al (2014) argue that it would be short sighted of governments to seek to exploit this situation. If insurance companies can reduce their capital requirements closer to economic capital levels, then this should result in higher annuity values with the consequent benefits to government, pensioners and savers already highlighted.
Blake et al (2014) also argue that it is most unlikely that a liquid market for longevity bonds will develop if the government just focuses on insurers. The bonds will need to be priced to attract defined benefit (DB) pension plans, which do not currently face solvency capital requirements. DB plans that do not have a pressing need for a full buy-out (which will be subject to Solvency II capital via insurers) and that want to engage in risk management will buy longevity bonds only if they believe they are priced fairly (and cheaper than longevity swaps and other derivative longevity hedges provided by the private sector). So, if we want to ensure DB pension plans buy longevity bonds issued by the government, the government should not price them above AAA.
Members of defined contribution (DC) pension plans who are derisking (i.e., lifestyling or life cycling) in the run-up to their retirement will have a choice between using long-dated bonds and longevity bonds, and again many will be discouraged from using longevity bonds if the government looks to charge a markup beyond the fair price. Other investors, including investment banks, will also be discouraged from buying longevity bonds if they believe the longevity risk premium is excessive, because they will fear that the bonds will eventually fall in value to reflect their true economic cost.
So for the market in longevity bonds to take off, Blake et al (2014) recommend that they should be priced according to economic capital principles. They propose an approach that builds on the insurance industry ‘cost-of-capital’ method. This determines a risk premium (or risk margin) for capital above the best estimate of the value of the liabilities. The best estimate of the value of the liabilities in their model is derived from the median scenario from 10,000 possible stochastic mortality rate scenarios using the CBD model and, at any point in time, is the present value of the expected future coupons on the bond from the median scenario discounted at the risk-free rate.
The cost-of-capital method involves four stages for determining the risk premium (RP):
• Determine the required credit rating for the bond (e.g., AAA).
• Multiply each annual longevity capital requirement (LCR) by a percentage cost of capital to give the cost of capital in money terms.
• Calculate the present value of each of these cost-of-capital (CoC) amounts using a risk-free discount rate and sum to give the present value of the overall risk premium.31
[image:30.595.64.535.321.461.2]Table 3 shows the total risk premium for a number of longevity bonds for illustrative costs of capital of 2% and 3%. It also shows the corresponding basis points (bps) reductions from the risk-free rate. Take the longevity bond LBM(65,75) and a 2% cost of capital, for example. This bond – where the coupon payments are linked to the mortality experience of 65-year-old UK males, but with the first coupon delayed until this cohort reaches age 75 – has a total risk premium of 3.2%. This means that the issue price of the bond would be £103.20. The effective yield on the bond is equal to the risk-free rate less the basis points reduction, so the effective yield on LBM(65,75) is 3.821%. The table shows that the risk premium increases with the cost of capital, but, more significantly, increases with the deferral period.
Table 3: Risk premiums on longevity bonds using industry cost-of-capital method to give AAA credit rating
Risk premiums and basis points reduction in yield on longevity bonds
Bond 2% cost of capital 3% cost of capital
Risk premium Bps reduction Risk premium Bps reduction
LBM(65,65) 1.4% 13.4 bps 2.0% 20.0 bps
LBM(65,75) 3.2% 17.9 bps 4.7% 26.5 bps
LBM(65,90) 15.1% 48.7 bps 22.6% 70.8 bps
LBM(75,75) 1.2% 16.5 bps 1.8% 24.7 bps
LBM(75,85) 4.1% 27.6 bps 6.2% 40.8 bps
LBM(75,90) 8.2% 42.6 bps 12.4% 62.2 bps
Notes: LBM(65,75) is a longevity bond relating to UK males aged 65, with the first coupon paid at age 75, etc. The risk premium is the total for each bond. The basis points reduction shows the annual reduction from the assumed risk-free yield of 4%.
Source: Blake et al (2014, Table 4)
9.INVESTOR ENGAGEMENT
The Life Market – especially the macro-longevity segment – will only be a success in the long run if sufficient investment capital is attracted to it. The macro-longevity market is currently dominated by insurers and reinsurers, but their total capacity is small relative to the potential size of the market. New capital must be attracted and the two key attractions are a longevity risk premium and diversification with respect to traditional asset classes. However, these features by themselves have not proved to be sufficient to attract new investors in the numbers required since the market started in 2006. Much more needs to be done to understand the needs of investors and to segment then into their ‘natural’ investor bases, as recommended by Coughlan (2011).
9.1 Investor segmentation
A key element of investor segmentation is understanding what is being hedged: cash flow or value. With a cash flow hedge, each individual cash flow in, say, a pension plan liability is hedged in each period. This is the insurance ‘indemnity paradigm’. With a value hedge, only the value of the liability at a future time horizon is hedged. This is the ‘risk management paradigm’and takes account of all cash flows beyond the horizon.
Each has a different ‘natural’ investor base: the former being suited only for investors ‘attached to’ insurers in some way, such as in a sidecar (discussed below in section 9.3), the latter being suited to investors familiar with standard capital markets instruments, such as bonds and related derivatives. An important dimension of segmentation is segmentation by age. Figure 23 illustrates this for cash-flow-related longevity risks for 65-year-old males. Insurers are natural holders of this risk out to, say, age 75. They are also comfortable in the UK holding the 75-90 age segment. However, in countries with less well-developed insurance markets, there might be a role for government to help with this segment, either through the issue of deferred longevity bonds or by selling annuities to individuals who survive to these ages. But even in countries like the UK, private-sector insurers are much less willing to assume the longevity risk of those who survive to age 90 and beyond. Further, the price of deferred annuities from age 90 would be so high – as a result of solvency capital requirements – that demand for them would be negligible.32 This leaves the government as the only realistic provider of a longevity hedge for the post-90 age segment, as recognized by the UK Pensions Commission in 2005.
Figure 24 illustrates the case for value-related longevity risks for 65-year-old males. Capital markets investors are natural holders of this risk so long as the hedge does not have a maturity beyond 10 years. Such a hedge – which could be in the form of a bond, a q-forward or a value swap – could be attractive to pension funds since it does partially hedge their cash flows beyond 10 years.
How well does this segmentation fit with pension funds wishing to hedge the longevity risk exposure of their members? Funds with pensions in payment will be looking at the insurance indemnity paradigm. They can access this through buy-outs and buy-ins and there is currently sufficient insurance capacity to meet their needs in full. However, if there were to be a significant increase in demand for buy-outs and buy-ins, this capacity might no longer be there and it would be reduced, beginning with the third segment in Figure 24. We should therefore see increasing requests for government support for the post-90 age segment. By government support, we, in effect, mean the next generation. Young workers are natural holders of higher age longevity risk, since their own longevity risk will not materialize for many decades. Government support can therefore be viewed as a form of intergenerational longevity risk sharing – as mentioned in section 7 above.
For younger pre-retirement members, value hedges are the only practical near-term solution. This is because longevity risk is long duration for this group and insurers and reinsurers are reluctant to take this risk on its own. A value hedge is therefore natural because there is no cash flow risk until retirement.
32 As an analogy, Table 3 shows how the risk premium increases with the deferral period in the case of longevity
Figure 23: Age segmentation of investors: Provision of cash flow hedges for age 65
[image:32.595.77.523.103.419.2]Source: Coughlan (2011)
Figure 24: Segmentation of investors: Provision of value hedges for age 65
The first examples of hedges fitting this framework are given in Table 4.
Table 4: Early examples of cash flow and value hedges
Date Hedger Provider Type Description
Jan 2008 Lucida J.P. Morgan Value hedge 10-year q-forward (LifeMetrics Index) July 2008 Canada Life J.P. Morgan Cash flow
hedge 40-year survivor swap Feb2009 Aviva Royal Bank of
Scotland Cash flow + value hedge 10-year collared survivor swap + final commutation payment Jan 2011 Pall UK
Pension Fund J.P. Morgan Value hedge 10-year q-Forward (LifeMetrics Index) Source: Coughlan (2011)
9.2 Expanding the asset class
The next step in the process is to expand the asset class to capital markets investors. As Coughlan (2011) points out this involves identifying supply and demand mismatches amongst capital markets investors – see Table 5 and recalling the discussion in section 3.3 above – and then resolving them.
Table 5: Supply and demand mismatch (capital markets investors)
Supply-side wishes Demand-side wishes
Customized hedges Standardized investments
Long duration Short duration
Collateral Liquidity
First, we need to address the challenges for the supply-side. Pension plans need to recognize the extent of their implicit longevity ‘investment’. This becomes easier if, as they should, they evaluate the liability as close as possible to the true economic value, by discounting based on swaps with realistic longevity assumptions. They also need to change their mindset about longevity hedging, by moving from an ‘indemnification’to a ‘risk management’mindset. This will require them to consider alternative hedging approaches, such as index-based hedges and shorter maturity hedges of liability value. In turn, it requires them to understand basis risk better and why it is a much smaller risk to bear – in an index-based hedge – than longevity risk itself.
Another issue is counterparty credit risk. This is the risk that one of the counterparties to, say, a longevity swap contract defaults owing money to the other counterparty. When a swap is first initiated, both counterparties might expect a zero excess profit or loss.33 But over time, as a result of realized mortality rates deviating from the rates that were forecast at the time the swap started, one counterparty’s position will be showing a profit and the other will be showing an equivalent loss. The insurance industry addresses this issue via regulatory capital and the capital markets deal with it via collateral. The role of regulatory capital and collateral is to significantly reduce, but not entirely eliminate counterparty credit risk. The European Union’s Solvency II Directive, for example, sets a solvency capital requirement (SCR) at a level which ensures that an insurance company can meet its obligations over the next 12 months with a probability of at least 99.5%. By contrast, in the capital
33 This is the case for a transaction involving a pension plan and an insurer, where allowance is made for the
[image:33.595.68.532.374.432.2]markets, collateral in the form of high quality securities needs to be posted by the loss-making counterparty to cover such losses. However, the collateral also has to be funded and the funding costs will depend on the level of interest rates. Further, the quality of the collateral and the conditions under which a counterparty can substitute one form of collateral for another need to be agreed. This is done in the credit support annex (CSA) to the ISDA34 Master Agreement that establishes the swap. The CSA also specifies how different types of collateral will be priced.
Second, we need to address the challenges for the demand-side. Standardization is being addressed in a number of ways, such as: industry initiatives, e.g., LifeMetrics and LLMA; and the introduction of index-based hedges for pre-retirement pension members. Then there is the ‘long duration’ problem: the hedger wants a long-term hedge, while the investor wants an exposure that is much shorter. Both parties need to compromise. The way the hedger compromises is to use a value hedge and not a cash flow. The way the investor compromises is to accept that liquidity will be limited – at least in the early stages of the market.35
The key problem with customized solutions for some participants36 is that they are not liquid and cannot easily be reversed. By contrast, liquidity is a key advantage of deep and well-developed capital market solutions. However, liquidity requires standardized contracts. The fewer the number of standardized contracts traded, the greater the potential liquidity in each contract, but the lower the potential hedge effectiveness. There is therefore an important tradeoff to be made, such that the number of standardized contracts traded provides both adequate hedge effectiveness and adequate liquidity. If they are ever to achieve adequate liquidity, it is likely that capital-markets-based solutions will have to adopt either mortality indices capital-markets-based on the national population as the primary means of transferring longevity risk or sub-population indices that are transparent, trustworthy, reliable and durable. However, potential hedgers, such as life assurers and pension funds, face a longevity risk exposure that is specific to their own policyholders and plan members: for example, it might be concentrated in specific socio-economic groups or in specific individuals such as the sponsoring company’s directors. Hedging using population mortality indices means that life assurers and pension funds will facebasis risk if their longevity exposure differs from that of the national population. Herein lies the tension between index-based hedges and customized hedges of longevity risk, and, in turn, the unavoidable tradeoff between basis risk and liquidity. Until the market fully develops, some limited liquidity could be provided by the intermediary.
Other challenges for the demand-side include:
• Improving education, such as the development of both longevity expertise and longevity investment capabilities.
• Structuring portfoliosto cope with longevity positions that have longer maturity and lower liquidity than other investments.
• Developing capabilities to invest in derivative format, e.g., swaps as well as bonds.
• Working with hedgers and intermediariesto develop new investment structures to address liquidity and maturity challenges.
34 International Swaps and Derivatives Association.
Finally, there are challenges for intermediaries. Principally, these are to: provide liquidity to investors, provide credit intermediation, and to develop attractive bond-like products, which is essential to open up a larger universe of fixed-income investors. These are traditionally the areas of expertise of investment banks. But following the Global Financial Crisis, it has become more difficult for banks to engage in such non-core activities. Either insurers/reinsurers develop the relevant expertise or investment banks are persuaded to re-enter the market.
9.3 A new vehicle – reinsurance sidecars
One recent way in which the insurance industry has helped to attract new investors is through the reinsurance sidecar37 – which is a way to share risks with new investors when the latter are concerned about the ceding reinsurer having an informational advantage.38
Formally, a reinsurance sidecar is a financial structure established to allow external investors to take on the risk and benefit from the return of specific books of insurance or reinsurance business. It is typically set by existing (re)insurers looking to partner with or accept capital from third-party investors.
It is established as a special purpose vehicle (SPV), with a maturity of 2-3 years. It is capitalized by specialist insurance funds, usually by preference shares, though sometimes in the form of debt instruments. It reinsures a defined pre-agreed book of business or category of risk. Liability is limited to assets of the SPV and the vehicle is unrated.
[image:35.595.86.477.522.682.2]The benefit to insurers is that sidecars can provide protection against exposure to peak longevity risks,39 help with capital management by providing additional capacity without the need for permanent capital, and can provide an additional source of income by leveraging underwriting expertise. The benefit to investors is that they enjoy targeted uncorrelated returns relating to specific short-horizon risks and have an agreed procedure for exiting. Investors can also take advantage of temporary price hikes, but without facing legacy issues that could affect an investment in a typical insurer. Figure 25 shows a typical sidecar structure.
Figure 25: Typical sidecar structure
Source: PFI
37 For further details, see Blake et al (2018) and Bugler et al (2018). 38 See, e.g., Akerlof (1970).
There are a number of challenges to the use of sidecars in the longevity risk transfer market. There is the tension between the long-term nature of longevity risk and investor preference for a short-term investment horizon. There are also regulatory requirements on cedants, affecting their ability to generate a return. These include: the posting of prudent collateral, the underlying assets in the SPV must generate matching cash flows, the risk transfer must be genuine, and the custodian/trustee must be financially strong. There is also a risk to cedants of losing capital relief if regulatory requirements are not met or they change.
9.4 Longevity assets in a diversified portfolio
[image:36.595.73.512.298.547.2]Figure 26 shows the benefits in terms of risk reduction from a pension fund having even a small allocation to a longevity-linked asset, in this case a longevity swap. Since, longevity-linked assets are to a first-order uncorrelated with financial assets, such as equities and bonds, this makes them an attractive asset to hold in a diversified portfolio.
Figure 26: Efficient frontier with and without longevity swaps
However, it is important to note that there will some smaller second-order correlations, such as: credit risk, e.g., if an insurance company is involved as a counter-party; liquidity and interest rate risk if funding and leverage are used by investors; and through economic linkages, both in the short-term – e.g., suicides rise in a recession – and in the long-term – richer economies spend more on medical research and development.
10.CONCLUSION