Article
Super-multi-junction solar cell, device configuration
with the potential of more than 50 % of the annual
energy conversion efficiency (non-concentration)
Kenji Araki 1,*, Yasuyuki Ota 2, Hiromu Saiki 3, Hiroki Tawa 3, Kensuke Nishioka 3, and
Masafumi Yamaguchi 1
1 Toyota Technological Institute, Nagoya, 468-8511 Japan
2 Organization for Promotion of Tenure Track, University of Miyazaki, Miyazaki, 889-2192, Japan 3 Faculty of Engineering, University of Miyazaki, Miyazaki, 889-2192, Japan
* Correspondence: [email protected]; Tel.: +81-52-809-1830
Featured Application: This technology is expected to be applied to the vehicle-integrated photovoltaic that the installation area is limited, but high performance is demanded.
Abstract: The highest efficiency solar cell won in the efficiency race does not always give the most excellent annual energy yield in the real world solar condition that the spectrum is ever-changing. The study of the radiative coupling of the concentrator solar cells implied that the efficiency could increase by the recycle of the radiative recombination generated by the surplus current in upper junction. Such configuration is called by a super-multi-junction cell. We expanded the model in the concentrator solar cell to non-concentrating installation. It was shown that this super-multi-junction cell configuration was found robust and can keep the maximum potential efficiency (50 % in realistic spectrum fluctuation) up to 10 junctions. The super-multi-junction cell is also robust in the bandgap engineering of each junction. Therefore, the future multi-junction may not be needed to tune the bandgap for matching the standard solar spectrum, as well as relying upon artificial technologies like ELO (Epitaxial lift-off), wafer-bonding, mechanical-stacking, and reverse-growth, but merely uses up-right and lattice-matching growth technologies. We have two challenging techniques; one is the optical cap layer that may be the directional photon coupling layer in the application of the photonics technologies, and another is the high-quality epitaxial growth with almost 100 % of the radiative efficiency.
Keywords: Tandem; Solar cell; Multi-junction; Performance ratio; Spectrum; Modeling; Radiative Coupling; Luminescence Coupling
1. Introduction
Solar panels with more than 40 % of the power conversion efficiency in the real world will change our society, including that running a majority of electric vehicles on solar energy [1]. The potential of the conversion efficiency of solar cells was one of the most popular research topics in photovoltaic science and has been studied intensively by many people with a bright future of the potentials of photovoltaic energy conversion [2-4]. These are based on strong scientific background with ideal but trustworthy preconditions. However, the materials and processes in the real world were not ideal, and the record efficiency values of photovoltaic are less than that [5-6]. For example, Yamaguchi et al. predicted more than 45% efficiency in fields concentrator solar cells intensively studied for the application of CPV (Concentrator photovoltaic) [2], but the highest efficiency ever-achieved is 44.2% in 2013 by Sharp Corporation [5-6]. Most recently, a series of researches that was based on the practical limit of the material improvement to various materials like Si, III-V, II-VI thin films, organic, and Perovskite, as well as various configurations like quantum dots, hetero-junction, and multi-junction, has been published [7-11]. Obviously, these kinds of efficiency-limit studies tend
to present a decreased record number by the improvement of the model, namely by increasing constraints and taking inherent limitations (small but non-negligible). However, taking an example of the energy conversion efficiency, namely the efficiency from the sunlight (ASTM G173 AM1.5G standard solar spectrum) to the electricity power, the highest-efficiency solar cells are a group of multi-junction cells [1, 5-7].
The principles of multi-junction cells were suggested by Jackson in 1955 [12], and Wolf et al. investigated from 1960 [13]. However, the efficiency of the multi-junction cells did not make significant progress by 1975 because of inadequate thin-film fabrication technologies. The liquid-phase and vapor-liquid-phase epitaxy brought AlGaAs/GaAs multi-junction cells in the 1980s, including tunnel junctions by Hutchby et al. [14], and metal interconnections by Ludowise et al. [15], Flores [16] and Chung et al. [17]. Fan et al. predicted the efficiency of close to 30% at that time [18], but it was not achieved because of difficulties in high-performance, stable tunnel junctions [19] as well as oxygen-related defects in the AlGaAs at that time [20]. Yamaguchi et al. developed high-performan1e, stable tunnel junctions with a double-hetero (DH) structure [21]. Olson et al. introduced InGaP for the top cell [22], Bertness et al. achieved 29.5% efficiency by a 0.25 cm2 GaInP/GaAs multi-junction cell [23]. Recently, 37.9% efficiency and 38.8% efficiency have been achieved with InGaP/GaAs/InGaAs 3-junction cell by Sharp [24] and with 5-junction cell by Spectrolab [25].
Historically, the high-efficiency multi-junction cells have been used to concentrator photovoltaic (CPV). The energy conversion efficiency substantially increases by concentration operation [26]. Significant cost reduction was predicted in the 1960s [27]. The Wisconson Solar Energy Center investigated performance of solar cells under the concentrated sunlight [27]. R&D Programs under DOE (US Department of Energy), EC (European Commission), and NEDO (New Energy and Industrial Technology Development Organization, Japan) realized the high conversion efficiencies by CPV module and system. 44.4% efficiency was demonstrated with InGaP/GaAs/InGaAs 3-junction concentrator solar cell by Sharp [24]. The CPV system increased its installation in a dry area in the world after 2008. By 2017, the total installation in the world reached 400 MW [ 28].
The outdoor performance of the multi-junction solar cells for CPV application was intensively analyzed, and the most significant loss is known as the spectrum mismatching loss [28-37]. This was caused by the fact that the solar spectrum is not always the same as the designed one (typically, ASTM G173 AM1.5D spectrum for CPV application). The sub-cells in the multi-junction cells are electrically connected in series. The spectrum shift hampers the balance of the output current from sub-cells, and the sub-cell with the smallest output current constrains the total output current by the Kirchhoff's law. This type of loss is called “spectrum mismatching loss.” The spectrum mismatching loss is an inherent loss for all types of the multi-junction or multi-junction solar cells, nevertheless of CPV or normal flat-plate application, and except for more than 3 terminal configurations that the output of the sub-cells is individually connected to the load. Note that in every type of installation, a variation of the solar spectrum by the sun height and fluctuation of the scattering and absorption of the air by seasonal effect in inevitable, but its influence can be minimized by the improvement of the solar cell design [38- 43].
The research on the robustness to the spectrum change has been made in these 20 years, including a computer model named Syracuse by Imperial Courage of London [44-46]. For CPV applications, it was understood that the chromatic aberration of the concentrator optics enhanced the spectrum mismatching loss [44-53]. However, such loss coupled with the concentrator optics could be solved by the innovation of optics, including homogenizers and the secondary optical element (SOE) [54-55]. The remaining problems of the spectrum mismatching loss have been overcome by the adjustment of the absorption spectrum of each sub-cell, including overlapping the absorption spectrum and broadening the absorption band to the zone of massive fluctuation.
radiation coupling would be adequate to suppress the spectrum mismatching loss [57-60]. This idea was further developed by a group of authors [61-64]. However, the work of authors was limited to the application of CPV because of simplicity of spectrum and performance modeling.
The radiative recombination was also identified to impact to the performance of the multi-junction cell, even in operation under the standard testing condition (not dynamically changing spectrum like outdoor spectrum). Taking an example of the research on Fraunhofer ISE [65], and later, by use of the rear-side mirror for the use of the recycled photon by radiative recombination, realized high open-circuit voltage and 28.8 % of efficiency under 18.2 W/cm2 concentrated irradiance [66]. The measurement and identification of the radiative coupling and photon recycling were done in several types of solar cells, including GaAs cells [67], the strain-balanced quantum well cells [68], and even emerging solar cells like Perovskite solar cells [69]. The radiative coupling also affects the measurement of the multi-junction solar cells, and it is often called luminescence coupling [70-72].
Recently, the multi-junction solar cells are considered to be used for non-concentrating applications, including car-roof PV [1, 73-88]. It was considered that the majority of the electric vehicle might be able to run by solar energy using a solar cell mounted on the car-roof [1]. The area of the car-roof is limited. Moreover, solar cells may not be laminated to an undevelopable curved surface of the car body. It is difficult to entirely cover the car-roof surface. Therefore, extremely high performance is required to such application.
Unlike CPV applications that the cell is always normal to the sun by the solar tracker and only receives direct sunlight, the non-concentration application needs to use diffused component of the sunlight from sky and ground reflection and skewed solar ray with combination of the direct and diffused component as a function of the sun orientation relative to the solar panel orientation.
This article describes the model of the behavior by the spectrum variation, with a contrast of previous researches at first [89-94]. Then, the model is validated by the outdoor measurement. Finally, the potentials of performance impacted by a seasonal change of the spectrum are examined to examine the super-multi-junction configuration should be robust or not.
Since the target of this work is to identify the limit of the performance of the solar cell under the realistic assumption of the spectrum, the material discussed in this work is the ideal one, namely not realistic in the current technology. However, it is far from realistic to attempt to change and control the solar spectrum to the ASTM G173 AM1.5G standard solar spectrum all the day time, but we will be able to improve the material quality to approach to the ideal one. Although the discussion in solar cell performance relying on the ideal material, on the contrary, realistic spectrum condition is different from majority of research papers, it should be worth reconsidering the limit of the solar cells under the real solar spectrum that most of scientists sometimes forget.
2. Model
In this section, we present a model of the multi-junction solar cells and the super-multi-junction solar cells affected by the fluctuation of the spectrum. Since, the solar spectrum is not affected by the sun-height (airmass), but affected by many other climate and atmospheric conditions, we need to model the performance of the multi-junction solar cells by probability model, namely the Monte Carlo method. Next, we discuss how multi-junction solar cell behaves by the variation of atmospheric parameters with complexed interaction with other climate and the sun-related variations.
2.1. What is the super-multi-junction solar cell?.
Although the multi-junction cells have high efficiency, their performance ratio affected by the spectrum variation was typically less than the single-junction solar cells. It is due to spectrum mismatching loss influenced by the variation of sun-height [95, 42] and atmospheric parameters [96-97]. The power output of the conventional multi-junction solar cells constrained by the spectrum mismatching loss may be predicted, and we need a solution to minimize the damage.
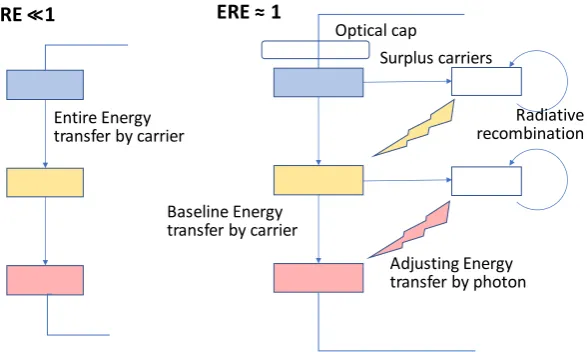
bottle-necked junction [63]. Figure 1 indicates the configuration of the super-multi-junction cell [63]. Note that the optical cap layer in the super-multi-junction solar cell is for confining recycled photons, namely to reduce the angle of the escape cone from the solar cell. We may carry the energy that was to be lost by the surplus current by the spectrum mismatching by radiative recombination [6 3]. However, an excessive number of junctions sometimes is harmful, like no advantage in more than four junctions [61, 98]. Actually, the efficiency started to drop in more than 6 junctions in concentrator solar cells [61]. The calculation in the past was done in a combination of the cases such as a combination of worst-case atmospheric conditions, and perfect junctions (full absorption, no leakage) [61, 98]. There may be a chance of reasonable compromise. Then, we need to develop a new model considering an individual variation of atmospheric conditions and spectrum.
Figure 1. The energy flow of the multi-junction cells: (a) Normal multi-junction cell; (b)Super-multi-junction cell. ERE means external radiative efficiency [61].
2.2. Monte Carlo simulation for analyzing the annual performance of multi-junction cells
The design, performance analysis, and optimization calculation we used is the combination of the numerical optimization calculation and the Monte Carlo method (Figure 2) [63, 97-99]. The merit function for optimization calculation is the annual average efficiency of the power conversion, directly coupled to the performance ratio. The initial value for optimization calculation can be given by that of combination determined at the sun height of the culmination on the winter solstice [1 00]. The optimized bandgap given by this method was identified to be closed to the values given by the optimizing routine [100]. Considering that the target of this calculation is to identify the variation of the output performance influenced by the different climate and spectrum in other years (Figure 2), the difference between the initial value and optimized value was not crucial, namely, both had broad distributions [100], and difference between the initial value and optimized results were often invisible. Therefore, for saving the computation time, the first step of the flow-chart in Figure 2 was optimized not by the annual dataset (365 days multiplied by the number of division of the time in the daytime) but by the representative sun height in the one of the culmination on the winter solstice.
With the increase in the number of junctions in the simulation in Figure 2, there may be the case that the efficiency of i of the number of the junction is higher than that of (i+1) of the number of junctions. This case can be equivalently modeled by allowing that the bandgap energy of the (i+1)th junction is equal or greater than that of the (i)th junction, but not allowing the bandgap energy of the (i+1)th junction is less than that of the (i)th junction.
Entire Energy transfer by carrier
ERE <<1 ERE≈ 1
Adjusting Energy transfer by photon Surplus carriers
Radiative recombination
Baseline Energy transfer by carrier
Figure 2. Flow-chart of its performance calculation using the Monte Carlo method [61]. 2.3. Modeling multi-junction solar cells affected by a variety of spectrum
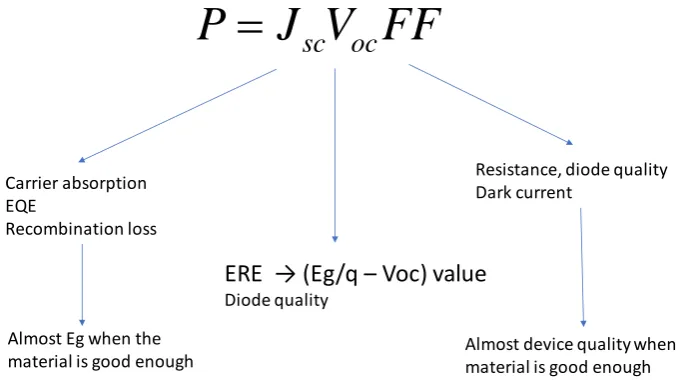
For dataset impacted by the fluctuation of the spectrum by random number is given by either histogram of the parameters [57-60] or superpositioning the random number provided by logarithmic normal distribution along the seasonal fluctuation trend lines of the atmospheric parameters [61, 63, 97-99]. The series resistance was assumed 1 Ωcm2, and fill factor FF was calculated by the ratio of the spectrum mismatching, specifically, generating a correlation chart between calculated FF and the ratio of mismatching at first, then, general trend of these two parameters was fit to the parabolic curve so that the FF is represented as the function of the spectrum mismatching index. This step significantly accelerated the computation time. Otherwise, it is necessary to calculate every dataset of the output current and voltage (typically 100 points of the volta ge and current of the I-V curve), then, the maximum power point should be calculated by optimization problem. For calculation of the performance ratio, this routine needed to be repeated 12 representative days in every month or 365 days (depending on the available solar irradiance data and computing time) multiplied by the number of division of the time in the daytime, or every 1 hour, depending on the available solar irradiance database, for every attempt of the seeking of the combination of the bandgaps of each junction in optimization step. The external quantum efficiency was assumed to unity by the wavelength corresponding to the bandgap of the junction. The angular characteristics in the photon absorption were assumed to be Lambertian. The open-circuit voltage at 1 kW/m2 irradiance of each junction was assumed to the bandgap voltage minus 0.3 V, namely, the best crystal quality in the current epitaxial growth conditions [100]. Figure 3 and Figure 4 summarizes the assumptions in the calculation of the efficiency potential of the solar cell.
Bandgap optimization by annual
spectrum of the year of
m
.
Yearly-averaged efficiency in the
year of (
m
+
n
)
Generates histogram and
compares
Figure 3. Diagram of how output power of solar cells is calculated (composed of three factors).
Figure 4. Assumptions in the calculation of the efficiency potential of the solar cell using three factors.
That analysis of the concentrator solar cells was done in our previous research [61, 63, 97-99]. The calculation and analysis for concentrator solar cells were relatively simple because we did not have to consider angular effects combined with the mixture ratio of the direct and diffused spectrum of the sunlight. Moreover, concentrator solar cells generate power only under the direct sunlight, but the non-concentrating solar cell also generates power in the diffused sunlight so that we have to model the solar spectrum in all kinds of climates. For the extension to non-concentrating applications, we needed to solve the complicated coupling of spectrum and angles (Table 1). The key parameters are atmospheric parameters, dependent on each other. For example, different incident angle modifier, different orientation lead to a diverse mixture of direct and diffused sunlight. The atmospheric parameters were calculated by the spectrum by a data-fitting calculation using Spectrl2 model [102] by the measurement in the University of Miyazaki [24, 103]. The developed model for the analysis of the non-concentrating solar cell is given by Figure 5 [103,-105].
sc
oc
P
=
J V FF
Carrier absorption EQE
Recombination loss
Resistance, diode quality Dark current
ERE → (
Eg/q
–
Voc) value
Diode qualityAlmost Eg when the
material is good enough Almost device quality when material is good enough
Isc
:
Ideal absorption and rectangular EQE windows. 100 % absorption bellow the bandend EQE: Unity bellow the bandend, EQE: Zero above the bandend. Surface reflectance: Zero
Shading loss by electrodes: Zero Angular response: Lambartian
Voc
:
Minus 0.3 V from the bandgap voltage at 1 kW/m2irradiance.
Junction temperature: always 27 C
Diode ideality factor: Unity (every junction)
0.8 0.82 0.84 0.86 0.88 0.9 0.92 0.94 0.96 0.98 1
0.5 0.6 0.7 0.8 0.9 1
Ca
lc
u
la
ted
FF
(Minimum sub-junction current) / (Spectrum-matched current)
FF
:
Parabolic approximation as a function of the spectrum mismatching ratio.
Series resistance: 1 Ωcm2
Leak resistance: Infinity Diode ideality factor: Unity
Table 1. The difference in performance modeling between concentrator PV and standard installation.
CPV1 Normal installation
Solar spectrum Only Direct A mixture of Direct, Diffused from the sky, and Reflection
Angle Always normal Varies by time and seasons
Spectrum by angle Constant (only normal) Needs consider coupling to angle 1 It only generates power only by direct solar irradiance using a 2-axis solar tracker.
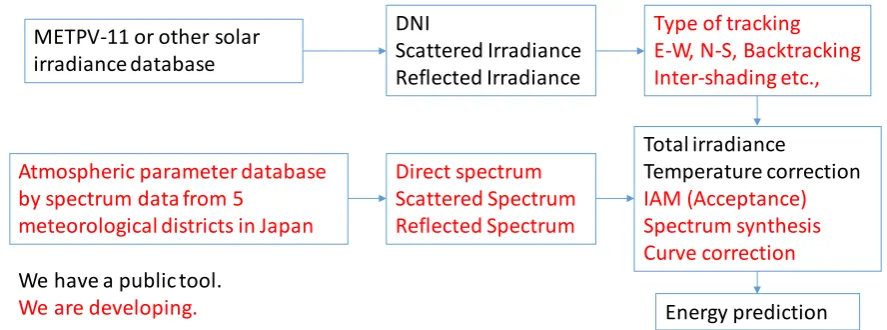
Figure 5. Modeling performance of the non-concentrating multi-junction solar cells considering the complicated spectrum and angle interaction described in Table 1. In this study, we only considered the flat-plate, so that the correction to the curved surface in the integrated tool was not applied [101].
3. Results
For the analysis and optimization, thus anticipating the upper limit of the annual performance to both a multi-junction solar cell and super-multi-junction solar cell under non-concentration operation, we needed to verify the non-concentration operation model of the multi-junction solar cells affected by spectrum (Figure 5). Then, we integrated the operation model (Figure 5) to bandgap optimization and distribution of the annual performance prediction by the Monte Carlo method (Figure 2). The integrated calculation was applied to the normal multi-junction solar cell and the super-multi-junction solar cell (Figure 1).
3.1. Validation of the outdoor operating model for non-concentrating multi-junction solar cell
The calculated energy generation trend was compared to the PV module prototype using three-junction tandem cell monitoring by the University of Miyazaki. The validation of the model (Table 1 and Figure 3) was carried out with the cooperation of the University of Miyazaki [97]. The detailed structure of the module and outdoor performance is found in the publication of Ota [106-107]. The solar cell used in the module was InGaP(1.88eV)/GaAs(1.43eV)/InGaAs(0.98eV) inverted triple-junction solar cell. The InGaP top and the GaAs middle cell layers were grown on a GaAs substrate at first using MOCVD technology, and then, the InGaAs bottom cell (larger lattice-constant than GaAs) was grown. Deterioration of crystal quality of the InGaP/GaAs layers was avoided before the growth of buffer layer. After the growth of cell layers in an inverted order, cell layers were mounted on a handling substrate, and the GaAs substrate was removed. The module was assembled using these mounted cells, and its efficiency reached 31.17 % under the standard testing condition [106-107].
The general trend between the model and measurement is shown in Figure 6. Although the model trend was generated by the values of average years from the meteorological and solar
METPV-11 or other solar irradiance database
DNI
Scattered Irradiance Reflected Irradiance
Atmospheric parameter database by spectrum data from 5
meteorological districts in Japan
Direct spectrum Scattered Spectrum Reflected Spectrum
Total irradiance
Temperature correction IAM (Acceptance) Spectrum synthesis Curve correction
Type of tracking E-W, N-S, Backtracking Inter-shading etc.,
Energy prediction We have a public tool.
irradiance database (METPV-11), the seasonal pattern matched to the measured performance very well. Note that the measured trend of the non-concentrating operation of the high-efficiency three junctions solar cell (31.17% efficiency) behaves strange fluctuation of performance that could not explain by the conventional model as it is commented in the right chart in Figure 6, but the calculated trend by the new model (Table 1 and Figure 5) successfully explained the strange behavior affected by spectrum change coupled with angular characteristics.
Figure 6. Comparison between the measured and modeled seasonal trend of the performance of the PV module using multi-junction solar cells [100]. Pereformance ratio can be calculated by the formula defined as PR = Yf / Yr, where PR is performance ratio, and Yf is the integrated energy yield of one-day, and Yr is nominal energy yield of one day calculated by the STC module efficiency and total insolation.
In the validation of this model, the critical parameter related to the calculation in the super-multi-junction solar cell is the degree of the luminescence coupling between the middle junction and the bottom junction. Note the degree of radiative coupling from the middle cell to the bottom cell (typically 15 %) is the key to the validation of the model, and we must consider its coupling; otherwise, the model (Figure 2) could not meet to the outdoor validation (Figure 7). The level of the coupling ratio of the middle junction (GaAs) was measured by Derkacs et al. as the function of the current level using a GaAs/GaInNAsSb two-junction cell, and the one corresponding to the non-concentration operation (14 mA/cm2) was about 15% [108].
0.75 0.8 0.85 0.9 0.95 1 1.05
1/1 1/31 3/2 4/1 5/1 5/31 6/30 7/30 8/29 9/28 10/28 11/27 12/27
P
er
fo
rm
an
ce
r
at
io
Calculated by the rated values and atmospheric parameters in normal year
to PV module using III-V 3J cells
Dot: Measured daily performance ratio filtered by > 4.5
kWh/m2irradiance
High performance but relatively high temperature
Valley depth varies by the type of concentrator cells Isc drops sharply (not Voc) Quick decline, why?
PV module using 3J tandem cell
Area: 983 cm2 STC: 31.7 % 2016/08 –up to now
Figure 7. Recovery of the spectrum mismatching loss due to water absorption in summer by enhancing the ratio of luminescence coupling between the middle junction and the bottom junction, added and modified from the original chart in [101]. The multiple-colored-lines correspond to the level of the luminescence coupling between the middle junction and the bottom junction, from the bottom to the top, 0 %, 10 %, 20 %, …90 %. Note that the variation of the performance ratio impacted by the spectrum change was reduced by the increase of the level of luminescence coupling, but the right depth in summer corresponds to the ones of 10 % and 20 % of the luminescence coupling. Pereformance ratio can be calculated by the formula defined as PR = Yf / Yr, where PR is performance ratio, and Yf is the integrated energy yield of one-day, and Yr is nominal energy yield of one day calculated by the STC module efficiency and total insolation.
3.2 Normal multi-junction vs. Super-multi-junction; Practical conditions
The design of the super-multi-junction cells by the worst-case atmospheric conditions can be done, assuming both aerosol density and water precipitation.
The achievement in section 3.1 implies that we can apply the model to the practical conditions by validated energy generation model of the multi-junction solar cell affected by the spectrum variation considering complexed conditions listed in Table 1 and utilizing the calculation flow in Figure 3. However, we need local data both climate (solar irradiance) and atmospheric parameters. The model depends on the local conditions and is not applied globally.
Another crucial point is that the distribution of the atmospheric parameters, especially aerosol density was the worst for the general performance to multi-junction solar cells with more than three junctions, even though the airmass level (20° of latitude) is low. The worst-case distribution of the aerosol density was closed to North India [57-60], and this region was known as one of the worst areas for the energy generation to the multi-junction solar cells in the field experience [109-110]. This is another reason why we need to develop an annual performance model based on the realistic atmospheric conditions with a probability of the realistic variations.
3.2.1. Modeling the practical spectrum variation
For developing the operation model of the multi-junction solar cells affected by the probability distribution of the crucial parameters for the basic calculation flow in Figure 2, we defined the parameters given by random numbers. Table 2 as the independent parent variables and Table 3 as
Degree of radiation coupling of the GaAs middle
cell determines the depth of the dip.
the dependent variables calculated by the parent independent probability variables considering local conditions.
Table 2. List of the probability parameters for modeling variation of annual performance (independent parent parameters).
Range and type Description
Variation factor in aerosol density
Normal distribution centered on 0
Calculated by the residual errors in the measured point form the smooth trend line.
Variation factor in water precipitation
Normal distribution centered on 0
Calculated by the residual errors in the measured point form the smooth trend line.
Variation factor in solar irradiance1
Ranged uniform distribution in [-1, 1]
-1: Lowest irradiance year, 0: Normal year, 1: Highest irradiance year. The irradiance data is calculated by the linear coupling of three parameters depends on the value of the probability factor. The base irradiance data was given in
24 hours x 365 days by METPV-11 and METPV-Asia database
1 The same factor is applied both to direct and diffused sunlight.
Table 3. List of the probability parameters for modeling variation of annual performance (dependent parameters).
Parent parameters Description
Aerosol density Variation factor in aerosol density
The variation factor gives a relative displacement from the trend line of the aerosol density.
Water precipitation Variation factor in water precipitation
The variation factor gives a relative displacement from the trend line of water precipitation.
Direct irradiance Variation factor in solar irradiance
Calculated by linear coupling of the data of the highest year, normal year, and the lowest year depends on the
value of the probability factor.
Diffused irradiance from the sky
Variation factor in solar irradiance
Calculated by linear coupling of the data of the highest year, normal year, and the lowest year depends on the
value of the probability factor.
The slope angle of the installation1
Both direct and diffused solar
irradiance
Calculated by the optimization calculation given by the datasets of the solar irradiance affected by the variation
factor in solar irradiance (parent parameter) 1 Meaning that the slope angle is determined simultaneously by the combination of the optimized bandgaps in
the junctions by the measured one-year irradiance (affected in the measurement in the first step in Figure 2).
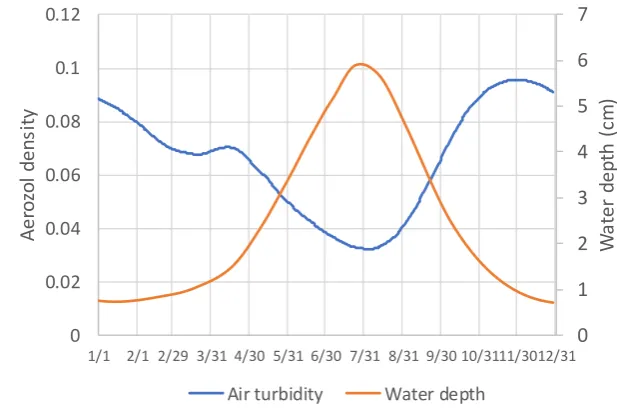
The crucial probability parameters are the first two in Table 2. This distribution of these parameters was analyzed by the comparison between measured atmospheric parameters from the seasonal trend lines. The seasonal trend lines of the atmospheric parameters, namely aerosol density and water precipitation, are plotted in Figure 8. These were calculated by the data fitting of the periodically observed solar spectrum line in a horizontal plane at University of Miyazaki, Japan (N31.83°, E131.42°) [61, 96-97, 103-105, 111]. Generally, the aerosol density is high in winter but low in summer, and the water precipitation, on the other hand high in summer. This trend can be seen in the entire region of Japan. However, there may be some regional characteristics. In Miyazaki, for example, a distinct peak in aerosol density appears in April that corresponding to the pollen of cedars and cypress trees
Figure 8. Seasonal fluctuation of the atmospheric parameters in the area of the University of Miyazaki, taken by the curve-fitting method to the spectral profile modeled by Spectrl2 [111]. The trend line was defined by the local least-square-error method
The fluctuation of the parameters from the trend lines can be modeled by the approximation of the distribution function of the residual error. The residual errors of the measured atmospheric parameters from the trend line (relative to the values in the trend line) are plotted in Figure 9.
(a) (b)
Figure 9. Histogram of the residual errors of the measured atmospheric parameters from the trend line (relative to the values in the trend line): (a) Aerosol density; (b) Water precipitation.
For seeking the best representative distribution, we used a Q-Q plot, namely a quantile-quantile plot that examines the values of two distributions (Figure 10). The best results were found in the normal distribution in both cases. In this plot, the x-axis corresponds to the values distributed to the normal distribution, and the y-axis corresponds the measured values. If these two distributions are entirely matched, the plotline will be in the 45° (y = x) line. The parameter sets of the normal distribution of the aerosol density and water precipitation were (0, 0.30) and (0. 0.38). The first term inside the parentheses is mean value, and that of the second value is a standard deviation. We also examined the statistical adequateness by one-sample Kolmogorov-Smirnov test [112]. The alternative hypothesis was “True: cumulative distribution function is not the normal distribution with given parameters, for example (0, 0.30) for aerosol density, with estimated parameters”. The p-value in both cases was zero, implying that it is next to impossible to deny that both distributions of the relative residual errors of atmospheric parameters from the reference trend lines are different from the normal distribution. Therefore, we defined the probability parameters in the first two parameters in Table 1
0 1 2 3 4 5 6 7
0 0.02 0.04 0.06 0.08 0.1 0.12
1/1 2/1 2/29 3/31 4/30 5/31 6/30 7/31 8/31 9/30 10/3111/3012/31
W
at
er
d
ep
th
(
cm
)
A
er
o
zo
l d
en
si
ty
Air turbidity Water depth
-1.0 -0.8 -0.6 -0.4 -0.2 0.0 0.2 0.4 0.6 0.8 1.0 Residual error (relative to the trend line) 0
200 400 600 800 1000 1200
Coun
t
-1.0 -0.8 -0.6 -0.4 -0.2 0.0 0.2 0.4 0.6 0.8 1.0 Residual error (relative to the trend line) 0
100 200 300 400 500
Coun
(Variation factor in aerosol density and Variation factor in water precipitation) as the random numbers distributed normal distribution centered in zero and 0.30 and 0.38 standard deviations.
(a) (b)
Figure 10. Quantile-quantile plot that examines the values of two distributions: (a) Aerosol density; (b) Water precipitation.
3.2.2. Computation results of the Monte Carlo simulation in the practical conditions
The distribution of the annual average efficiency of both a multi-junction solar cell and a super- multi-junction solar cell optimized by the spectrum in one year in Miyazaki is shown in Figure 11. The trend of the average of the annual average efficiency in each event in Figure 2 besides the standard deviation of the distribution is shown in Figure 12, for overviewing the general efficiency trend after optimization. Note that the spectrum for optimization was not the artificial standard spectrum (AM1.5G), but an accidental annual spectrum given by Monte Carlo simulation calculated by the flow-chart in Figure 5, considering both seasonal and accidental fluctuation in the atmospheric parameters and fluctuation of the solar irradiance within the range of the highest and lowest irradiance in Miyazaki taken from the solar irradiance database of METPV-11. The underlying probability model for the calculation of the distribution of the average annual efficiency was given by the flow-chart in Figure 2.
(a) (b)
Figure 11. Optimization design result of the normal multi-junction solar cells (distribution of the annual average efficiency) under the worst-case combination of climate, atmospheric conditions, latitude, and orientation angle. The y-axis is normalized so that the integration of the distribution becomes unity: (a) Normal multi-junction solar cell; (b) Super-multi-junction solar cell.
-0.5 -0.3 -0.1 0.1 0.3 0.5 Normal distribution (0,0.3)
-0.5 -0.3 -0.1 0.1 0.3 0.5 Resi du al er ro r (re lat iv e) of the ae ro s ol de ns it y
-0.5 -0.3 -0.1 0.1 0.3 0.5 Normal distribution (0,0.38) -0.5 -0.3 -0.1 0.1 0.3 0.5 Resi du al er ro r (re lat iv e) of the water pre c ipit ati on
0 10 20 30 40 50 Annual mean efficiency (%) 0.0 0.2 0.4 0.6 0.8 Dis tribu tion den s it y (%
-1) 2J
3J
4J 10J
(a) (b)
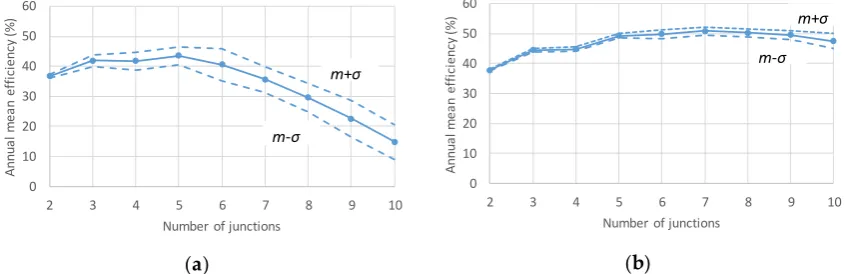
Figure 12. Optimization design result of the normal multi-junction solar cells (trend of an average of the annual average efficiency by variation of the spectrum) under worst-case combination of climate, atmospheric conditions, latitude, and orientation angle. m indicates average of the annual average efficiency, and σ indicates its standard deviation: (a) Normal multi-junction solar cell; (b) Super-multi-junction solar cell.
The normal multi-junction solar cell showed the broader distribution of the average annual efficiency depending on the spectrum in that year, as the increase of junction number. It is because the width of the absorbing spectrum band of each junction becomes narrower. It implied that the impact on the annual average efficiency by the spectrum mismatching loss increases with the increase of the number of junctions. As a result, the annual average efficiency peaked at four junctions and turned to decrease by the increase of the number of junctions.
The super-multi-junction solar cell, on the contrary, showed narrower distribution, but it still shows a slightly broader distribution by the increase of junction number. The annual average efficiency in the super-multi-junction solar cells is expected to reach 50% by 6-8 junctions.
An example of the distribution of the optimized bandgap energy of 10 -junction solar cells is shown in Figure 13. The optimized bandgap was calculated according to the spectrum and other climate conditions given by random numbers, according to Figure 2. The histogram of the calculated optimized bandgap energy in each junction is normalized so that the integral of the range becomes unity. The overlap of each peak does not mean that the higher bandgap junction has lower bandgap energy than that of the lower peak. It is constrained that the bandgap structure was equivalently modeled by allowing that the bandgap energy of the (i+1)th junction is equal or greater than that of the (i)th junction, but not allowing the bandgap energy of the (i+1)th junction is less than that of the (i)th junction.
The most distinct difference of the super-multi-junction solar cell from the normal multi-junction solar cell is the level of the top junction. The distribution of the optimized bandgap energy of the top junction was substantially lower than that of the normal multi-junction solar cell. It is because that the short-wavelength region of the sunlight is changeable by the fluctuation of the aerosol scattering and the lower bandgap energy in the top junction is favorable in generating surplus current so that it compensates the spectrum mismatching loss by transferring the photon energy generated by the recombination by the surplus current of the top junction.
The set of the bandgap energy of the super-multi-junction solar cell is listed in Table 4. Unlike the current technology, the designed bandgap of each junction has a range, reflecting that the super-multi-junction solar cell is robust to the bandgaps.
0 10 20 30 40 50 60
2 3 4 5 6 7 8 9 10
A
n
n
u
al
m
ea
n
e
ff
ic
ie
n
cy
(
%
)
Number of junctions
m+σ
m-σ
0 10 20 30 40 50 60
2 3 4 5 6 7 8 9 10
A
nn
ua
l m
ea
n
ef
fi
ci
en
cy
(%
)
Number of junctions
m+σ
Figure 13. Distribution of the bandgap energy of the optimized (to the spectrum and other climate conditions given by random numbers according to Figure 2) multi-junction solar cells under the modeled fluctuation in the climate in Miyazaki, Japan (N31.83°, E131.42°). This is an example of 10 junctions. Note that the histogram of the calculated optimized bandgap energy in each junction is normalized so that the integral of the range becomes unity. Also, note that the overlap of each peak does not mean that the higher bandgap junction has lower bandgap energy than that of the lower peak. It is constrained that the bandgap structure was equivalently modeled by allowing that the bandgap energy of the (i+1)th junction is equal or greater than that of the (i)th junction, but not allowing the bandgap energy of the (i+1)th junction is less than that of the (i)th junction. The y-axis is normalized so that the integration of the distribution becomes unity: (a) Normal multi-junction solar cell; (b) Super-multi-junction solar cell.
Table 4. List of the set of the bandgap of the super-multi-junction solar cell. Bandgap energy (eV) from top to bottom junction
2J ±1.72 0.03
1.12 ±0.02
3J ±1.89 0.05
1.33 ±0.07
0.89 ±0.08
4J ±1.99 0.07 1.47 ±0.07 1.07 ±0.09 0.73 ±0.11
5J 2.11 ±0.09 1.63 ±0.07 1.27 ±0.09 0.97 ±0.08 0.72 ±0.10
6J ±2.08 0.15 1.68 ±0.11 1.34 ±0.11 1.07 ±0.11 0.84 ±0.11 0.66 ±0.11
7J ±2.17 0.16 1.80 ±0.11 1.48 ±0.10 1.21 ±0.12 0.99 ±0.11 0.77 ±0.12 0.62 ±0.12
8J ±2.19 0.16 1.84 ±0.09 1.53 ±0.11 1.28 ±0.10 1.05 ±0.10 0.86 ±0.09 0.67 ±0.09 0.55 ±0.09
9J ±2.25 0.19 1.88 ±0.13 1.61 ±0.12 1.37 ±0.11 1.13 ±0.10 0.95 ±0.10 0.70 ±0.10 0.62 ±0.08 0.52 ±0.08
10J ±2.21 0.21 1.89 ±0.14 1.63 ±0.14 1.40 ±0.12 1.19 ±0.14 1.00 ±0.11 0.82 ±0.12 0.66 ±0.10 0.55
±0.09 ±0.46 0.09
0.0 0.5 1.0 1.5 2.0 2.5
0 2 4 6
0.0 0.5 1.0 1.5 2.0 2.5
4. Discussion
In the previous work, we showed that the super-multi-junction solar cells could solve the low annual performance of concentrator photovoltaic systems affected by the mismatching loss due to the solar spectrum variation. The spectrum influence equally affects the non-concentrating solar cells. However, the impact of the spectrum variation for non-concentrating applications needed to consider complexed phenomena of direct, scattered, and reflected spectrum combined with angular effect. It was not appropriate to expand the model to the non-concentrating applications.
We then tried to develop annual modeling performance of the multi-junction solar cells with considering of spectrum (climate pattern, atmospheric parameters, sun-angle, airmass). The spectrum-enhanced performance model of the multi-junction solar cells successfully explained the strange behavior of the annual performance.
Then, we combined this model to the previous work of optimization of the bandgap energy by the Monte Carlo method. The previous works of the optimization and sensitivity of the spectrum change relied on the distribution of the atmospheric parameters, especially those of worst -case. This method was too simple to describe the real fluctuation of the spectrum. For example, the aerosol density and water precipitation had a distinct seasonal change that correlates sun height and climate trends. The new probability model was developed by investigating the residual error distribution of atmospheric parameters that were identified to distribute on the normal distribution.
The non-concentrating super-multi-junction solar cell was found robust and can keep almost the same to the maximum potential efficiency (50 %) under the realistic conditions represented by Miyazaki, Japan (N31.83°, E131.42°).
The fact that the super-multi-junction solar cell is also robust of the bandgap engineering of each junction. Therefore, the future multi-junction may not be needed to tune the bandgap for matching the standard solar spectrum, as well as relying upon artificial technologies like ELO, wafer -bonding, mechanical-stacking, and reverse-growth, but merely uses up-right and lattice-matching growth technologies. Although we have two challenging techniques; one is the optical cap layer that may be the directional photon coupling layer in the application of the photonics technologies, and another is the high-quality epitaxial growth with almost 100 % of the radiative efficiency.
The super-multi-junction solar cell is also robust in the bandgap engineering of each junction. Therefore, the future multi-junction may not be needed to tune the bandgap for matching the standard solar spectrum, as well as relying upon artificial technologies like epitaxial lift-off (ELO), wafer-bonding, mechanical-stacking, and reverse-growth, but merely uses up-right and lattice-matching growth technologies. Although we have two challenging techniques; one is the optical cap layer that may be the directional photon coupling layer in the application of the photonics technologies, and another is the high-quality epitaxial growth with almost 100 % of the radiative efficiency (Figure 14).
In comparison to the current level of the ERE of various solar cells that were collected by several authors [8, 113-115], the requirement of the super-multi-junction solar cells is extremely high. For the improvement of ERE, a typical and straightforward approach is to reduce
threading dislocation density [116]. The target of the threading dislocation density is at least 103
cm-2, but as small as possible [116].
Figure 14. Possibility of the future high-efficiency solar cell technology based on the implication from the super-multi-junction solar cell.
5. Conclusions
i. Multi-junction cells: Highest efficiency but lower energy yield.
ii. Super-Multi-junction cell: Compensation of spectrum mismatching loss by sharing photons generated by radiation recombination due to surplus current of spectrum mismatching. iii. Annual performance: The model considering spectrum mismatching was validated and
applied to super-multi-junction design.
iv. Super-multi-junction solar cell performance: Robust to the spectrum change. Its annual average efficiency levels off at 50% in the realistic spectrum fluctuation.
v. Future multi-junction solar cells: may not be needed to tune the bandgap for matching the standard solar spectrum, as well as relying upon artificial technologies like ELO, wafer-bonding, mechanical-stacking, and reverse-growth, but merely uses up-right and lattice-matching growth technologies.
Author Contributions: Conceptualization, K. A.; methodology, K. A..; software, K. A., H. S., and H. T.; validation, K. A., H. S., H. T., and Y. O.; investigation, Y. O. and M. Y.; data curation, H. S., H. T., and Y. O.; writing—original draft preparation, K. A.; writing—review and editing, K. A., and Y. O.; visualization, K. A., and Y. O.; supervision, Y. O.; project administration, K. N. and M. Y.; funding acquisition, K. N. and M. Y.
Funding: This research was funded by the New Energy and Industrial Technology Development Organization (NEDO) under the Ministry of Economy, Trade, and Industry (METI), Japan.
Acknowledgments: NEDO in Japan has partially supported this work. Conflicts of Interest: The authors declare that there is no conflict of interest. References
1. Araki, K.; Ji, L.; Kelly, G.; Yamaguchi, M. To Do List for Research and Development and International Standardization to Achieve the Goal of Running a Majority of Electric Vehicles on Solar Energy. Coatings 2018, 8, 251.
2. Yamaguchi, M. Super-high-efficiency III-V multi-junction and multi-junction cells. Archer MD Green MA eds. Clean electricity from photovoltaics. 2nd edition (Imperial Collage Press), 2015, 307-338.
3. Bett, A. W. Multi-junction cells for very high concentration. Marti, A Luque, A eds. Next generation photovoltaics. (IOP), 2004, 64-90.
4. Bett, A. W.; Dimroth, F.; Siefer, G.; Multijunction concentrator solar cells. Luue, A. Andreev, V. eds. Concentrator photovoltaics. (Springer), 2007, 67-87.
5. Green, M. A.; Dunlop, E. D.; Levi, D. H.; Hohl-Ebinger, J.; Yoshita, M.; Ho-Baillie, A. W., Solar cell efficiency tables (version 54). Progress in Photovoltaics: Research and Applications, 2019, 27, (NREL/JA-5K00-74116). 6. Green, M.A.; Emery, K.; Hishikawa, Y.; Warta, W.; Dunlop, E.D.; Levi, D.H.; Ho-Baillie, A.W.Y. Solar cell
efficiency tables (version 51). Prog. Photovolt. 2017, 25, 668–676.
Current technology
Bandgap engineering for exactly match to standard AM1.5 G spectrum Epi-growth in lattice mismatching ELO, Wafer-bonding, Reverse-growth, Mechanical stack …
Future technology
Tuning bandgap is not important
Freedom of bandgap, simply stack.
Crystal quality for ERE keeps high
7. Yamaguchi, M.; Lee, KH.; Araki, K.; Kojima, N.; Ohshita, Y.; Analysis for efficiency potential of crystalline Si solar cells. Journal of Materials Research. 2018, 33(17), 2621-6.
8. Yamaguchi, M.; Yamada, H.; Katsumata, Y.; Lee, K. H.; Araki, K.; Kojima, N.; Efficiency potential and recent activities of high-efficiency solar cells. Journal of Materials Research. 2017, 32(18), 3445-57.
9. Yamaguchi, M.; Lee, KH.; Araki, K; Kojima, N.; Yamada, H.; Katsumata, Y.; Analysis for efficiency potential of high‐efficiency and next‐generation solar cells. Progress in Photovoltaics: Research and Applications. 2018, 26(8), 543-52.
10. Yamaguchi, M.;, Zhu, L.; Akiyama, H.; Kanemitsu, Y.; Tampo, H.; Shibata, H.; Lee, KH.; Araki, K.; Kojima, N.; Analysis of future generation solar cells and materials. Japanese Journal of Applied Physics. 2018 27;57(4S), 04FS03.
11. Yamaguchi, M.; Lee, KH.; Araki, K.; Kojima, N.; A review of recent progress in heterogeneous silicon multi-junction solar cells. Journal of Physics D: Applied Physics. 2018 2, 51(13), 133002.
12. Jackson, ED. Areas for improving of the semiconductor solar energy converter. Trans. Conf. on the Use of Solar Energy (University of Arizona Press, 1958), 1955, 5, 122–126.
13. Wolf, M. Limitations and possibilities for improvement of photovoltaic solar energy converters. Proc. Inst. Radio Engineers, 1960, 48, 1246–1263.
14. Hutchby, J. A.; Markunas, R. J.; Timmons, M. L.; Chiang, PK.; Bedair, S. M.; A review of multijunction concentrator solar cells. Proc. 18th IEEE Photovoltaic Specialists Conf. IEEE, New York, 1985, 20–27. 15. Ludowise, M. J.; LaRue, R. A.; Borden, P. G.; Gregory, P. E.; Dietz, W. T.; High-efficiency organometallic
vapor phase epitaxy AlGaAs/GaAs monolithic cascade solar cell using metal interconnects. Appl. Phys. Lett. 1982, 41, 550–552.
16. Flores, C.; A three-terminal double junction GaAs/GaAlAs cascade solar cells. IEEE Electron Device Lett. 1983, EDL–4, 96–99.
17. Chung, B. C.; Virshup, G. F.; Hikido, S.; Kaminar, N. R,; 27.6% efficiency (1 Sun, air mass 1.5) monolithic Al0.37 Ga0.63 As/GaAs two-junction cascade solar cell with prismatic cover glass. Appl. Phys. Lett. 1989, 55, 1741–1743.
18. Fan, JCC.; Tsaur, B. Y.; Palm, B. J.; Optical design of high-efficiency multi-junction cells. Proc. 16th IEEE Photovoltaic Specialists Conf., IEEE, New York, 1982, 692–701.
19. Yamaguchi, M.; Amano, C.; Sugiura, H.; Yamamoto, A.; High efficiency AlGaAs/GaAs multi-junction solar cells. Proc. 19th IEEE Photovoltaic Specialists Conf., IEEE, New York, 1987, 1484–1485.
20. Ando, K.; Amano, C.; Sugiura, H.; Yamaguchi, M.; Saletesm, A.; Non-radiative e-h recombination characteristics of mid-gap electron trap in AlxGa1–x As (x = 0.4) grown by molecular beam epitaxy. Jpn. J. Appl. Phys. 1987, 26, L266–L269.
21. Sugiura, H.; Amano, C.; Yamamoto, A.; Yamaguchi, M.; Double hetero¬structure GaAs tunnel junction for AlGaAs/GaAs multi-junction solar cells. Jpn. J. Appl. Phys. 1988, 27, 269–272.
22. Olson, J. M.; Kurtz, S. R.; Kibbler, A. E.; A 27.3% efficient Ga0.5In0.5P/ GaAs multi-junction solar cell. Appl. Phys. Lett. 1990, 56, 623–625.
23. Bertness, K. A.; Kurtz, S. R.; Friedman D. J.; Kibbler, A. E.; Kramer, C.; Olson, J. M.; 29.5%-efficiency GaInP/GaAs multi-junction solar cells. Appl. Phys. Lett. 1994, 65, 989–991.
24. Sasaki, K.; Agui, T.; Nakaido, K.; Takahashi, N.; Onitsuka, R.; Takamoto, T.; Development of InGaP/GaAs/InGaAs inverted triple junction concentrator solar cells. AIP Conference Proceedings, 2013, 1556, 22–25.
25. Chiu, PT.; Law, D. L.; Woo, R. L.; Singer, S.; Bhusari, D.; Hong, W. D.; Zakaria, A.; Boisvert, J. C.; Mesropian, S.; King, R. R.; Karam, N. H.; 35.8% space and 38.8% terrestrial 5J direct bonded cells. Proc. 40th IEEE Photovoltaic Specialist Conference, Denver, 2014, 11–13.
26. Yamaguchi, M.; Luque, L.; High efficiency and high concentration in photovoltaics. IEEE Trans. Electron Devices, 1999, 46, 2139–2144.
27. Swanson, R. M.; Photovoltaic concentrators. Luque A Hegedus S eds. Handbook of photovoltaic science and engineering. (Wiley), 2003, 449-503.
28. Philipps, S. P.; Bett, A. W.; Horowitz, K.; Kurtz, S.; Current status of concentrator photovoltaic (CPV) technology. Version 1.3. National Renewable Energy Lab. (NREL), 2017, 10-11.
30. Faine, P.; Kurtz, S. R.: Riordan, C.; Olson, J. M.; The influence of spectral solar irradiance variations on the performance of selected single-junction and multijunction solar cells. Solar cells. 1991 31(3), 259-78. 31. Kurtz, S. R.; Olson, J. M.; Faine, P.; The difference between standard and average efficiencies of
multijunction compared with single-junction concentrator cells. Solar Cells. 1991 30(1-4), 501-13.
32. Philipps, S. P.; Peharz, G.; Hoheisel, R.; Hornung, T.; Al-Abbadi, N. M.; Dimroth, F.; Bett, A. W.; Energy harvesting efficiency of III–V triple-junction concentrator solar cells under realistic spectral conditions. Solar Energy Materials and Solar Cells. 2010, 94(5), 869-77.
33. Kinsey, G. S.; Edmondson, K. M.; Spectral response and energy output of concentrator multijunction solar cells. Progress in Photovoltaics: Research and Applications. 2009, 17(5), 279-88.
34. Araki, K.; Emery, K.; Siefer, G.; Bett, A. W.; Sakakibara, T.; Kemmoku, Y.; Ekins-Daukes, N. J.; Lee, H. Ss; Yamaguchi, M.; Comparison of efficiency measurements for a HCPV module with 3J cells in 3 sites. InConference Record of the Thirty-first IEEE Photovoltaic Specialists Conference, 2005. 2005 Jan 3 , 846-849. 35. Lee, H. S.; Ekins-Daukes, N. J.; Araki, K.; Kemmoku, Y.; Yamaguchi, M.; Field test and analysis: the behavior of 3-J concentrator cells under the control of cell temperature. InConference Record of the Thirty-first IEEE Photovoltaic Specialists Conference, 2005. 2005 Jan 3, 754-757.
36. Al Husna, H.; Ota, Y.; Minemoto, T.; Nishioka, K.; Field test analysis of concentrator photovoltaic system focusing on average photon energy and temperature. Japanese Journal of Applied Physics. 2015 54(8S1), 08KE05.
37. Verlinden, P.J.; Lasich, J. B.; Energy rating of concentrator PV systems using multi-junction III–V solar cells. In2008 33rd IEEE Photovoltaic Specialists Conference 2008, 1-6.
38. Victoria, M.; Askins, S.; Nuñez, R.; Domínguez, C.; Herrero, R.; Antón, I.; Sala, G.; Ruíz, J. M.; Tuning the current ratio of a CPV system to maximize the energy harvesting in a particular location. AIP Conference Proceedings 2013, 1556, 1, 156-161.
39. Muller, M.; Marion, B.; Kurtz, S.; Rodriguez, J.; An investigation into spectral parameters as they impact CPV module performance. AIP conference proceedings 2010, 1277, 1, 307-311.
40. Domínguez, C.; Antón, I.; Sala, G.; Askins, S.; Current‐matching estimation for multijunction cells within a CPV module by means of component cells. Progress in Photovoltaics: Research and Applications. 2013, 21(7), 1478-88.
41. Núñez, R.; Jin, C.; Antón, I.; Sala, G.; Spectral classification of worldwide locations using SMR indexes. AIP Conference Proceedings 2016, 1766, 1, 090007.
42. Araki, K.; Yamaguchi, M.; Kondo, M.; Uozumi, H.; Which is the best number of junctions for solar cells under ever-changing terrestrial spectrum?. In3rd World Conference on Photovoltaic Energy Conversion, 2003, 1, 307-310.
43. Letay, G.; Baur, C.; Bett, A.; Theoretical investigations of III-V multi-junction concentrator cells under realistic spectral conditions. In19th European Photovoltaic Solar Energy Conference 2004, 7, 11.
44. Ekins-Daukes, N. J.; Betts, T. R.; Kemmoku, Y.; Araki, K.; Lee, H. S.; Gottschalg, R.; Boreland, M. B.; Infield, D. G.; Yamaguchi, M.; Syracuse-a multi-junction concentrator system computer model. Conference Record of the Thirty-first IEEE Photovoltaic Specialists Conference, 2005. 651-654.
45. Ekins-Daukes, N. J.; Kemmoku, Y.; Araki, K.; Betts, T. R.; Gottschalg, R.; Infield, D. G.; Yamaguchi, M.; The design specification for syracuse; a multi-junction concentrator system computer model. In 19th European Photovoltaic Solar Energy Conference. 2004.
46. Cameron, C.; Crawford, C.; Foresi, J.; King, D.; McConnell, R.; Riley, D.; Sahm, A.; Stein, J.; Performance Model Assessment for Multi‐Junction Concentrating Photovoltaic Systems. AIP Conference Proceedings 2010, 1277, 1, 290-293.
47. Araki, K.; Uozumi, H.; Kondo, M.; Takamoto, T.; Agui, T.; Kaneiwa, M.; Egami, T.; Hiramatsu, M.; Miyazaki, Y.; Kemmoku, Y.; Akisawa, A.; Development of a new 550/spl times/concentrator module with 3J cells-performance and reliability. Conference Record of the Thirty-first IEEE Photovoltaic Specialists Conference, 2005, 631-634.
48. Araki, K.; Yamaguchi, M.; Extended distributed model for analysis of non-ideal concentration operation. Solar energy materials and solar cells. 2003, 75(3-4), 467-73.
50. Garcia, I.; Algora, C.; Rey-Stolle, I.; Galiana, B.; Study of non-uniform light profiles on high concentration III–V solar cells using quasi-3D distributed models. 33rd IEEE Photovoltaic Specialists Conference 2008, 1-6.
51. Kurtz, S. R.; O'Neill, M. J.; Estimating and controlling chromatic aberration losses for junction, two-terminal devices in refractive concentrator systems. Conference Record of the Twenty Fifth IEEE Photovoltaic Specialists Conference, 1996, 361-364.
52. James, L. W. Effects of concentrator chromatic aberration on multi-junction cells. InProceedings of 1994 IEEE 1st World Conference on Photovoltaic Energy Conversion-WCPEC (A Joint Conference of PVSC, PVSEC and PSEC) 1994, 2, 1799-1802.
53. Rey-Stolle, I.; Algora, C.; García, I.; Baudrit, M.; Espinet, P.; Galiana, B.; Barrigón, E.; Simulating III–V concentrator solar cells: A comparison of advantages and limitations of lumped analytical models; distributed analytical models and numerical simulation. 34th IEEE Photovoltaic Specialists Conference (PVSC) 2009, 001622-001627.
54. Araki, K.; Kondo, M.; Uozumi, H.; Yamaguchi, M.; Experimental proof and theoretical analysis on effectiveness of passive homogenizers to 3J concentrator solar cells. Photovoltaic Energy Conversion, 2003. Proceedings of 3rd World Conference, 2003, 1, 853-856.
55. Araki, K.; Leutz, R.; Kondo, M.; Akisawa, A.; Kashiwagi, T.; Yamaguchi, M.; Development of a metal homogenizer for concentrator monolithic multi-junction-cells. Photovoltaic Specialists Conference, 2002. Conference Record of the Twenty-Ninth IEEE IEEE. 2002, 1572-1575.
56. Brown, A. S.; Green, M. A.; Radiative coupling as a means to reduce spectral mismatch in monolithic multi-junction solar cell stacks theoretical considerations. Conference Record of the Twenty-Ninth IEEE Photovoltaic Specialists Conference, 2002, 868-871.
57. Chan, N. L.; Young, T. B.; Brindley, H. E.; Ekins‐Daukes, N. J.; Araki, K.; Kemmoku, Y.; Yamaguchi, M.; Validation of energy prediction method for a concentrator photovoltaic module in Toyohashi Japan. Progress in Photovoltaics: Research and Applications. 2013 21(8), 1598-1610.
58. Chan, N. L.; Thomas, T.; Führer, M.; Ekins-Daukes, N. J.; Practical limits of multijunction solar cell performance enhancement from radiative coupling considering realistic spectral conditions. IEEE Journal of Photovoltaics. 2014 4(5), 1306-13.
59. Chan, N. L.; Brindley, H. E.; Ekins‐Daukes, N. J.; Impact of individual atmospheric parameters on CPV system power, energy yield and cost of energy. Progress in Photovoltaics: Research and Applications. 2014, 22(10), 1080-95.
60. Chan, N. L.; Young, T.; Brindley, H.; Chaudhuri, B.; Ekins-Daukes, N. J.; Variation in spectral irradiance and the consequences for multi-junction concentrator photovoltaic systems. 35th IEEE Photovoltaic Specialists Conference 2010, 003008-003012.
61. Araki, K.; Ota, Y.; Lee, K. H.; Nishioka, K.; Yamaguchi, M.; Optimization of the Partially Radiative-coupling Multi-junction Solar Cells Considering Fluctuation of Atmospheric Conditions. IEEE 7th World Conference on Photovoltaic Energy Conversion (WCPEC)(A Joint Conference of 45th IEEE PVSC, 28th PVSEC & 34th EU PVSEC) 2018, 1661-1666.
62. Araki, K.; Lee, K. H.; Kojima, N.; Yamaguchi, M.; SUPER-MULTIJUNCTION CELL, A NEW SOLAR CELL OVERCOMING THE SPECTRUM LOSS OF MULTIJUNCTION CELLS. Grand Renewable Energy proceedings Japan council for Renewable Energy 2018, 2018, 45.
63. Araki, K.; Lee, KH.; Yamaguchi, M.; Opportunities for breaking an energy generation limit of photovoltaic using multijunction and super-multijunction cells. 18th International Workshop on Junction Technology (IWJT) 2018, 1-4.
64. Araki, K.; Lee, KH.; Yamaguchi, M.; Risks and opportunities in challenging new bandgap materials for increasing number of junctions—Probability study. PVSEC-27, 2017.
65. Kayes, B. M.; Nie, H.; Twist, R.; Spruytte, S. G.; Reinhardt, F.; Kizilyalli, I. C.; Higashi, G. S.; 27.6% conversion efficiency, a new record for single-junction solar cells under 1 sun illumination. 37th IEEE Photovoltaic Specialists Conference, 2011, 000004-000008.
66. Schilling, C. L.; Hoehn, O.; Micha, D. N.; Heckelmann, S.; Klinger, V.; Oliva, E.; Glunz S. W.; Dimroth, F.; Combining photon recycling and concentrated illumination in a GaAs heterojunction solar cell. IEEE Journal of Photovoltaics, 2017, 8(1), 348-354.
68. Johnson, D. C.; Ballard, I. M.; Barnham, K. W. J.; Connolly, J. P. Mazzer, (2007). Observation of photon recycling in strain-balanced quantum well solar cells. Applied Physics Letters, 2007, 90(21), 213505. 69. Pazos-Outón, L. M.; Szumilo, M.; Lamboll, R.; Richter, J. M.; Crespo-Quesada, M.; Abdi-Jalebi, M.; Beeson
H. J.; Vrućinić M.; Alsari M.; Snaith H. J.; Ehrler B.; Friend R. H.; Deschler F.; Ehrler, B.; Photon recycling in lead iodide perovskite solar cells. Science, 2016, 351(6280), 1430-1433.
70. Sogabe, T.; Ogura; A., Hung C. Y.; Evstropov, V.; Mintairov, M.; Shvarts, M.; Okada, Y.; Experimental characterization and self-consistent modeling of luminescence coupling effect in III-V multijunction solar cells. Applied Physics Letters, 2013, 103(26), 263907.
71. Steiner, M. A.; Geisz, J. F.; Non-linear luminescent coupling in series-connected multijunction solar cells. Applied Physics Letters, 2012, 100(25), 251106.
72. Allen, C. R.; Lim, S. H.; Li, J. J.; Zhang, Y. H.; (2011, June). Simple method for determining luminescence coupling in multi-junction solar cells. In 2011 37th IEEE Photovoltaic Specialists Conference, 2011, 000452-000453).
73. Ota, Y/; Masuda, T.; Araki, K.; Yamaguchi, M.; A mobile multipyranometer array for the assessment of solar irradiance incident on a photovoltaic-powered vehicle. Solar Energy. 2019, 184, 84-90.
74. Ota, Y.; Nishioka, K.; Araki, K.; Ikeda, K.; Lee, KH.; Yamaguchi, M.; Optimization of static concentrator photovoltaics with aspherical lens for automobile. IEEE 43rd Photovoltaic Specialists Conference (PVSC), 2016, 0570-0573.
75. Araki, K.; Ota, Y.; Ikeda, K.; Lee, KH.; Nishioka, K.; Yamaguchi, M.; Possibility of static low concentrator PV optimized for vehicle installation. AIP Conference Proceedings 2016, 1766, 1, 020001.
76. Araki, K.; Nagai, H.; Yamaguchi, M.; Possibility of solar station to EV. AIP Conference Proceedings, 2016, 1766, 1, 080001.
77. Schuss, C.; Gall, H.; Eberhart, K, Illko, H.; Eichberger, B.; Alignment and interconnection of photovoltaics on electric and hybrid electric vehicles. In2014 IEEE International Instrumentation and Measurement Technology Conference (I2MTC) Proceedings 2014, 153-158.
78. Schuss, C.; Eichberger, B.; Rahkonen, T.; Impact of sampling interval on the accuracy of estimating the amount of solar energy. IEEE International Instrumentation and Measurement Technology Conference Proceedings, 2016, 1-6.
79. Yamaguchi, M.; Lee, KH.; Araki, K.; Kojima, N.; Yamada, H.; Katsumata, Y.; Analysis for efficiency potential of high‐efficiency and next‐generation solar cells. Progress in Photovoltaics: Research and Applications. 2018, 26(8), 543-52.
80. Sato, D.; Lee, KH.; Araki, K.; Masuda, T.; Yamaguchi, M.; Yamada, N.; Design of low‐concentration static III‐V/Si partial CPV module with 27.3% annual efficiency for car‐roof application. Progress in Photovoltaics: Research and Applications. 2019.
81. Sato, D.; Lee, KH.; Araki, K.; Masuda, T.; Yamaguchi, M.; Yamada, N.; Design and Evaluation of Low-concentration Static III-V/Si Partial CPV Module for Car-rooftop Application. IEEE 7th World Conference on Photovoltaic Energy Conversion (WCPEC)(A Joint Conference of 45th IEEE PVSC, 28th PVSEC & 34th EU PVSEC) 2018, 0954-0957.
82. Masuda, T.; Araki, K.; Okumura, K.; Urabe, S.; Kudo, Y.; Kimura, K.; Nakado, T.; Sato, A.; Yamaguchi, M.; Next environment-friendly cars: Application of solar power as automobile energy source. In2016 IEEE 43rd Photovoltaic Specialists Conference (PVSC), 2016, 0580-0584.
83. Araki, K.; Algora, C.; Siefer, G.; Nishioka, K.; Leutz, R.; Carter, S.; Wang, S.; Askins, S.; Ji L.; Kelly, G.; Standardization of the CPV and car-roof PV technology in 2018–Where are we going to go?. AIP Conference Proceedings, 2018, 2012, 1, 070001.
84. Araki, K.; Algora, C.; Siefer, G.; NIshioka, K.; Muller, M.; Leutz, R.; Carter, S.; Wang, S.; Askins, S.; Ji, L.; Kelly, G.; TOWARD STANDARDIZATION OF SOLAR TRACKERS, CONCENTRATOR PV, AND CAR-ROOF PV. Grand Renewable Energy proceedings Japan council for Renewable Energy 2018 , 2018, 37. 85. Araki, K.; Lee, KH.; Yamaguchi, M.; The possibility of the static LCPV to mechanical-stack III-V//Si module.
AIP Conference Proceedings, 2018 , 2012, 1, 090002.
86. Araki, K.; Algora, C.; Siefer, G.; NIshioka, K.; Muller, M.; Leutz, R.; Carter, S.; Wang, S.; Askins, S.; Ji, L.; Kelly, G.; TOWARD STANDARDIZATION OF SOLAR TRACKERS, CONCENTRATOR PV, AND CAR-ROOF PV. Grand Renewable Energy proceedings Japan council for Renewable Energy 2018 , 2018, 37. 87. Ota, Y.; Masuda, T.; Araki, K.; Yamaguchi, M.; Curve-correction factor for characterization of the output of
![Figure 2. Flow-chart of its performance calculation using the Monte Carlo method [61]](https://thumb-us.123doks.com/thumbv2/123dok_us/7958416.1320345/5.595.178.428.89.271/figure-flow-chart-performance-calculation-monte-carlo-method.webp)
![Figure 6. Comparison between the measured and modeled seasonal trend of the performance of the PV module using multi-junction solar cells [100]](https://thumb-us.123doks.com/thumbv2/123dok_us/7958416.1320345/8.595.85.505.171.386/figure-comparison-measured-modeled-seasonal-performance-module-junction.webp)
![Figure 7. Recovery of the spectrum mismatching loss due to water absorption in summer by enhancing the ratio of luminescence coupling between the middle junction and the bottom junction, added and modified from the original chart in [101]](https://thumb-us.123doks.com/thumbv2/123dok_us/7958416.1320345/9.595.122.469.105.315/recovery-spectrum-mismatching-absorption-enhancing-luminescence-coupling-original.webp)