1
Investigation Outcomes Of IR Protocol Using Data Mining In
Cloud
1
Dr. Sateesh Nagavarapu,
2S. Pavan Kumar Reddy
Associate professor,Assistant professorComputer Science and Engineering
Malla Reddy Institute of Technology Secunderabad, India [email protected],[email protected]
Abstract:According to the experiment results, the IR technology utilized during this analysis is during a position to retrieve the required knowledge properly. The scholar t-test analysis is applied to examine the excellence between amount increase rate of IR and full processing system. Analysis result shows that the amount increases rate of IR and full processing system unit similar. Additionally, the relationships among IR, processing system and dataset size has been discovered exploitation statistical method. The results to boot shows that IR is economical whereas encrypting little dataset, however, with the enlargement of dataset, the IR amount will endlessly increase, and might eventually represent ninety exploit the full processing system amount. Therefore, the IR protocol we've an inclination to chosen throughout this analysis is not applicable for processing with large datasets.
Keywords: IR protocol, data mining datasets.
1. INTRODUCTION
The experiments will run on VMware with Ubuntu 13.04 package place in. the weather used within the system along with processing rule, platform and framework are measure mentioned previously. Although accuracy of classification and prediction is one in every of the foremost important choices in processing, these will not be tested throughout this analysis as a results of the project focuses on evaluating IR performance. The system just performs processing as a task. So, an easy secret writing has been embedded among the appliance to examine whether or not or not the system has extracted the records plain. The rule and IR technology were implemented among the info process system. The next section describes but the experiments were designed and evaluated.
First, a dataset with two columns and thousand rows was created by the package R. each column among the dataset contains one float selection. Nine totally different datasets were created following identical procedure but each new dataset had an additional thousand rows, yielding 10 datasets with rows ranging from thousand to ten thousand. Then the datasets were uploaded to the HDFS and ready for analyzing by Apache driver. Before the knowledge mining system analyzed the datasets, code was inserted among the program to record the quantity and store the first five processing ends up in the data. Once the knowledge mining starts and IR protocol encrypts the data, the corresponding contents (or processing results) square measure planning to be retrieved, decoded and compared with the hold on five parts. This might facilitate North yank nation examine the accuracy of the results. The knowledge mining system is run doubly, first whereas not then with IR protocol. The method
times were came and recorded for analysis. Sequential step consists of two experiments. The first experiment was designed to assemble the knowledge} which is able to be later accustomed verify the accuracy (whether the applying has extracted the right knowledge from the database). Although IR is supposed to jot down in code and retrieve the knowledge safely and properly, there is no relevant analysis to acknowledge the accuracy of the retrieval of the required knowledge. Thus each dataset are measure planning to be processed 10 times and so the typical error rate square measure planning to be calculated. The second experiment was to gather knowledge regarding the applying method speed. Among the program, the amount of running IR and running the complete program was recorded and written out. Since the pass on times was utterly totally different whenever the task finished, each dataset was run thirty times to eliminate outliers. throughout this analysis, the results of your time interval of every IR and overall system unit of measurement collected to be evaluated by a t-test thus on spot whether or not or not IR quantity and overall quantity unit of measurement correlate and similar. T-test analysis methodologies are going to be planning to be applied throughout this step. Put together the straight forward regression in R are going to be applied to go looking out the affiliation among total quantity, IR quantity with changes to the dataset size.
2. RESEARCH FINDINGS AND RESULTS
t-2
test to identify the similarity of the two method times. to boot, methodology is applied to the data mining method to identify the increase rate of IR interval and compare with the data mining system interval thus on forecast on the use of differing dataset sizes and to see, to what extent IR will hinder processing beneath cloud computing atmosphere.
2.1. Experiment 1 Findings
This experiment is meant to spot whether or not IR will encipher the knowledge and retrieve it properly. 10 datasets whose size ranges from a thousand to ten thousand, in increments of a thousand, are utilized in this experiment. The datasets utilized in this experiment are generated by R and follow a traditional distribution.
Test umber Dataset size Number of errors
1 1000 0
2 2000 0
3 3000 0
4 4000 0
5 5000 0
6 6000 0
7 7000 0
8 8000 0
9 9000 0
[image:2.612.52.543.492.625.2]10 10000 0
Table 2.1 IR Reliability According to the results of the 10 experiments shown in Table a pair of.1, the typical IR error rate is zero you which ones suggests that all info is properly retrieved by IR. With a slip-up rate of third, we have a tendency to see that IR is in a position to with efficiency encipher, decode and retrieve needed info with larger dataset sizes, even as well because it handles smaller datasets like a thousand records. This experiment shows that the IR utilized in this project will encipher and decode info with success.
2.2. Experiment 2 Findings
In this experiment, every datasets is run twenty five times; t-test doesn't need a minimum sample size and therefore the most range of your time the experiment is
run, given constraints within the atmosphere setup is twenty five. The period for IR and for the complete data mining process are collected and evaluated to live the modified rates of IR and data processing c4.5 formula method. The elaborate interval results of IR and total data mining process by exploitation these 10 datasets are illustrated.
Once the interval is collected, consequent step is to use this info to calculate the increate rate of interval so as to seek out the connection between the IR and data mining process C4.5 formula. Exploitation the experiment results mentioned on top of and R, the rise rates is simply calculated.
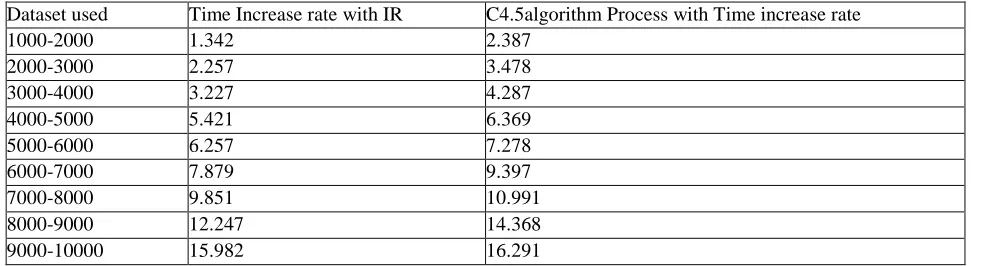
Dataset used Time Increase rate with IR C4.5algorithm Process with Time increase rate 1000-2000 1.342 2.387
2000-3000 2.257 3.478 3000-4000 3.227 4.287 4000-5000 5.421 6.369 5000-6000 6.257 7.278 6000-7000 7.879 9.397 7000-8000 9.851 10.991 8000-9000 12.247 14.368 9000-10000 15.982 16.291
Table 2.2 Increase Rate of Processing Time using C4.5 algorithm According to table a 2.2, the rise rate of IR and total
data mining process each grow with increasing dataset size. The time increase rate of IR and total data processing c4.5 formula method are similar. The time increase rate of total data mining process is slightly above IR’s.
2.3. Experiment 3 Findings
3
evaluated to live the modified rates of IR and data mining process. The elaborate interval results of IR and total data mining process by exploitation these 10 datasets are illustrated.
Once the interval is collected, consequent step is to use
this info to calculate the increate rate of interval so as to seek out the connection between the IR and data mining process c5.0 formula. Exploitation the experiment results mentioned on top of and R, the rise rates is simply calculated.
Dataset used Time Increase rate with IR c5.0algorithm Process with Time increase rate 1000-2000 2.254 3.259
[image:3.612.52.539.139.274.2]2000-3000 2.748 3.934 3000-4000 3.847 5.681 4000-5000 4.386 6.367 5000-6000 5.756 8.317 6000-7000 6.886 9.194 7000-8000 8.667 10.284 8000-9000 10.247 12.397 9000-10000 14.359 15.621
Table 2.3 Increase Rate of Processing Time using c5.0 algorithm According to table 2.3, the rise rate of IR and total data
mining process each grow with increasing dataset size. The time increase rate of IR and total data processing c5.0 formula method are similar. The time increase rate of total data mining is slightly above IR’s.
2.4. Experiment 4 Findings
In this experiment, every datasets is run 25 times; t-test doesn't need a minimum sample size and therefore the most range of your time the experiment is run, given constraints within the atmosphere setup is 25. The period for IR and for the complete data mining k-mean formula method are collected and evaluated to live the
modified rates of IR and data processing process. The elaborate interval results of IR and total data mining process by exploitation these 10 datasets are illustrated. Once the interval is collected, consequent step is to use this info to calculate the increate rate of interval so as to seek out the connection between the IR and data mining k-mean formula process. Exploitation the experiment results mentioned on top of and R, the rise rates is simply calculated.
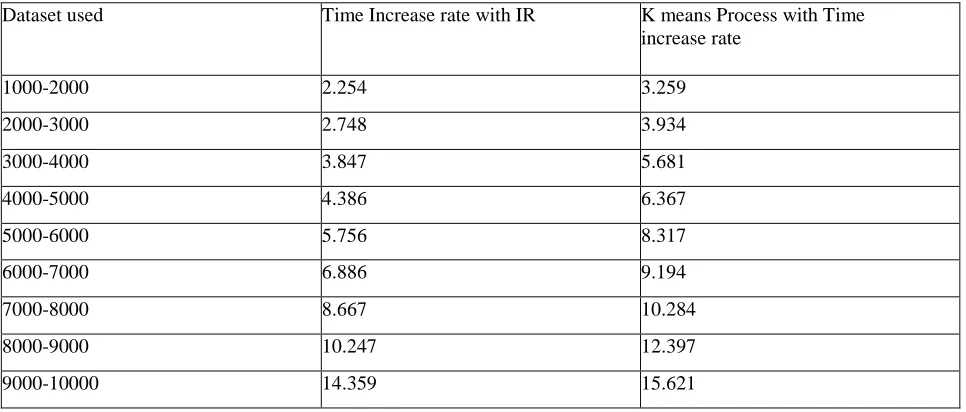
Dataset used Time Increase rate with IR K means Process with Time increase rate
1000-2000 2.254 3.259
2000-3000 2.748 3.934
3000-4000 3.847 5.681
4000-5000 4.386 6.367
5000-6000 5.756 8.317
6000-7000 6.886 9.194
7000-8000 8.667 10.284
8000-9000 10.247 12.397 9000-10000 14.359 15.621
[image:3.612.68.551.444.650.2]4
According to table 2.4, the rise rate of IR and total data mining process each grow with increasing dataset size. The time increase rate of IR and total data mining process are similar. The time increase rate of total data mining process is slightly above IR’s.
3. RELATIONSHIP BETWEEN PROCESSING
TIME AND DATASET SIZE
Linear regression was wont to investigate the principally increasing time dotty IR with increasing dataset size. To start with, the main focus is on the relationships among IR interval, entire data processing system interval and dataset size. during this analysis, the
interval of each IR and full data processing system with completely different datasets, that vary from a thousand to ten thousand in increments of a thousand, area unit concerned to search out the relationships.
3..1. Relationship Between IR Processing Time And Dataset Size
In this section, straightforward regression is employed to spot the connection between IR interval and dataset size. First, knowledge together with IR interval and relevant dataset size is hold on in R atmosphere and so 2 lines of code are dead to use straightforward regression analyzing the information and generate report by R:
IRSize <- lm(IR~Size, data=sumIRresults) Summary(IRSize) The report on the following page (Table 3.1) gives the findings. Call:
lm(formula = IR ~ Size, data = sumIR results) Residuals:
Min 1Q Median 3Q Max
-49850 -7239 -1820 8285 81224
Coefficients:
Estimate Std. Error t value Pr(>|t|)
(Intercept) 2.973e+03 1.238e+02 24.02 <2e-16 *** Size 8.549e+00 3.003e-01 28.47 <2e-16 ***
---
Signif. codes: 0 ****0.001 ***0.01 **0.05**0.1 **1
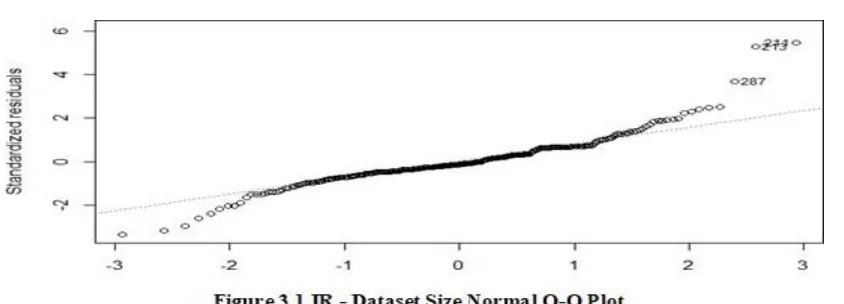
[image:4.612.101.523.545.697.2]Residual standard error: 14940 on 298 degrees of freedom Multiple R-squared: 0.7312, Adjusted R- squared: 0.7303 F-statistic: 810.7 on 1 and 298 DF, p-value: < 2.2e-16
Table 3.1 Simple Linear Regression Results According to the report, the increase rate of IR is 8.549, and the formula is:
5
The normal Q-Q plot shows that the points lie on a line which implies these to variables are correlative. So this model is with success known the link between IR time interval and dataset size.
In order to match IR and full data processing system time interval and conclude that one grows quicker, the link between entire data processing system time interval and dataset size is needed. Therefore the next step is to use a similar methodology to analyze the info and determine the link.
3.2. Relationship Between Entire Data Mining System Processing Time And Dataset Size
Although the info mining system interval is vary from the machines running the system and algorithms, it's still necessary to spot the system interval rate of growth and compare with IR interval rate of growth during this project.
The data mining interval experiments square measure same as IR’s, two easy lines of code are run to analyse the data:
TotalSize <- lm(Total~Size, data=sum IR results) Summary(TotalSize) The report on the following page (Table 5.5) gives the findings. Call:
lm(formula = Total ~ Size, data = sum IR results) Residuals:
Min 1Q Median 3Q Max
-51055 -7904 -1919 7394 88455 Coefficients:
Estimate Std. Error t value Pr(>|t|)
(Intercept) 1.860e+03 1.630e+02 11.41 <2e-16 *** Size 8.6407 0.3224 26.802 <2e-16 ***
---
Signif. codes: 0 ****0.001 ***0.01 **0.05 **0.1 **1
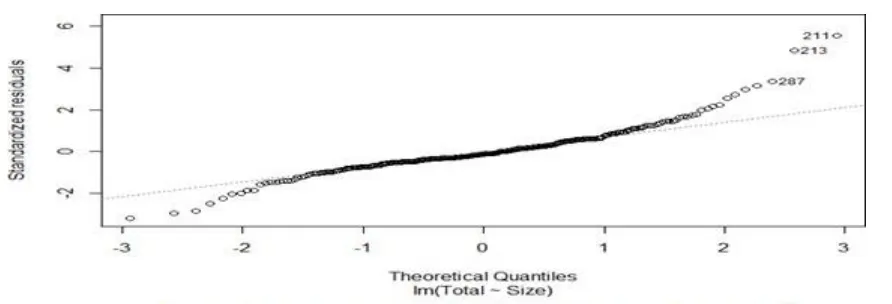
[image:5.612.66.535.250.395.2]Residual standard error: 16040 on 298 degrees of freedom Multiple R-squared: 0.7068, Adjusted R- squared: 0.7058 F-statistic: 718.3 on 1 and 298 DF, p-value: < 2.2e-16
Table 3.2 Simple Linear Regression
Table 3. 2 shows that the increase rate of entire data mining process is 8.6407, and the formula is: Total= 1.860e3 + Datasize *
8.6407 (3.2)
The normal Q-Q plot shows that the points lie on a line which suggests that the info mining interval and dataset size are related to.
By scrutiny the 2 equations, it may be seen that the IR and whole data processing system have similar interval
increase rate whereas entire data processing system is slightly quicker than IR’s.
[image:5.612.79.525.504.656.2]6
298 degrees of freedom severally, which suggests that the equations might not accurately predict the expansion rate of data mining system. Thus, the link between IR and data processing system interval is required.
4. CONCLUSION
In this thesis, the importance of victimization writing to secure processing system at a lower place cloud atmosphere has been reviewed and mentioned. a doable internal security issue has collectively been identified; staff in operation for cloud vendors like DBAs or data analysts have certain privileges to access data in info therefore, have access to sensitive information like consumer information and so the potential to leak such data. Therefore, to influence these issues, a solution, the cSIR protocol, was trialed to eliminate the matter. We have a tendency to tend to successfully combined Apache driver, Apache Hadoop and IR protocol on and commenced the atmosphere for analysis. We have a tendency to tend to successfully collect the interval of IR and overall processing system. T-test and regression were applied to analyze the data. The link between the increase rate of IR and overall system has been successfully legendary.
REFERENCE
[1] Gill, G. S., Wadhwa, A., & Jatain, A. (2014). Cloud Computing: A New Age of Computing. Paper presented at the Advanced Computing & Communication Technologies (ACCT), 2014 Fourth International Conference.
[2] Greenberg, B., & Voshell, L. (1990). Relating risk of disclosure for microdata and geographic area size. Paper presented at the Proceedings of the Section on Survey Research Methods, American Statistical Association.
[3] Grossman, R., & Gu, Y. (2008). Data mining using high performance data clouds: experimental studies using sector and sphere. Paper presented at the Proceedings of the 14th ACM SIGKDD international conference on Knowledge discovery and data mining. [4] Dr. Arvind K Sharma ,Sateesh Nagavarapu International Journal of Advanced Scientific Technologies in Engineering and Management Sciences (IJASTEMS-ISSN: 2454-356X)
Volume.3,Issue.9,September.2017
[5] Hall, M., Frank, E., Holmes, G., Pfahringer, B., Reutemann, P., & Witten, I. H. (2009). The WEKA data mining software: an update. ACM SIGKDD explorations newsletter, 11(1), 10-18.
[6] Henry, R., Huang, Y., & Goldberg, I. (2013). One (Block) Size Fits All: IR and SIR over Arbitrary- Length Records via Multi-block PIR Queries. Paper presented at the 20th Network and Distributed System Security Symposium.
[7] Hickey, A. R. (2011). 100 Coolest Cloud Computing Vendors. CRN(1307), 32-48.Hoffman, S. (2010).
Coolest Cloud Security Vendors. CRN(1293), 30-n/a. [8] Honarkhah, M., & Caers, J. (2010). Stochastic
simulation of patterns using distance-based pattern modeling. Mathematical Geosciences, 42(5), 487-517.
[9] Hoover, J. (2009). Japan hopes IT investment, private cloud will spur economic recovery: The Kasumigaseki Cloud is part of a larger government project that's expected to create 300,000to400,000 ewjobswithinthreeyears.InformationWeek.
[10] Sateesh Nagavarapu et al, International Journal of Computer Science & Communication Networks,Vol 7(4),124-127 IJCSCN | August-September 2017 . [11] Halash, E. A. (2010). Mobile Cloud Computing: Case
Studies.
[12] Leon, M., & Vadlamudi, P. (1996). Data warehouse vendors do data mining. InfoWorld, 18(24), 39. Li, L., Militzer, M., & Datta, A. (2014). rPIR: Ramp Secret.
[13] Kareem, I. A., & Duaimi, M. G. (2014). Improved Accuracy for Decision Tree Algorithm Based on Unsupervised Discretization.
[14] Walunj, S. G., & Sadafale, K. (2013). An online recommendation system for e-commerce based on apache mahout framework. Paper presented at the Proceedings of the 2013 annual conference on Computers and people research.
[15] Wikipedia. (2014). Comparison of platform virtualization software. Retrieved 10/10, 2014, from http://en.wikipedia.org/wiki/Comparison_of_platfor m_virtualization_software.