Log-linear weight optimisation via Bayesian Adaptation in Statistical
Machine Translation
Germ´an Sanchis-Trilles and Francisco Casacuberta
Departamento de Sistemas Inform´aticos y Computaci´on Instituto Tecnol´ogico de Inform´atica
Universidad Polit´ecnica de Valencia {gsanchis,fcn}@dsic.upv.es
Abstract
We present an adaptation technique for statistical machine translation, which ap-plies the well-known Bayesian learning paradigm for adapting the model param-eters. Since state-of-the-art statistical ma-chine translation systems model the trans-lation process as a log-linear combination of simpler models, we present the formal derivation of how to apply such paradigm to the weights of the log-linear combina-tion. We show empirical results in which a small amount of adaptation data is able to improve both the non-adapted system and a system which optimises the above-mentioned weights on the adaptation set only, while gaining both in reliability and speed.
1 Introduction
The adaptation problem is a very common issue in statistical machine translation (SMT), where it is frequent to have very large collections of bilingual data belonging to e.g. proceedings from interna-tional entities such as the European Parliament or the United Nations. However, if we are currently interested in translating e.g. printer manuals or news data, we will need to find a way in which we can take advantage of such data.
The grounds of modern SMT were established in (Brown et al., 1993), where the machine trans-lation problem was defined as follows: given a sentence f from a certain source language, an equivalent sentence ˆein a given target language that maximises the posterior probability is to be found. According to the Bayes decision rule, such
statement can be specified as follows:
ˆ
e = argmax
e Pr(e|f) (1)
Recently, a direct modelling of the posterior probabilityPr(e|f)has been widely adopted, and, to this purpose, different authors (Papineni et al., 1998; Och and Ney, 2002) proposed the use of the so-called log-linear models, where
p(e|f) = exp
PK
k=1λkhk(f,e)
P
e0expPKk=1λkhk(f,e0) (2)
and the decision rule is given by the expression
ˆ
e=argmax e
K
X
k=1
λkhk(f,e) (3)
wherehk(f,e)is a score function representing an important feature for the translation offintoe, as for example the language model of the target lan-guage, a reordering model or several translation models. K is the number of models (or features)
andλkare the weights of the log-linear combina-tion. Typically, the weightsΛ = [λ1, . . . , λK]T are optimised with the use of a development set.
from scratch only on the adaptation data. How-ever, such re-estimation may not be a good idea, whenever the amount of adaptation data available is not too big. On the one hand, because small amounts of adaptation data may easily yield over-trained values of Λ, which may even lead to a degradation of the translation quality. On the other hand, because in some scenarios it is not feasible to re-estimate them because of the time it would take. Moreover, considering a re-estimation of Λ by using both the out-of-domain data and the adaptation set would not be appropriate either. For small amounts of adaptation data, such data would have no impact on the final value of Λ, and the time required would be even higher. One such situation may be the Interactive Machine Trans-lation (IMT) paradigm (Barrachina et al., 2009), in which a human translator may start translating a new document, belonging to a specific domain, and the system is required to produce an appro-priate output as soon as possible without any prior re-training.
In this paper, a Bayesian adaptation approach solving both problems is presented. Nevertheless, adapting Λ constitutes just a first step towards the adaptation of all the parameters of the SMT model.
The rest of this paper is structured as follows. In next Section, we perform a brief review of current approaches to adaptation and Bayesian learning in SMT. Section 3 describes the typical framework for phrase-based translation in SMT. In Section 4, we present the way in which we apply Bayesian adaptation (BA) to log-linear models in SMT. In Section 5, we describe the practical approxima-tions applied before implementing the BA tech-nique described. In Section 6, experimental de-sign and results are detailed. Conclusions and fu-ture work are explained in Section 7.
2 Related work
Adaptation in SMT is a research field that is re-ceiving an increasing amount of attention. In (Nepveu et al., 2004), adaptation techniques were applied to IMT, following the ideas by (Kuhn and Mori, 1990) and adding cache language mod-els (LM) and TMs to their system. In (Koehn and Schroeder, 2007), different ways to combine
available data belonging to two different sources was explored; in (Bertoldi and Federico, 2009) similar experiments were performed, but consid-ering only additional source data. In (Civera and Juan, 2007), alignment model mixtures were ex-plored as a way of performing topic-specific adap-tation. Other authors (Zhao et al., 2004; Sanchis-Trilles et al., 2009), have proposed the use of clus-tering in order to extract sub-domains of a large parallel corpus and build more specific LMs and TMs, which are re-combined in test time.
With respect to BA in SMT, the authors are not aware of any work up to the date that follows such paradigm. Nevertheless, there have been some re-cent approaches towards dealing with SMT from the Bayesian learning point of view. In (Zhang et al., 2008), Bayesian learning was applied for estimating word-alignments within a synchronous grammar.
3 Phrase-based SMT
One of the most popular instantiations of log-linear models in SMT are phrase-based (PB) mod-els (Zens et al., 2002; Koehn et al., 2003). PB models allow to capture contextual information to learn translations for whole phrases instead of sin-gle words. The basic idea of PB translation is to segment the source sentence into phrases, then to translate each source phrase into a target phrase, and finally reorder the translated target phrases in order to compose the target sentence. For this purpose, phrase-tables are produced, in which a source phrase is listed together with several tar-get phrases and the probability of translating the former into the latter. PB models were employed throughout this work.
Typically, the weights of the log-linear com-bination in Equation 3 are optimised by means of Minimum Error Rate Training (MERT) (Och, 2003). Such algorithm consists of two basic steps. First,n-best hypotheses are extracted for each one
of the sentences of a given development set. Next, the optimumΛ is computed so that the best hy-potheses in then-best list, according to a reference
translation and a given metric, are ranked higher within such n-best list. These two steps are
re-peated until convergence.
one hand, that it heavily relies on having a fair amount of data available as development set. On the other hand, that it only relies on the data in the development set. These two problems have as consequence that, if the development set made available to the system is not big enough, MERT will most likely become unstable and fail in ob-taining an appropriate weight vectorΛ.
However, it is quite common to have a great amount of data available in a given domain, but only a small amount from the specific domain we are interested in translating. Precisely this sce-nario is appropriate for BA: under this paradigm, the weight vector Λ is biased towards the opti-mal one according to the adaptation set, while avoiding over-training towards such set by not forgetting the generality provided by the training set. Furthermore, recomputing Λ from scratch by means of MERT may imply a computational overhead which may not be acceptable in certain environments, such as SMT systems configured for online translation, IMT or Computer Assisted Translation, in which the final human user is wait-ing for the translations to be produced.
4 Bayesian adaptation for SMT
The main idea behind Bayesian learning (Duda et al., 2001; Bishop, 2006) is that model parameters are viewed as random variables having some kind of a priori distribution. Observing these random variables leads to a posterior density, which typi-cally peaks at the optimal values of these parame-ters. Following the notation in Equation 1, previ-ous statement is specified as
p(e|f;T) =
Z
p(e, θ|f;T)dθ (4)
whereT represents the complete training set and
θare the model parameters.
However, since we are interested in Bayesian adaptation, we need to consider one training set
T and one adaptation setA, leading to
p(e|f;T, A)≈
Z
p(θ|T, A)p(e|f, θ)dθ (5)
In Equation 5, the integral over the complete para-metric space forces the model to take into account
all possible values of the model parameters, al-though the prior over the parameters implies that our model will prefer parameter values which are closer to our prior knowledge. Two assumptions have been made: first, that the output sentencee only depends on the model parameters (and not on the complete training and adaptation data). Sec-ond, that the model parameters do not depend on the actual input sentencef. Such simplifica-tions lead to a decomposition of the integral in two parts: the first one,p(θ|T, A)will assess how good the current model parameters are, and the second one,p(e|f, θ), will account for the quality of the translation e given the current model pa-rameters.
Then, the decision rule given in Equation 1 is redefined as
ˆ
e=argmax
e Pr(e|f;T, A) (6) Operating with the probability ofθ, we obtain:
p(θ|T, A) = Rp(A|θ;T)p(θ|T)
p(A|θ)p(θ|T)dθ (7)
p(A|θ;T) = Y
∀a∈A
p(fa|θ)p(ea|fa, θ) (8)
where the probability of the adaptation data has been assumed to be independent of the training data and has been modelled as the probability of each bilingual sample(fa,ea) ∈ A being gener-ated by our translation model.
Assuming that the model parameters depend on the training data and follow a normal distribution, we obtain
p(θ|T) = 1 (2π)d/2exp
−1 2(θ−θT)
T(θ−θ T)
(9)
whereθT is the set of parameters estimated on the training set and the variance has been assumed to be bounded for all parameters.dis the
dimension-ality ofθ.
Lastly, assuming that our translation model is a log-linear model as described in Equation 3 and that the only parameters we want to adapt are the log-linear weights:
p(e|f, θ) = exp
P
kλkfk(f,e)
P
where the model parametersθhave been
instanti-ated to include only the log-linear weightsΛ. Finally, combining Equations 8, 9 and 10, and considering only as model parameters the log-linear weights, we obtain:
p(e|f;T,A) =Z
Z
p(A|Λ;T)p(Λ|T)p(e|f,Λ)dΛ
=ZZ Y ∀a∈A
expPkλkfk(fa,ea)
P
e0expPkλkfk(fa,e0)·
exp
−1
2(Λ−ΛT)
T(Λ−Λ T)
·
expPkλkfk(f,e)
P
e0expPkλkfk(f,e0)
dΛ (11)
whereZ is the denominator present in the previ-ous equation and may be factored out because it does not depend on the integration variable. It has also been assumed thatp(fa|θ)is uniform and can also be factored out.
5 Practical approximations
Although the integral described in Equation 11 is the right thing to do from the theoretical point of view, there are several issues which need to be treated first before implementing it.
Since computing the integral over the complete parametric space is computationally impossible in the case of SMT, we decided to perform a Monte Carlo like sampling of these parameters by assum-ing that the parameters follow a normal distribu-tion centred in ΛT, the weight vector obtained from the training data. This sampling was done by choosing alternatively only one of the weights inΛT, modifying it randomly within a given inter-val, and re-normalising accordingly. Equation 11 is approximated in practise as
p(e|f;T, A) = X
Λm∈M C(ΛT)
p(A|Λ;T)p(Λ|T)p(e|f,Λ)
whereM C(ΛT)is the set ofΛm weights gener-ated by the above-mentioned procedure.
There is still one issue when trying to imple-ment Equation 11. The denominator within the components p(A|Λ;T) and p(e|f,Λ) contains a sum over all possible sentences of the target lan-guage, which is not computable. For this reason,
P
e0 is approximated as the sum over all the
hy-pothesis within a givenn-best list. Moreover,
in-stead of performing a full search of the best pos-sible translation of a given input sentence, we will perform a rerank of then-best list provided by the
decoder according to Equation 11.
Typical state-of-the-art PB SMT systems do not guarantee complete coverage of all possible sen-tence pairs due to the great number of heuris-tic decisions involved in the estimation of the translation models. Moreover, out-of-vocabulary words may imply that the SMT model is unable to explain a certain bilingual sentence completely. Hence,p(A|Λ;T)is approximated as
p(A|Λ;T)≈Y
∀a∈A
expPkλkfk(fa,e∗a)
P
e0expPkλkfk(fa,e0) (12)
wheree∗represents the best hypothesis the search algorithm is able to produce, according to a given translation quality measure. As in Equation 11,
p(fa|θ)has been assumed uniform.
Once the normalisation factor within Equa-tion 7 has been removed, and the above-mentioned approximations have been introduced,
p(e|f;T, A)is no longer a probability. This fact cannot be underestimated, since it means that the terms p(A|Λ;T) and p(e|f,Λ) on the one hand, andp(Λ|T)on the other, may have very different numeric ranges. For this reason, and in order to weaken the influence of this fact, we introduce a leveraging termδ, such that
p(e|f;T, A) =
X
Λm∈M C(ΛT)
(p(A|Λ;T)p(e|f,Λ))1δ p(Λ|T)(13)
Although there are other, more standard, ways of adding this leveraging term, we chose this one for numeric reasons.
6 Experiments 6.1 Experimental setup
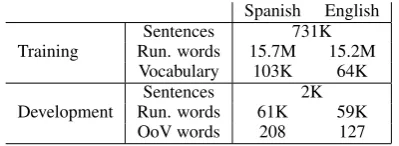
Spanish English Training Run. wordsSentences 15.7M731K15.2M
Vocabulary 103K 64K
Development Run. wordsSentences 61K 2K 59K
[image:5.595.81.281.70.143.2]OoV words 208 127
Table 1: Main figures of the Europarl corpus.OoV stands for Out of Vocabulary. K/M stands for thousands/millions of elements.
Spanish English
[image:5.595.88.273.185.258.2]Test 2008 Run. wordsSentences 50K205153K OoV. words 1247 1201 Test 2010 Run. wordsSentences 62K248966K OoV. words 1698 1607 Table 2: Main figures of the News-Commentary test sets.OoVstands for Out of Vocabulary words with respect to the Europarl corpus.
computes the minimum number of edits required to modify the system hypotheses so that they match the references. Possible edits include in-sertion, deletion, substitution of single words and shifts of word sequences.
For computinge∗as described in Equation 12, TER was used, since BLEU implements a geo-metrical average which is zero whenever there is no common 4-gram between reference and hy-pothesis. Hence, it is not well suited for our pur-poses since the complete set ofn-best candidates provided by the decoder can score zero.
As a first baseline system, we trained a SMT system on the Europarl Spanish–English training data, in the partition established in the Workshop on SMT of the NAACL 2006 (Koehn and Monz, 2006), using the training and development data provided that year. The Europarl corpus (Koehn, 2005) is built from the transcription of European Parliament speeches published on the web. Statis-tics are provided in Table 1.
We used the open-source MT toolkit Moses (Koehn et al., 2007)1 in its default
monotonic setup, and estimated the weights of the log-linear combination using MERT on the Europarl development set. A 5-gram LM with interpolation and Kneser-Ney smoothing (Kneser and Ney, 1995) was also estimated.
Since our purpose is to adapt the initial weight
1Available from http://www.statmt.org/moses/
vector obtained during the training stage (i.e. the one obtained after running MERT on the Eu-roparl development set), the tests sets provided for the 2008 and 2010 evaluation campaigns of the above-mentioned workshop (Table 2) were also used. These test sets, unlike the one provided in 2006, were extracted from a news data corpus, and can be considered out of domain if the system has been trained on Europarl data.
All the experiments displaying BA results were carried out by sampling a total of 100 random weights, according to preliminary investigation, following the procedure described in Section 5. For doing this, one single weight was added a ran-dom amount between0.5and−0.5, and then the wholeΛwas re-normalised.
With the purpose of providing robustness to the results, every point in each plot of this paper con-stitutes the average of 10 repetitions, in which the adaptation data was randomly drawn from the News-Commentary test set 2008.
6.2 Comparison between BA and MERT
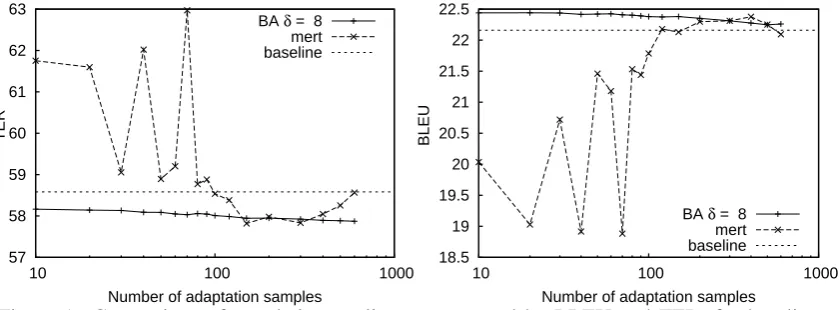
The effect of increasing the number of adaptation samples made available to the system was inves-tigated. The adaptation data was used either for estimatingΛusing MERT, or as adaptation sam-ple for our BA technique. Results can be seen in Figure 1. Theδscaling factor described in
Equa-tion 13 was set to 8. As it can be seen, the BA adaptation technique is able to improve consis-tently the translation quality obtained by the non-adapted system, both in terms of BLEU and TER. These improvements are quite stable even with as few as 10 adaptation samples. This result is very interesting, since re-estimatingΛby means of MERT is only able to yield improvements when provided with at least 100 adaptation samples, dis-playing a very chaotic behaviour until that point.
57 58 59 60 61 62 63
10 100 1000
TER
Number of adaptation samples BA δ = 8 mert baseline
18.5 19 19.5 20 20.5 21 21.5 22 22.5
10 100 1000
BLEU
Number of adaptation samples BA δ = 8
mert baseline
Figure 1: Comparison of translation quality, as measured by BLEU and TER, for baseline system, adapted systems by means of BA and MERT. Increasing number of samples is considered.
0.001 0.01 0.1 1 10 100
10 100 1000
TER CDS
Number of adaptation samples BA δ = 1 BA δ = 32 mert
0.001 0.01 0.1 1 10
10 100 1000
BLEU CDS
[image:6.595.73.493.76.231.2]Number of adaptation samples BA δ = 1 BA δ = 32 mert
Figure 2: Confidence interval sizes (CDS) for MERT and two BA systems, for different number of adaptation samples. For visibility purposes, both axes are in logarithmic scale.
our BA technique yields very small confidence in-tervals, about half a TER/BLEU point in the worst case, with only 10 adaptation samples. This is worth emphasising, since estimatingΛby means of MERT when very few adaptation data is avail-able may improve the final translation quality, but may also degrade it to a much larger extent. In contrast, our BA technique shows stable and reli-able improvements from the very beginning. Pre-cisely under such circumstances is an adaptation technique useful: when the amount of adaptation data is small. In other cases, the best thing one can do is to re-estimate the model parameters from scratch.
Example translations, extracted from the exper-iments detailed above, are shown in Figure 5.
6.3 Varyingδ
So as to understand the role of scaling factor δ,
results obtained varying it are shown in Figure 3.
Several things should be noted about these plots:
• Increasing δ leads to smoother adaptation
curves. This is coherent with the confidence interval sizes shown in Figure 1.
• Smaller values of δlead to a slight
degrada-tion in transladegrada-tion quality when the amount of adaptation samples becomes larger. The reason for this can be explained by look-ing at Equation 13. Since p(A|Λ;T) is implemented as a product of probabilities, the more adaptation samples the smaller be-comesp(A|Λ;T), and a higher value ofδis
needed to compensate this fact. This sug-gests the need of a δ which depends on the
size of the adaptation sample.
57.8 57.9 58 58.1 58.2 58.3
10 100 1000
TER
Number of adaptation samples
δ = 1
δ = 2
δ = 4
δ = 8
δ = 16
δ = 32
21.9 22 22.1 22.2 22.3 22.4 22.5
10 100 1000
BLEU
Number of adaptation samples
δ = 1
δ = 2
δ = 4
δ = 8
δ = 16
δ = 32
Figure 3: Translation quality comparison for differentδvalues and number of adaptation samples.
It might seem odd that translation quality as measured by BLEU drops almost constantly as the number of adaptation samples increases. How-ever, it must be noted that the BA technique im-plemented is set to optimise TER, and not BLEU. Analysing the BLEU scores obtained, we realised that the n-gram precision does increase, but the
final BLEU score drops because of a worsening brevity penalty, which is not taken into account when optimising the TER score.
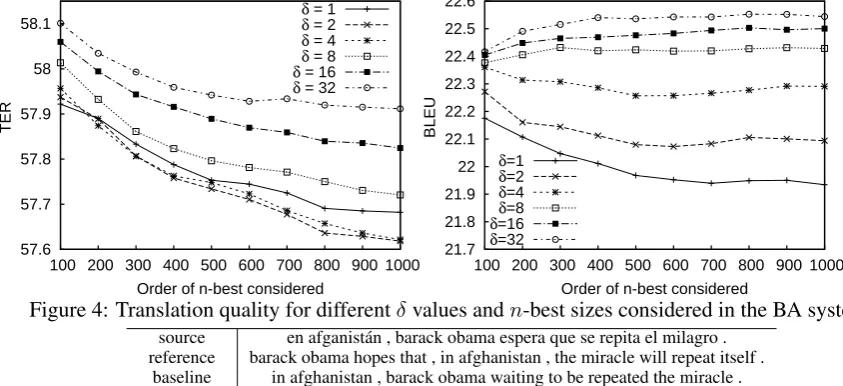
6.3.1 Increasing then-best order
The effect of increasing the order ofn-best
con-sidered was also analysed. In order to avoid an overwhelming amount of results, only those ob-tained when considering 100 adaptation samples are displayed in Figure 4. As it can be seen, TER drops monotonically for all δ values, until
about 800, where it starts to stabilise. Similar behaviour is observed in the case of BLEU, al-though depending on δ the curve shows an
im-provement or a degradation. Again, this is due to the brevity penalty, which TER does not imple-ment, and which induces this inverse correlation between TER and BLEU when optimising TER.
7 Conclusions and future work
We have presented a Bayesian theoretical frame-work for adapting the parameters of a SMT sys-tem. We have derived the equations needed to im-plement BA of the log-linear weights of a SMT system, and present promising results with a state-of-the-art SMT system using standard corpora in SMT. Such results prove that the BA framework can be very effective when adapting the
men-tioned weights. Consistent improvements are ob-tained over the baseline system with as few as 10 adaptation samples. The BA technique imple-mented is able to yield results comparable with a complete re-estimation of the parameters even when the amount of adaptation data is sufficient for such re-estimation to be feasible. Experi-mental results show that our adaptation technique proves to be much more stable than MERT, which relies very heavily on the amount of adaptation data and turns very unstable whenever few adap-tation samples are available. It should be empha-sised that an adaptation technique, by nature, is only useful whenever few adaptation data is avail-able, and our technique proves to behave well in such context.
Intuitively, the BA technique presented needs first to compute a set of random weights, which are the result of sampling a gaussian distribution whose mean is the best weight vector obtained in training. Then, each hypothesis of a certain test source sentence is rescored according to the fol-lowing three components:
• The probability of the adaptation corpus un-der each specific random weight
• The probability of such random weight ac-cording to a prior over the weight vector • The probability of the current hypothesis
un-der those weights
57.6 57.7 57.8 57.9 58 58.1
100 200 300 400 500 600 700 800 900 1000
TER
Order of n-best considered
δ = 1
δ = 2
δ = 4
δ = 8
δ = 16
δ = 32
21.7 21.8 21.9 22 22.1 22.2 22.3 22.4 22.5 22.6
100 200 300 400 500 600 700 800 900 1000
BLEU
Order of n-best considered
δ=1
δ=2
δ=4
δ=8
δ=16
δ=32
Figure 4: Translation quality for differentδvalues andn-best sizes considered in the BA system.
source en afganist´an , barack obama espera que se repita el milagro . reference barack obama hopes that , in afghanistan , the miracle will repeat itself .
baseline in afghanistan , barack obama waiting to be repeated the miracle . BA s10 in afghanistan , barack obama expected to repeat the miracle . BA s600 in afghanistan , barack obama expected to repeat the miracle . MERT s10 in afghanistan , barack obama expected to repeat of the miracle . MERT s600 in afghanistan , barack obama hopes that a repetition of the miracle .
source al final todo fue m´as rpido de lo que se pens´o . reference it all happened a lot faster than expected .
[image:8.595.70.492.80.273.2]baseline at the end of all was more quickly than we thought . BA s10 ultimately everything was more quickly than we thought . BA s600 ultimately everything was more quickly than we though . MERT s10 the end all was quicker than i thought . MERT s600 ultimately everything was quicker than i thought .
Figure 5: Example of translations found in the corpus. s10 means that only 10 adaptation samples were considered, whereass600means that 600 were considered.
portant, since it implies that rerunning MERT for each adaptation set is not needed, and this is im-portant whenever the final system is set up in an on-line environment.
The derivation presented here can be easily ex-tended in order to adapt the feature functions of the log-linear model (i.e. not the weights). This is bound to have a more important impact on transla-tion quality, since the amount of parameters to be adapted is much higher. We plan to address this issue in future work.
In addition, very preliminary experiments show that, when considering reordering, the advantages described here are larger.
A preliminary version of the present paper was accepted at the Joint IAPR International Workshops on Structural and Syntactic Pattern Recognition and Statistical Techniques in Pattern Recognition 2010. The main contributions of the present paper constitute more extensive ex-periments, which have been conducted on stan-dard SMT corpora. Furthermore, in this paper we
present the results of adding the leveraging term
δ, of applying a random, Monte-Carlo like weight sampling (which was not done previously), and an extensive analysis of the effect of varying the or-der ofn-best considered.
We also plan to implement Markov Chain Monte Carlo for sampling the parameters, and analyse the effect of combining the in-domain and out of domain data for MERT. Such results were not included here for time constraints.
Acknowledgments
This paper is based upon work supported by the EC (FEDER/FSE) and the Spanish MICINN under the MIPRCV “Consolider Ingenio 2010” program (CSD2007-00018) and the iTrans2 (TIN2009-14511) project. Also supported by the Spanish MITyC under the erudito.com (TSI-020110-2009-439) project and by the Generalitat Valenciana under grant Prometeo/2009/014.
References
Barrachina, S., O. Bender, F. Casacuberta, J. Civera, E. Cubel, S. Khadivi, A. Lagarda H. Ney, J. Tom´as, and E. Vidal. 2009. Statistical approaches to computer-assisted translation. Computational Lin-guistics, 35(1):3–28.
Bertoldi, N. and M. Federico. 2009. Domain adapta-tion in statistical machine translaadapta-tion with monolin-gual resources. InProc. of EACL WMT.
Bishop, C. M. 2006. Pattern Recognition and Ma-chine Learning. Springer.
Brown, P.F., S.A. Della Pietra, V.J. Della Pietra, and R.L. Mercer. 1993. The mathematics of ma-chine translation. In Computational Linguistics, volume 19, pages 263–311, June.
Civera, J. and A. Juan. 2007. Domain adaptation in statistical machine translation with mixture mod-elling. InProc. of ACL WMT.
Duda, R., P. Hart, and D. Stork. 2001. Pattern Classi-fication. Wiley-Interscience.
Kneser, R. and H. Ney. 1995. Improved backing-off form-gram language modeling. IEEE Int. Conf. on Acoustics, Speech and Signal Processing, II:181– 184, May.
Koehn, P. and C. Monz, editors. 2006. Proc. on the Workshop on SMT. Association for Computational Linguistics, June.
Koehn, P. and J. Schroeder. 2007. Experiments in do-main adaptation for statistical machine translation. InProc. of ACL WMT.
Koehn, P., F. J. Och, and D. Marcu. 2003. Statistical phrase-based translation. InProc. HLT/NAACL’03, pages 48–54.
Koehn et al., P. 2007. Moses: Open source toolkit for statistical machine translation. InProc. of the ACL Demo and Poster Sessions, pages 177–180, Prague, Czech Republic.
Koehn, P. 2005. Europarl: A parallel corpus for statis-tical machine translation. InMT Summit.
Kuhn, R. and R. De Mori. 1990. A cache-based nat-ural language model for speech recognition. IEEE Transactions on PAMI, 12(6):570–583.
Nepveu, L., G. Lapalme, P. Langlais, and G. Foster. 2004. Adaptive language and translation models for interactive machine translation. InProc. of EMNLP. Och, F. and H. Ney. 2002. Discriminative training and maximum entropy models for statistical ma-chine translation. In Proc. of the ACL’02, pages 295–302.
Och, F.J. 2003. Minimum error rate training for statis-tical machine translation. InProc. of Annual Meet-ing of the ACL, July.
Papineni, K., S. Roukos, and T. Ward. 1998. Max-imum likelihood and discriminative training of di-rect translation models. InProc. of ICASSP, pages 189–192.
Papineni, K., A. Kishore, S. Roukos, T. Ward, and W. Jing Zhu. 2001. Bleu: A method for automatic evaluation of machine translation. InTechnical Re-port RC22176 (W0109-022).
Sanchis-Trilles, G., M. Cettolo, N. Bertoldi, and M. Federico. 2009. Online Language Model Adap-tation for Spoken Dialog Translation. In Proc. of IWSLT, Tokyo.
Snover, Matthew, Bonnie Dorr, Richard Schwartz, Lin-nea Micciulla, and John Makhoul. 2006. A study of translation edit rate with targeted human annotation. InProc. of AMTA’06.
Zens, R., F.J. Och, and H. Ney. 2002. Phrase-based statistical machine translation. In Proc. of KI’02, pages 18–32.
Zhang, Hao, Chris Quirk, Robert C. Moore, and Daniel Gildea. 2008. Bayesian learning of non-compositional phrases with synchronous parsing. In Proceedings of ACL-08: HLT, pages 97–105, Columbus, Ohio, June. Association for Computa-tional Linguistics.