Abstract
Freeman, Jacklyn Harrell. Evaluating the Effects of Age on the Variability in Lifting Technique.
(Under the direction of Dr. Gary A. Mirka)
As individuals age, they under go numerous changes that can affect their lifting technique. These changes include muscle strength and flexibility reductions, and decreases in postural control. The rate and degree of these declines vary from individual to individual, which can lead to variability in their lifting technique. The objective of this research was to evaluate the inter- and intra-subject variability of the trunk kinematics and ground reaction forces on the lifting technique used to perform a lifting task. Variability of the lifting technique is important to consider when evaluating the safety of lifting tasks. A higher variability of a lifting technique means that some individuals perform the lifting task using more extreme techniques than others. Thus, a lifting task with high variability can lead to a greater risk of injury if the variability is not taken into account when testing the safety of the lifting task. The hypothesis was that an older subject group would have a higher inter- and intra-subject variability than a younger subject group. It was hypothesized that older subjects would ha ve greater inter-subject variability because of the varying experiences and
backgrounds of the older subjects, which would lead to variances in the lifting technique between subjects. It was hypothesized that older subjects would exhibit greater intra-subject variability because older subjects are more likely to lose their balance during a lifting task and would experience weakened muscles faster than younger subjects, both of which would lead to variance in the lifting technique within a subject.
and three levels of lifting asymmetry angle. Trunk kinematic data were captured using a Lumbar Motion Monitor, and ground reaction force data were captured with a force platform. The inter- and intra-subject variability of the trunk kinematic data and force platform data were calculated using equations derived from the Modified Levene’s test. Two statistical models were created – one model for the inter-subject variability dependent variables and one model for the intra-subject dependent variables. Multiple Analysis of Variance (MANOVA) and subsequent univariate Analysis of Variance (ANOVA) techniques were used to analyze the effects of age, weight, and angle (and their interactions) on the dependent variables.
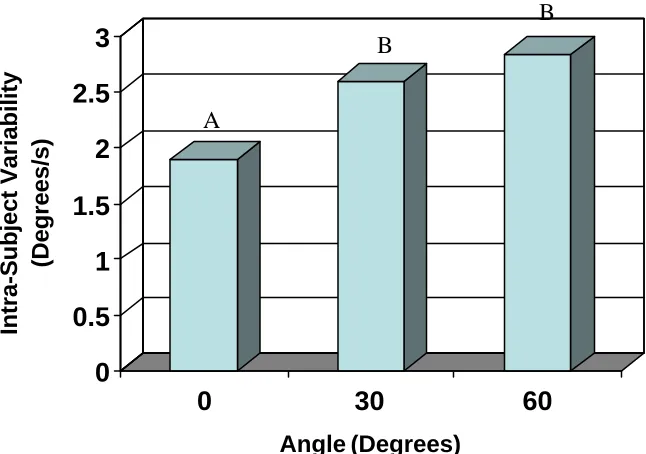
The results did not support the hypothesis, as age was neither a significant main effect nor a factor in any significant interactions for any of the dependent variables. For inter-subject variability, the MANOVA showed that weight*angle was significant and for intra-subject variability, the MANOVA showed that angle was significant. The general trend of increasing intra-subject variability was demonstrated with increasing angle.
Evaluating the Effects of Age on the
Variability in Lifting Technique
By
Jacklyn Harrell Freeman
A thesis submitted to the Graduate Faculty of North Carolina State University
in partial fulfillment of the requirement for the Degree of Master of Science.
INDUSTRIAL ENGINEERING
Raleigh, North Carolina
May 2005
APPROVED BY:
________________________ ________________________
David Kaber, PhD Peter Mente, PhD
________________________
Gary A. Mirka, PhD
Biography
Jacklyn was born on December 20, 1980 and grew up in Wilmington, North Carolina. She grew up with her parents, JE and Susan Harrell and her brother Callie. Her dad is an Engineering Supervisor at Progress Energy and her mom teaches 4-year old preschoolers at Scotts Hill Christian Academy.
Table of Contents
List of Figures...v
List of Tables
...vii1
Introduction
...11.1 The Aging Workforce ...1
1.1.1 Changes in Physical Capability ...5
1.1.1.1 Muscle Strength ...5
1.1.1.2 Psychological Changes ...9
1.1.2 Balance...11
1.1.3 Flexibility...14
1.1.4 Changes in Risk of Injury ...15
1.2 Link to Biomechanical Variability...19
1.2.1 Inter-Subject Variability ...20
1.2.2 Intra-Subject Variability ...23
1.3 Objective and Hypothesis ...27
2
Methods
...292.1 Participants...29
2.2 Apparatus ...29
2.2.1 Lumbar Motion Monitor ...29
2.2.2 Force Platform...30
2.2.3 Box and Platform ...31
2.3 Experimental Design...32
2.3.1 Independent and Dependent Variables ...32
2.4 Procedure ...33
2.5 Data Processing...35
2.5.1 Lumbar Motion Monitor ...36
2.5.2 Force Platforms ...36
2.5.3 Inter-Subject Variability ...36
2.5.4 Intra-Subject Variability ...38
2.6.1 Evaluating the Assumptions of the Analysis of Variance ...39
2.6.2 Statistical Model ...40
2.6.3 Analysis Process ...42
3
Results
...433.1 Inter-Subject Variability ...43
3.1.1 Lumbar Motion Monitor ...43
3.1.2 Force Platform...45
3.2 Intra-Subject Variability ...45
3.2.1 Lumbar Motion Monitor ...45
3.2.2 Force Platform...52
4
Discussion
...545
Conclusion
...65References...66
List of Figures
Figure 1: Lumbar Motion Monitor ...30
Figure 2: Setup of Force Platforms ...31
Figure 3: Setup of Force Platforms and Box...32
Figure 4: Sagittally Symmetric Lift Starting Position...35
Figure 5: 30º Lift Starting Position...35
Figure 6: 60º Lift Starting Position...35
Figure 7: Ending Position of Lift...35
Figure 8: The Age*Weight Interaction on the Inter-Subject Variability of the Peak Coronal Velocity...44
Figure 9: Effect of Age on the Intra-Subject Variability of the Peak Coronal Position...46
Figure 10: Effect of Angle on the Intra-Subject Variability of the Peak Coronal Velocity...47
Figure 11: Effect of Angle on the Intra-Subject Variability of the Peak Coronal Acceleration...48
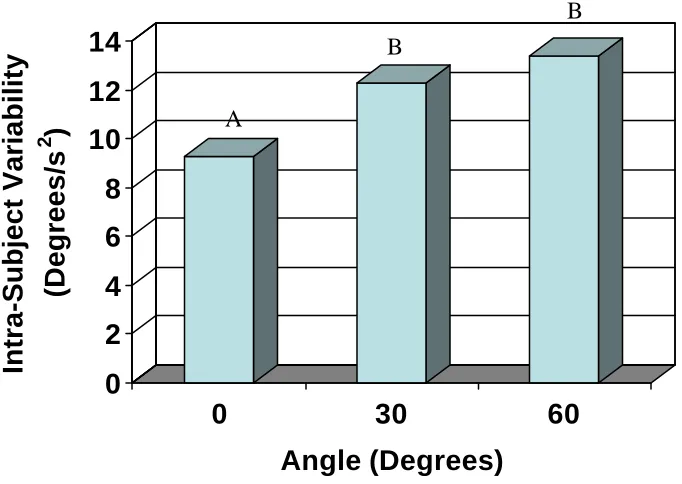
Figure 12: Effect of Angle on the Intra-Subject Variability of the Peak Rotational Position...49
Figure 13: Effect of Angle on the Intra-Subject Variability of the Peak Rotational Velocity...50
Figure 14: Effect of Angle on the Intra-Subject Variability of the Peak Rotational Acceleration...51
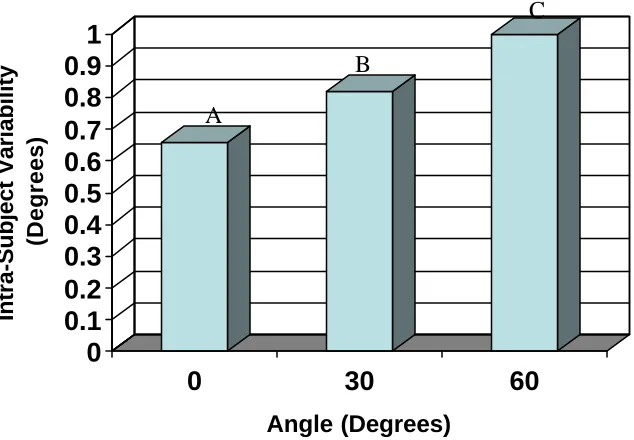
Figure 15: Effect of Angle on the Intra-Subject Variability of the Peak Sagittal Position...52
Figure 16: Effect of Angle on the Intra-Subject Variability of the Peak Vertical Downward Force of the Right Foot ...53
Figure 17: The normal quantile plot of the residuals for the inter-subject variability of the peak coronal position...69
for the inter-subject variability of the peak coronal position...71 Figure 20: Scatter plot of the residuals to test the independence between trials
for the intra-subject variability of the peak coronal position...71 Figure 21: Scatter plot of the residuals as a function of the predicted values for
the inter-subject variability of the peak rotational velocity ...72 Figure 22: Scatter plot of the residuals as a function of the predicted values for
the inter-subject variability of the peak rotational velocity using the
log transformation values...72 Figure 23: Scatter plot of the residuals as a function of the predicted values for
the intra-subject variability of the peak coronal velocity...73 Figure 24: Scatter plot of the residuals as a function of the predicted values for
the intra-subject variability of the peak coronal velocity using the
List of Tables
Table 1: ANOVA Results Relative to the Inter-Subject Variability of the Peak
Kinematic Dependent Variables ...43 Table 2: ANOVA Results Relative to the Inter-Subject Variability of the Peak
Lateral, Anterior, and Vertical Downward Forces in the of the Right
Foot ...45 Table 3: ANOVA Results Relative to the Intra-Subject Variability of the Peak
Kinematic Dependent Variables ...45 Table 4: ANOVA Results Relative to the Intra-Subject Variability of the Peak
Lateral, Anterior, and Vertical Downward Forces in the of the Right
1 Introduction
1.1 The Aging Workforce
It has been well documented that people are living longer due to better nutrition, exercise, housing, and education (Wright and Mital, 1999). Health improvements from medical technology, healthier lifestyles, less physically demanding work, and better living conditions have also contributed to longer lives of individuals (Weston, 1999). Rix (2004) states that in 2002, 14.2 percent of the labor force, or 20.2 million, people were 55 years or older. Also, reporting from the Bureau of Labor Statistics, Schwerha and McMullin (2001) predict that by 2008, 30% of the American population and will be over 55 years old and will represent the group with the greatest annual growth rate. It has also been reported that since 1950, the percentage of the U.S. population 65 years of age or older has increased from 8 to 12 percent (Weston, 1999). Weston (1999) also reports that these demographic trends are due to a decline in fertility rates as well as a steady rise in life expectancy. For example, life expectancy measured from birth has increased almost 20 percent since 1940 while life expectancy measured at age 65 has increased even more. From this information, it seems that people are living longer and often remaining in the workforce for longer periods of time.
Rix (2004) reports that most older workers are wage and salary workers with traditional work arrangements and can be found in virtually every industry. For example, older men have been found to be mostly working in manufacturing, construction,
(2004) listed several reasons why a growing number of workers will delay retirement and stay in the workforce longer. These reasons include concerns about personal retirement savings and 401(k) plans. He notes that workers may be scared that they will outlive their retirement savings, with life expectancy at 65 being more than five years over what it was when the Social Security system was established. Workers may also work longer to fill their time during retirement due to their rising life expectancy. Layne and Pollack (2004) also report that the average retirement age is expected to increase. Their reasoning is that the older population is healthier than it has been before, age discrimination is declining, and the age for collecting full social security benefits is gradually increasing.
Even workers who retire may feel the need to work part-time or even full time after retiring. For example, Rix (2004) found that 6 in 10 retirees who were still employed viewed partial retirement as the ideal work arrangement. According to a survey conducted by the National Institutes on Aging, 73 percent of workers 51 to 61 years old report that they would like to continue doing some paid work after they retire. Also, Rix (2004) reports from a survey by AARP that 68 percent of workers 50 to 70 years old plan to work in retirement or expect never to retire. In addition, Weston (1999) found in a survey of older workers that there was a preference for gradual retirement because post-career employment offers a less demanding option to older workers who want to keep working. Individuals may also want to work longer because work can have a positive impact on an individual’s quality of life while promoting better physical and mental well-being and proving an important social outlet accompanied by a sense of accomplishment and responsibility (Weston, 1999).
work activity in workers who have retired, in order to find trends in retirement ages and work after retirement. She found that both full- and part-time work among retired men, defined as those receiving income from a pension, less than 65 years old has increased in recent years. She attributes this finding in part to increases in expenses or reduced income among
individuals who receive pensions. She feels that other reasons for retired individuals to continue working are declines in the value of pensions, or increases in health care costs.
Since individuals are staying in the workforce for longer periods of time, the follow question may arise: will these older workers be able to perform the work required of them, especially in manual material handling tasks. Williams and Crumpton (1997) note a concern that an aging worker experiences the same job demands as younger workers, but the aging worker also experiences changes in physical and mental abilities that come along with aging. Several researchers have conducted studies to determine the specific effects aging has on a worker and have attempted to quantify the differences between younger and older workers. Several areas of research include work ability, physical capacity, and balance. It is important to understand exactly what these changes are and how they affect an older worker’s ability to perform his or her job so that employers can obtain maximum productivity from older
questions about the worker’s physical, mental, and social capacities and is based on a point system ranging from 7 to 49 points. The Finnish Institute of Occupational Health proposes that the WAI can indicate when certain measures need to be taken to create a better work environment for the workplace. For example, a WAI of 7 to 27 would indicate poor work ability and would suggest that measures to restore good work ability should be taken. A score of 28 to 43 is classified as moderate work ability and suggests that measures should be taken to improve the WAI. The subjects in Williams and Crumpton’s study consisted of 20 employees that were either clerks, administrators, instructors, or technicians. Each subject was given a questionnaire and asked to respond to questions dealing with their physical, mental, and social capacities. The answers to these questions determine each subject’s WAI. Results indicate that the overall WAI scores of the participants ranged from 41 to 49.
Eighty-five percent of the subjects had a good WAI ranging from 44 to 49 points while fifteen percent of the participants had a moderate WAI. Williams and Crumpton performed a linear approximation of their data and found that for workers aged 55 to 66 years, there was a small decrease in work ability as compared to when the workers were working in their younger years. The results of Williams and Crumpton imply that, since older workers have a decreased WAI, having the same workstation or job tasks as a younger worker may cause the older worker to be less productive or become fatigued quicker than the younger worker. Employers should take this into account and have some way to accommodate older workers.
1.1.1 Changes in Physical Capability
Much of literature on aging separates the changes in physical capability into the changes in muscle strength and physiological changes.
1.1.1.1 Muscle strength
and isokinetic strengths due to aging may mean that older individuals are more prone to an early onset of fatigue.
Skelton et al. (1994) believe that maximal muscle strength, also known as the force of contraction, decreases with increasing age, and that the loss of maximal explosive power may be even greater. They conducted a cross-sectional study with the objective of investigating the effects of healthy aging on muscle strength, power, and related functional ability. This was done by measuring the isometric muscle strengths of the knee extensor and elbow flexor muscles in 100 subjects that consisted of 50 men and 50 women all between the ages of 65 and 89 years. Handgrip strength and leg extensor power were also measured. The functional ability tests were chosen for their relationship to either strength or power and consisted of rising from a chair, lifting a bag onto a fixed surface, and stepping up onto five boxes without the use of handrails. They found that isometric strength declined at a rate of 1-2% per year while leg extensor power declined at a rate of 3.5% per year. They also report that explosive power had a faster decline rate than knee extensor strength in men but not in women. The results also indicate a correlation between strength, power, and the chair rise and box
stepping functional ability tasks. Skelton et al. suggest that reduced strength and power may lead to the inability to function in various daily living tasks and that a loss of muscle
performance may be an inevitable accompaniment of aging.
Okada et al. (2001) conducted a study investigating the effects of a sudden
and the medial head of the gastrocnemius muscle of the right leg. Their results indicated that when compared to the younger group, the older subject group had lower muscle forces in their extremities. Dorsal flexion, plantar flexion, knee extension, and knee flexion all were significantly less in the older subject group than in the younger group. These results are in accordance with Skelton et al.’s findings that muscle strength decreases with age.
Schibye et al. (2001) conducted a study that investigated the physical capacity, defined through aerobic power and muscle strength, of young and elderly workers, both with physically demanding jobs and without. The young subject groups consisted of workers aged 19-32 years with physically demanding jobs – waste collection, and a control group without physically demanding jobs. The elderly groups were aged 47-64 years and consisted of the same job categories as the young workers. The objective of this study was to determine if waste collection has a training or wearing effect on the workers’ physical capacity by
comparing aerobic power and muscle strength in the young and elderly waste collectors with a control group of young and elderly workers without physically demanding jobs. In the muscle strength assessment part of the study, maximal isometric muscle strengths were measured for back extension and flexion, shoulder elevation and abduction, and handgrip. The results with respect to muscle strength reveal a reduction in muscle strength in the elderly control group (non-physically demanding jobs). The handgrip strength decreased approximately 10% while the shoulder muscle strength decreased approximately 30-45% in the elderly control group when compared to the young control group. There was no
significant difference found in the back and abdominal muscle strength. In the waste
groups, both the young and elderly waste collectors had larger muscle strengths. This could mean that a physically demanding job such as waste collecting may have a training effect on the strength of the shoulder muscles.
However, other researchers report that workers with physically demanding work may have a tendency of having lower muscle strength (Savinainen et al., 2004). Savinainen et al.
(2004) also conducted a study that examined the physical capacity and muscle strength of aging workers. Their study was a 16-year follow up study. Consisting of groups separated into workers with a perceived high workload and a perceived low workload, this study determined that there was an age related decline in the physical capacity of the workers. Specifically, the groups with a perceived high workload experienced a more pronounced decrease in physical capacity than the groups with a perceived low workload. There was also a decrease in muscular strength in the workers with a perceived high workload. Since
Savinainen et al. found that older workers with a high-perceived workload experienced a diminished physical capacity, he concluded that physical work may not have a training effect on either musculoskeletal or aerobic capacities as others had suggested. Savinainen agrees with other researchers who suggest that high physical demands in a job may have a wearing effect on trunk muscles and the lower extremities, which would be a reason for the
diminished muscle strength in aging workers whose jobs entail performing a lot of manual work such as lifting tasks in their job.
It has also been reported (Laughton et al., 2003) that many older individuals
workers may tire more easily then they did in the years before when they were younger. As stated by Shephard (1999), older employees have a harder time undertaking physically demanding jobs that include repeated carrying and lifting tasks. Rix (2004) also agrees that 20 percent of people 55 to 64 years old report some sort of activity limitation. From the available literature, it is evident that some researche rs disagree on whether or not a physically demanding job has a training effect on the muscles used in the job.
There seems to be a general consensus in the current aging literature that as an individual ages, his or her muscle strength decreases over time. However, the current literature does not reach an agreement on the extent or rate of muscle strength decline. Researchers also disagree on whether or not a physically demanding job has a wearing effect on the muscles.
1.1.1.2 Physiological Changes
these older individuals may experience a reduced rate of sweating in hot environments that can lead to ove rheating. When fluid is lost due to sweating, blood flow to the muscles is reduced because a substantial fraction of the blood flow is directed to the skin instead of the working muscles. This loss of blood flow causes the worker not to be able to operate at 40% of his or her maximal oxygen intake in an eight-hour day without developing severe fatigue. Shephard found that when work is performed in a hot environment, the rise in core body temperature depends on the relative intensity of effort and not the absolute intensity of effort. This negatively affects older workers because their maximal oxygen intakes are lower than younger workers. Therefore, older workers have a higher intensity of effort than younger workers. These declines in thermoregulation can lead to decreased worker productivity due mainly to worker discomfort. When an older worker realizes his productivity is decreasing, he may try to work harder to catch-up, which can lead to fatigue, poor quality output, accidents, injuries, and absenteeism.
The aforementioned study conducted by Schibye et al. (2001) also tested aerobic capacity of young and elderly workers with physically demanding jobs and without
waste collectors. The decrease in weight related maximal oxygen consumption may be due to the elderly waste collectors being heavier, since the elderly waste collector group had a significantly higher body mass index (BMI) than the younger group.
Gall and Parkhouse (2004) conducted another study that looked at the changes in physical capacity in aging power line technicians who perform heavy manual work in their jobs. They had three groups of workers – a young group (less than or equal to 39 years old), a middle-aged group (40-49 years old), and an older group (50+ years old). The older group was found to have significant ly lower aerobic capacity, at almost a 30% reduction when compared to the young group. Also, a 17% reduction in musculoskeletal capacity was found in the older group during a one- handed pull down and standard handgrip test, as compared to the young group. They conclude that workers, whose jobs entail physical work, experience a rise in the rate of musculoskeletal disease from 36% to 45% between the ages of 50 an 54 years. This increase in musculoskeletal disease could be due to the reported decrease in physical capacity experienced by older workers.
In the current literature, there is not a consensus on what age defines older workers; however, there does seem to be a consensus, that as an individual ages, he or she experiences a decline in aerobic capacity and thermoregulation. Musculoskeletal capacity has also been shown to decline with age in some studies. These declines can lead to poor worker
productivity since workers would not be working at their optimal ability.
1.1.2 Balance
musculoskeletal functions. Young subject groups have been reported to correct postural disturbances by using a majority of ankle movements; whereas, older subject groups have been reported to use mainly hip movements to compensate for a postural disturbance. This could be due to a lack of somatosensory function since muscle spindles and joint receptors of the lower extremities and cutaneous receptors in the soles of the feet are a main source of somatosensory inputs used to maintain posture when confronted with a postural disturbance. To test this theory, the researchers deliberately disrupted somatosensory input in their
younger subject group to find out if they would respond to the postural disturbance the same way that the older subjects did. When younger subjects experienced this disruption in somatosensory input due to ischaemia brought about by pressure cuffs on the ankles, they responded by correcting postural disturbances by using a hip dominant motion rather than an ankle dominant motion, which was the same way that the older subject group corrected a postural disturbance.
Laughton et al. (2003) conducted a study with 70 older adults and 15 younger adults comparing balance as observed through the postural control of each age group. They found that the older subject group demonstrated an increased amount of postural sway in the anteroposterior direction, which leads to the conclusion that the older group possesses less balance control than the younger population. When compared with the younger subjects, the older group also had greater muscle activation during quiet standing and increased levels of muscle co-activation in response to postural perturbation. This increased postural sway with increased muscle activation may suggest that elderly individuals try to maintain an upright posture by using a postural control mechanism of increasing their muscle activation.
biceps femoris activity during quiet standing than the younger subject group. The increase in bicep femoris activity may be caused by the flexed and rigid stance that the older group assumed, which moves the body’s center of gravity anterior to the base of support. The older subject group would then activate their hamstring muscles to prevent their body’s center of gravity from moving further forward. Therefore, the positive correlation between the
increased muscle activation of the biceps femoris and the increased short-term postural sway in the older group reveals that their aforementioned strategy is ineffective in maintaining short-term postural control. Laughton et al. observe that the increase in muscle activation may be the cause of the increase in postural sway in the older subject group, and therefore, may compromise the older individual’s ability to maintain an upright stability.
acceleration after the postural disturbance. These results show that the older subject group takes a longer time to recover after a postural disturbance and that the older group has to compensate more to regain balance than the younger group. In Gu et al.’s (1996) study, it was determined that the elderly were not as able to rapidly correct their imbalance like the young group. These results suggest that, the older subject group had reduced balancing and walking ability as compared to the younger subject group. Losing balance or postural control while performing a lifting task can alter the lifting technique used to perform the lifting task, and since older individuals are more likely to lose their balance, they may be more likely than younger individuals to alter their lifting technique during a lifting task.
1.1.3 Flexibility
Decreases in flexibility are also a concern with an aging workforce. The current literature on aging is limited in its coverage of flexibility. Hence, there is not much detail on the declines of flexibility as an individual ages. However, some studies include flexibility as a secondary focus in their study. In their 16-year longitudinal follow-up study, Savinainen et al. (2004) evaluated the flexibility of the spine in older subjects. These older subjects were separated into two groups. The first group consisted of workers that had a high-perceived workload and the second group consisted of workers that had a low-perceived workload. Flexibility of the spine was assessed while the subjects were in a standing position and was found by determining the increase in the length of the spine between the seventh cervical vertebra and the first sacral vertebra when subjects had their backs bent forward with knees straight. In their results, Savinainen et al. found that workers with a high-perceived
In Okada et al.’s (2001) study examining age-related differences in postural control due to sudden deceleration, the range of motion in the ankle and hip joints were also tested. To test range of motion, the researchers used a goniometer while the subjects actively moved their ankle and hip joints to the maximum extended and flexed positions. The results of this study indicated that the older subject group had a greater limitation of their hip and ankle joints, which can lead to a decreased range of motion in older workers.
The current literature on flexibility associated with aging is limited. However, some researchers have found decreases in flexibility in older subject groups. With these declines in flexibility, an older worker may not be able to complete the same job tasks, such as tasks that involve overhead work or tasks that require extremes in back extension or flexion, as a younger worker. Decreases in flexibility may also affect the lifting technique employed by older individuals during lifting tasks.
1.1.4 Changes in Risk of Injury
According to Wright and Mital (1999), reduced muscle strengths in the older
workforce may increase the risk of slips and falls in this population. Specifically, reductions in the strength of the tibialis anterior and vastus lateralis have the potential to impair an individual from being able to correct a shift in the body’s center of gravity and effectively prevent a fall. These researchers also report that with decreases in muscle strengths, fatigue may occur earlier, which may lead to chronic fatigue. Research conducted by Laughton et al. (2003) states that increased levels of postural sway in older adults has been linked to an increased risk of falling. For example, these researchers report that when older adults who had fallen one or more times in a year were compared with older adults who had not fallen, it was found that the older fallers had a significantly greater average speed of sway than the non- fallers. Laughton et al. also (2003) found significantly greater anteroposterior sway in older adults who had fallen. Gu et al. (1996) documented that deterioration of postural control ability is thought to be a key factor in falls in the elderly. In their aforementioned study, these researchers noted the important connection between postural stability and being able to avoid falls. They report that previous studies have found that postural sway during quiet stance is greater in elderly adults compared to younger adults, and it is also larger in elderly adults who have a history of falling compared to elderly adults with no history of falling.
emergency departments. From a narrative of each fall or slip/trip without a fall incident of older workers, each incident was coded for extrinsic or intrinsic factors related to the falls. Extrinsic factors included floor contamination from water, ice, oil/grease, and wax; tripping over cords, furniture, and rugs or mats. Intrinsic factors that caused a fall included fainting, seizure, syncope, or dizziness. The results indicate that the most common cause of same-level falls to the floor were extrinsic factors such as floor contamination. Same same-level falls occur when an individual trips on an object or slips due to floor conditions. Older workers were not found to be at an increased risk of a fall injury, but when they did fall, they were more likely to be hospitalized after a fall injury than younger workers. The physician’s diagnosis for slip, trip, or fall incidents among older workers was most commonly a contusion, abrasion, or hematoma, followed by a sprain or strain, followed by a fracture, followed by a laceration. It was also found that same level falls were the most common type of incident among older workers, and that same level falls were mostly due to floor
contamination or tripping hazards.
fallers reported a decline in functional status with 16.7% reporting a decline in social activities and 15.2% reporting a decline in physical activity. More than 90% of the fallers had less physical activity for more than a week after their fall.
any of the joint angles or angular velocities, or the anterior-posterior hip velocity at the points where the toe leaves the ground, the heel makes contact, and the point of the minimum
metatarsal-phalangeal joint clearance (MTPmin) (the point when the ball of the foot comes closest to the ground during the swing phase). The results from the kinetics show that the only difference between the old and young subjects was seen by a greater hip extension moment at MTPmin in the older group. Millis and Barrett feel that their results of the differences in swing mechanics between the two subject groups may be an effect of aging and can be used in predicting fall injuries in older individuals.
In summary, there is currently a void in the literature on studies that investigate the risks of injury on older individuals performing lifting tasks. However, locomotive studies have found that decreases in muscle strength and postural control have been shown to increase risk of injury. Decreases in muscle strengths can lead to an increase in lifting injuries as well as increases in slips and falls. Researchers have also shown a decline in postural control to be a key factor in fall injuries of the elderly. It has also been shown that older individuals are more likely to be hospitalized after a fall than younger individuals. Thus, older individuals need to be especially careful during locomotion and while performing lifting tasks.
1.2 Link to Biomechanical Variability
Since aging affects everyone differently, workers experience the biomechanical effects of aging in different amounts and at different rates, which can lead to both inter- and intra- individual variability in task performance. Inter-individual variability is defined as the variability between individuals; whereas, intra- individual variability is defined as the
is evident that variability in the technique both between and within subjects will exist. The current literature that looks at the physical changes in the aging population and the
correlating risk of injury does not focus on the variability of the older workers. Thus,
variability is important to consider because the amount of variability associated with a lifting task may influence the risk of developing musculoskeletal disorders.
Granata et al. (1999) reported that different lifting tasks may exhibit different
distributions of compressive loads. One task could have an average compressive load with a narrow distribution whereas another lifting task could have an identical average compressive load but with a wide distribution. Since the two tasks have the same mean compressive load, they may both be deemed safe. However, the technique with the wide distribution could have a significant percentage of the exertions exceeding some spinal tolerance levels. Hence, the task with the wide distribution may not be safe because of the large variability in the lifting technique, which could lead to injuries from some exertions exceeding safety limits. Thus variability in the lifting technique is important to consider when evaluating the safety of a lifting task. Currently, there is limited literature that focuses on the variability in the lifting techniques, especially the variability of the lifting techniques of older workers.
1.2.1 Inter-Individual Variability
As individuals age, some may become or remain more active while others become more sedentary which can lead to a high inter-individual variability in the aging population. For example, Savinainen et al. (2004) states that different individuals experience differences in injury susceptibility and differences in risk factor exposures even when performing the same jobs. These differences can lead to older workers undergoing musculoskeletal and aerobic changes at different rates and to different degrees. Therefore, the older workforce will have greater variability in muscle strength and capacity as well as balance control and flexibility. Skelton et al. (1994) agree, and report in their study that there was considerable variance in strength in similar ages among the healthy elderly individuals. To further support this view, Gu et al. (1996) report the trend that older adults have more variance than younger individuals in their postural adjustments. Specifically, they found that older adults exhibited high variance in their kinematic responses to disturbances in their posture. Also, Shephard (1999) reveals that in physically demanding jobs, the toll that the work takes on the worker’s body is heavily influenced by the worker’s body mass. Since there is such a large variability in the body mass of older workers, the way in which a physically demanding job affects their body would be different than younger workers.
Another example of inter- individual variability is found in the study conducted by Williams and Crumpton (1997). As previously described, the work ability index was
In a study of inter- individual variability, which was not focused on aging, Granata et al. (1999) sought to quantify the variability in lifting motions, trunk moments, and spinal loads associated with repeated lifting tasks as well as to identify workplace factors that influenced the biomechanical variability in the lifting tasks. The subjects in this study were either experienced or inexperienced and performed either a sagittally symmetric lift or an
asymmetric lift 60° to the right while lifting either a 13.6 or 27.3 kg box from knee height to an upright posture. The subjects were also told to either lift with a preferred lifting velocity or a faster than preferred lifting velocity. EMG data was collected from the left and right erector spinae, rectus abdomini, latissimus dorsi, external abdominal obliques, and internal abdominal obliques. Trunk motion data was collected from an electrogoniometer that measured sagittal, lateral, and twisting motions of the lumbar region of the trunk. The
dynamic external loads were gathered from a force plate that the subject stood on during each lifting task. The results of this study related to variability showed that the largest source of variability in the trunk motion, lifting moments, and spinal load was actually inter-subject variability, coming from subject-to-subject differences. The variability associated with the dynamic sagittal trunk moment and spinal compression was largely due to the changes in the weight of the box. Interestingly, contrary to Granata et al.’s expectations, the experienced group had greater sagittal and twisting moment variability than the inexperienced group.
A lifting task can be completed using a variety of techniques, which will vary from individual to individual creating inter- individual variability in the lifting technique. Granata
can also lead to inter- individual variability in the lifting technique of older workers. With this speculation of large inter-individual variance surrounding the lifting technique of older workers, this population may be at a greater risk for injury since the work tasks affect each individual so differently. It also may become harder to predict injuries among the older population with a great variability surrounding the lifting technique. However, no research has been conducted that quantifies the variability in the older workforce or that compares this variability to a younger workforce; thus there is a void in the literature of studies that
investigate the inter-subject variability of the lifting technique of older workers.
1.2.2 Intra-Individual Variability
It is also thought that there would be intra-individual variability among the older population. Intra-individual variability can occur since an individual will not use an identical lifting technique for each lift in a given lifting task. Mirka and Baker (1996) noted that most biomechanical systems are multidimensional and indeterminate, which implies that there are many ways an individual can perform a movement or exertion. They further found that the most stressful tasks in a job were the most predictive of overexertion injury, not the average exertions. Hence, the benefit of a workplace parameter that reduces mean spinal
compression but increases the variability would be questionable. Therefore, when assessing the risk of a lifting task, the variability of the lifting biomechanics must be considered as well as the mean values.
Granata et al. (1999) realized that different lifting tasks may have different
load, but with a wide distribution, may have a significant percentage of the subsequent exertions exceeding some spinal tolerance levels. But since the mean compressive loads were the same, ergonomic assessments may conclude that both tasks are equally safe. However, both of these tasks are not equally safe since workers would have greater risk of becoming injury while performing the lifting task with the wider distribution. The same can be said for individuals performing the same lifting tasks. Since there is variability in the way an individual performs the same lifting task, if a mean value is calculated, it may be
determined that a job is equally safe, but that would not be the case because of the variability in how the individual performs the task. Granata et al. (1999) also noted that workplace factors that influence the biomechanical variability of a lifting task will also affect the risk of injury and associated musculoskeletal disorders.
Several studies have examined the intra- individual variability in younger workers and the potential impact that variability has on ergonomic and risk assessment. One such study was the previously mentioned study conducted by Granata et al. (1999). Not only did they evaluate inter-individual variability, but they also evaluated intra- individual variability. In this study, subjects performed lifting tasks while EMG data and trunk motion data were collected. Dynamic external loads were also gathered from a force plate that the subject stood on during each lifting task. Their results showed that the variability associated with the dynamic sagittal trunk moment and spinal compression was largely due to the changes in the weight of the box. The heavier box weight significantly reduced the variability of the sagittal extension velocities and accelerations. Twelve-twenty- four percent of the total trunk
trial-to-trial variability accounted for 20-67% of the task acceleration variability. Greater variability was also found with twisting velocities, lateral accelerations, and twisting accelerations when the lifting task was asymmetric. However, the variability of the lateral velocities was reduced with an asymmetric lifting task. These results show that even with identical lifting tasks, the load on the spine greatly changes, which leads to the conclusion that performing identical tasks does not always produce the same kinetics or kinematics.
Since lifting tasks with the same weight, origin, and destination will not produce the same spinal loads, it is important to determine the biomechanical variability associated with the lifting task as well as workplace factors that influence the variability. An increased variability is harmful because the broad distribution has a greater chance of exceeding tissue tolerance and resulting in an injury (Granata et al., 1999).
Mirka and Baker (1996) were interested in the variability in the external
the location in time when peak value occurred. When the three types of kinematic data were compared, it was determined tha t the higher derivatives of motion contained more variability. When the trunk motion data were put into a dynamic biomechanical model, the results
showed that the kinematic variability had the greatest impact on trunk kinetics. For example, the range of peak torques across the trials revealed that a torque at two standard deviations above the average was between 5 and 11% higher than the average of the peak sagittal torques. This showed that an average peak torque taken on an average lifting exertion may not well represent the type of loading that may occur under identical conditions because of changes in the lifting dynamics chosen by the subject. Also, higher variability was seen in the lifting tasks with a greater weight level.
to note that the higher internal load is only to a certain value that must be determined by the analyst.
Mirka and Marras (1993) conducted another study that focus ed on the variability of the internal stresses on the spine during lifting tasks. In this study, EMG data was collected while subjects performed multiple repetitions of controlled trunk extensions in which the kinematics of the lifting motion were controlled. The results of the study showed that the muscle coactivation patterns had significant variance across multiple repetitions of the same controlled lifting task. It was also found that the torque exerted and the angular velocity from the lifting task affected this variability. After inputting the data into an EMG-assisted biomechanical model, it was found that the erector spinae variability affected the shearing forces on the spine.
The sum of this review of intra- and inter- individual variability indicates that if attention is focused only on average biomechanical stresses, valuable information that could predict low back stress and injury could be lost. Hence, it is important to determine
variability when looking at risk for injury in addition to mean stress. With all of the known changes that an older individual undergoes, and the previous research conducted on
variability in lifting tasks and human performance, a logical next step is to conduct a study that quantifies the inter- and intra- individual variability in older workers.
1.3 Objective and Hypotheses
2 Methods
The objectives of this study are to quantify the differences in the inter- and intra-subject variability in the trunk kinematics and ground reaction forces of older individuals versus younger individuals.
2.1 Subjects
There were two subject groups in this study – a younger subject group and an older subject group. The younger subject group was defined for subjects ranging in age from 20 years to 31 years old, and the older sub ject group was defined for subjects between the ages of 55 and 66 years. Sixteen volunteers participated in this study with eight subjects in each group. Subjects were recruited from the North Carolina State student body, faculty, and local community. The criteria for subject selection was that each subject be male, have no chronic or current back problems or musculoskeletal problems of the upper extremity, and that the subject fit into one of the above age groups. The mean and (standard deviation) for the young subject group’s age, height, and weight are as follows respectively: 25.75 (3.81) years, 178.94 (3.12) cm, and 83.00 (23.66) kg. The mean and (standard deviation) for the older subject group’s age, height, and weight are as follows respectively: 59.9 (3.00) years, 179.06 (4.44) cm, and 89.25 (6.69) kg.
2.2 Apparatus
2.2.1 Lumbar Motion Monitor
planes. These data are collected at 60 Hz. These angular position data were then
differentiated in software to obtain angular velocity and angular acceleration in the three planes. Figure 1 shows the LMM attached to a subject.
Figure 1: Lumbar Motion Monitor
2.2.2 Force Platform
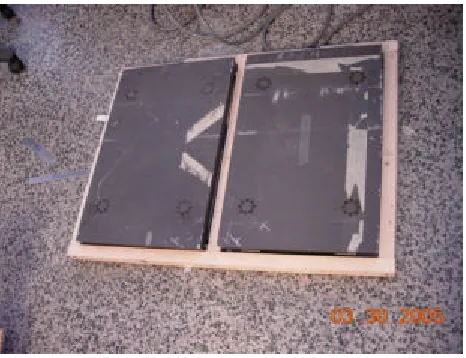
The ground reaction forces at the feet were collected using two force platforms. The force platforms were set up side by side. A wooden frame was built around the force platforms using 3.81cm (1.5 inch) pieces of wood. The wooden frame kept the force platforms secure. Therefore, the force platforms were 3.81cm (1.5 inches) apart. Force platform data were collected at 100 Hz. Both force platforms were from Bertec Corporation, Model 4060A. Each force platform has a unique 6 x 6 calibration matrix and is calibrated individually. The calibration for each force platform is determined when the force platform is manufactured at Bertec Corporation. The calibration matrix is given for an amplifier gain of 1 for all channels. If a gain other than 1 is used, each signal is divided by the
either 10 or 20 was used. The first three rows of the calibration matrix have units of N/V and correspond to the forces. The second three rows have units of N*m/V and correspond to the moments. The force and moment values are calculated by pre- multiplying the signals with the calibration matrix. Both force platforms were auto-zeroed before subjects stood on the platforms. Figure 2 shows the setup of the force platforms.
Figure 2: Setup of Force Platforms
2.2.3 Box and Platform
The subjects were asked to lift a wooden box length by width by height of 35.56 cm by 35.56 cm by 30.48 cm (14 inches by 14 inches by 12 inches). The handles of the box were 19.05 cm (7.5 inches) from the bottom of the box. The handles had foam cushioning so that the subject’s hands would not be injured while performing the lifting task. The empty box was 4.13 kg (9 pounds).
A wooden platform was designed and built to rest 1 inch (2.54 cm) above the right force platform or in the middle of the force platforms when at the sagittally symmetric
from the subject to the box. This moment arm was kept constant from condition to condition and from subject to subject. The moment arm from the subject to the box was always 50.8 cm (20 inches). Figure 3 shows the box and the platform at the sagittally symmetric position. Cast iron weights were added to the box to obtain 4.59 kg (10 pounds) and 9.17kg (20
pounds).
Figure 3: Set-up of Force Platforms and Box
2.3 Experimental Design
2.3.1 Independent and Dependent Variables
The independent variables for this study included age, weight of load, and starting position of the load. There were two levels of age – younger and older, two levels of weight – 4.59 and 9.17 kg (10 pounds and 20 pounds), and three levels of starting position of the load - 0°, 30°, and 60°. 0° is a sagittally symmetric lift. Both the 30° and 60° starting
positions were to the right of the subject. The asymmetric lifts were only to the right of the subjects because pilot data revealed no significant changes when the lifts were performed to the left side and then compared to data from lifts performed to the right of the subject.
the ground reaction forces captured by a force platform. Specifically, the LMM captured the coronal position, velocity, and acceleration; rotational position, velocity, and acceleration; and sagittal position, velocity, and acceleration. The inter- and intra-subject variability were then calculated for the peak values for each observation that occurred during the concentric portion of the lifting motion. The variability of the peak coronal position, velocity,
acceleration, peak rotational position, velocity, acceleration, and peak sagittal position, velocity, and acceleration became the dependent variables. The force platform captured the lateral, anterior, and downward vertical forces, and then the inter- and intra- subject
variability of the peaks of these were calculated. After preliminary analysis of the data, it was determined that the right foot contained the most pertinent information because all lifts were performed to the right side; therefore, only the data from the right force platform, which contained data for the right foot, were used. The variability of the peak lateral, anterior, and vertical downward forces of the right foot became the dependent variables.
2.4 Procedure
Upon arrival of subjects to the place of the experiment, the researcher thoroughly explained and demonstrated the lifting tasks, and the subject was asked to sign an informed consent form approved by the North Carolina State institutional review board. This informed consent form also contained a description of the experiment. The subject was encouraged to ask questions whenever they arose. After signing the form (and receiving a copy for
while performing the lifting tasks. The subject was told to place his left foot on the left force platform and his right foot on the right force platform. The subject was told to keep his heels touching a white line located on top, near the middle, of the force platforms during the one minute of lifting. Keeping the heels on the white line allowed the 50.8 cm (20 in) moment arm from the subject to the box to be maintained. The subject was told he could place his feet at whatever width was comfortable and he could perform a free-style lift (either a leg lift or a back lift) using two hands. The subject was instructed not to move his feet during the trials.
Before the experimental trials started, the subject was told to practice lifting the box to ensure that he was comfortable with his lifting technique and the height to which the load was to be lifted. During the experimental trials, the subject lifted the wooden box, either 4.59 kg (10 pounds) or 9.17 kg (20 pounds), from a position on top of the wooden platform, which was elevated 12.7 cm (5 inches) off the ground, (either directly in front of the subject or off to the right at either 30° or 60°) to elbow height. The end position was always directly in
front of the subject at the subject’s elbow height. Figure 4 shows the starting position of a sagittally symmetric lift, Figure 5 shows a 30° lift, and Figure 6 shows a 60° lift. Figure 7
Figure 4: Sagittally Symmetric Figure 5: 30° Lift Starting Position
Lift Starting Position
Figure 6: 60° Lift – Starting Position Figure 7: Ending Position of Lift
2.5 Data Processing
dependent variables, this variability had to be calculated. The equations used to calculate the variability were from the modified Levene test (Levene, 1960; Mont gomery, 2001). The modified Levene test uses the absolute deviation of the observations in each treatment from the median for that treatment. Microsoft Excel was used to calculate the variability of the variables output by the LMM and the force platforms.
2.5.1 Lumbar Motion Monitor
The LMM output data in the form needed to analyze the data, so processing was minimal. A Matlab program was written to process and analyze the data. This program allowed the necessary kinematic variables to be extracted from the data. The program was written so that the concentric portion of each lift was extracted for each kinematic dependent variable. The concentric portion of the lift was determined from the point of maximum sagittal position to when the subject stood upright (the point when the subject grabs the box to when the subject stands upright with the box – the lifting portion of the lift).
2.5.2 Force Platforms
The force platforms output the data in voltage form. In order to analyze the data, it was converted to forces. Therefore, a Matlab program with calibration equations for each force platform was developed to transform the data. This Matlab program also extracted the concentric portion of the lift for the ground reaction force dependent variables.
2.5.3 Inter-Subject Variability
downward vertical forces by the subject’s weight before the inter-subject variability was calculated. To calculate the inter-subject variability, first, within each subject, the average for a condition for each dependent variable was calculated from 18 values– six lifts per condition and three repetitions per condition. For each subject, there were a total of six averages per dependent variable since there were six conditions. The subjects’ averages were separated into two groups – one group for the averages of the younger subjects, and another group for the averages of the older subjects. Then, for each condition, the median value of these averages from all subjects in an age group was calculated. Thus, this median value was calculated from eight values since there were a total of eight subjects in each age group and each subject has one average value for a condition. There were two sets of median values - one for each age group. For each dependent variable, there were six medians calculated since there were six conditions. Finally, the inter-subject variability was calculated by taking the absolute value of the average value for each subject for a condition minus the respective median value from all the subjects in the respective age group . This process was adapted from the modified Levene test, which is defined as the deviations from the median. This test was used because it is robust from departures from normality.
Example:
Subject 1 (Younger), Condition 1 – Subject 2 (Younger), Condition 1 - Values for 1 dependent variable Values for 1 dependent variable
Peak Coronal Position, 0º, 4.59 kg Peak Coronal Position, 0º, 4.59 kg (10 pounds) (10 pounds)
Rep. 1 Rep. 2 Rep. 3 Rep. 1 Rep. 2 Rep. 3
0 2 3 1 0 2
0 2 5 2 1 2
0 1 4 2 1 1
2 1 3 2 0 1
0 1 4 2 1 1
This process was continued for all subjects. Then the average of all the medians for a specific condition for all subjects in an age group was found, and the inter-subject variability was the absolute value of the average from all subjects in an age group for a specific
condition minus the above median for one subject.
2.5.5 Intra-Subject Variability
The intra-subject variability for both the LMM variables and the force platform variables was calculated. This calculation, like the inter-subject variability calculation, was adapted from the modified Levene test. First, within each subject, the median was calculated from 18 values – six lifts per trial and three repetitions per trial. For each subject, there were a total of six medians per dependent variable since there were six conditions. For each subject, the actual values of the peak coronal position, velocity, and acceleration; peak rotational position, velocity, and acceleration; peak sagittal position, velocity, and
Example:
Subject 1, Condition 1, Values for 1 dependent variable Peak Coronal Position, 0º, 4.59 kg (10 pounds)
Rep. 1 Rep. 2 Rep. 3 (These are the actual values)
0 2 3
0 2 5
0 1 4
2 1 3
0 1 4
0 1 4
The median was determined from the above 18 values. Median = 1.5
Intra-subject variability = Absolute value(1.5-0)=1.5 Intra-subject variability = Absolute value(1.5-0)=1.5 Intra-subject variability = Absolute value(1.5-0)=1.5 Intra-subject variability = Absolute value(1.5-2)=0.5
This process was continued until the intra-subject variability was calculated from all actual values.
2.6 Statistical Analysis
Multiple Analysis of Variance (MANOVA) and subsequent univariate Analysis of Variance (ANOVA) techniques were used to analyze the effects of age, weight, and angle (and their interactions) on the dependent variables. Before performing these analyses, the assumptions of the ANOVA procedure were tested using the graphical methods advocated by Montgomery (2001).
2.6.1 Evaluating the Assumptions of the Analysis of Variance
The normality assumption was tested by developing a normal probability plot of the residuals for each dependent variable. If the error distribution is normal, the plot should resemble a straight line. The independence of errors assumption was tested by plotting the residuals in order of time of data collection. The residuals should be randomly distributed below and above the 0 value on the y-axis. If there are runs of positive and negative residuals, the independence assumption may be violated. This assumption was assessed to ensure there was proper randomization of the trials in the experiment. The homogeneity of variance assumption is used to make certain there is constant variance of the residuals. This assumption was tested by plotting the residuals versus the predicted values. In order for this assumption to be true, the residuals should be structureless and appear to be randomly distributed. If the statistical model is correct and the assumptions are satisfied, the residuals should have no structure and be unrelated to any other variable, including the predicted response (Montgomery, 2001).
In both the inter- and intra-subject variability data sets, approximately half of the dependent variables violated the assumption of constant variance of residuals. The variance of the observations increased as the magnitude of the predicted value increased. Therefore, a logarithmic transformation was performed on both data sets and a MANOVA and ANOVA were performed on the log-transformed data (Montgomery, 2001). Appendix A illustrates the test for homogeneity of variance and includes figures of the residuals versus the predicted values and the residuals versus the predicted values using the logarithmic transformation.
2.6.2 Statistical Model
included age, weight, and angle. Continuous numeric variables included all the dependent variables. A nested- factorial design was used for both models. The nested factor was
subject, which was nested in age and the factorial factors were angle and weight. The models were created by including all three main effects (age, weight, and angle) and all two-way interactions. The appropriate error terms were used as defined by Montgomery (2001) and are as follows: subject(age) is the error term for the age effect; weight*subject(age) for the weight and age*weight effect; angle*age(subject) for the angle and age*angle effect; and weight*angle*subject(age) for the weight*angle effect. The linear model for this design is:
ε
λτγ
τγ
λγ
τβ
λβ
τλ
γ
β
λ
τ
µ m k ijl k il k jl ik jk ij k l k j i ijklmy
= + + + + + + + + + + +) ( ) ( ) ( ) ( where
τ
icorresponds to angle and i = 1-3
λ
jcorresponds to weight and j = 1-2
β
k corresponds to age and k = 1-2γ
l(k)corresponds to subject nested within age and l = 1-8τλ
ijcorresponds to the interaction of angle and weight
λβ
jkcorresponds to the interaction of weight and age
τβ
ik corresponds to the interaction of angle and ageλγ
jl(k) corresponds to the interaction of weight and subject nested within ageτγ
il(k)corresponds to the interaction of angle and subject nested within age2.6.3 Analysis Process
A multiple analysis of variance (MANOVA) was performed on both models to determine the significant effects. Since there were multiple dependent variables, performing the MANOVA controlled the experiment-wise error rate. An analysis of variance (ANOVA) was performed on both models to determine which dependent variables were affected by the significant effects revealed by the MANOVA. Throughout the statistical analysis, a
probability of less than 0.05 indicated a significant effect. To further explore any significant effect of an independent variable with more than two levels, a Tukeys HSD test was
3 Results
The results are presented in four sections. The first two sections are the results from the inter-subject variability split-up into results from the LMM and the force platform. The next two sections are the results from the intra-subject variability, also split into results from the LMM and the force platforms. Significant effects determined by the MANOVA are illustrated in each section.
3.1 Inter-Subject Variability
The following sections describe the results from the analysis of the inter-subject variability dependent variables from the LMM and the force platform. A MANOVA was conducted on the inter-subject variability dependent variables to control for experiment-wise error. The results from the MANOVA indicated that the interaction of weight*angle was significant and a subsequent ANOVA was conducted on this interaction to identify the dependent variables that were driving this significant response.
3.1.1 Lumbar Motion Monitor
Table 1 displays the results from the ANOVA of the weight*angle interaction for the inter-subject variability of the peak kinematic dependent variables.
Table 1: ANOVA Results Relative to the Inter-Subject Variability of the Peak Kinematic Dependent Variables
Independent Variables Coronal Position Coronal Velocity Coronal Acceleration Rotational Position Rotational Velocity F-Ratio P-value F-Ratio P-value F-Ratio P-value F-Ratio P-value F-Ratio P-value
Weight*Angle 1.5 0.2401 1.3 0.2871 1.3 0.2888 1.7 0.2 1.87 0.1715
Independent Variables Rotational Acceleration Sagittal Position Sagittal Velocity Sagittal Acceleration F-Ratio P-value F-Ratio P-value F-Ratio P-value F-Ratio P-value Weight*Angle 2 0.1533 1.39 0.2661 3.6 0.0401* 0.79 0.4647
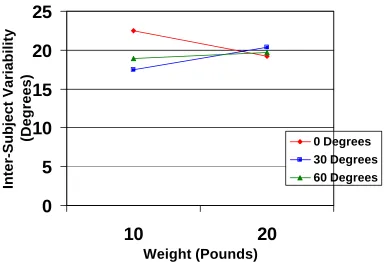
According to the ANOVA, the weight*angle interaction is a significant effect on the inter-subject variability of the peak sagittal velocity. Figure 8 shows the weight*angle interaction on the inter-subject variability of the peak sagittal velocity. The figure
demonstrates that at 0º, the inter-subject variability is statistically different (p<0.05) (shown through simple effects analysis), and decreases as weight increases with a 14.5% decrease from the 4.59 kg (10 pound) weight to the 9.17 kg (20 pound ) weight. However, at 30º and 60º, the inter-subject variability between the 4.59 kg (10 pound) weight and the 9.17 kg (20 pound) weight is not statistically different. At both the 4.59 and 9.17 kg (10 and 20 pound) weights, the inter-subject variability is not statistically different between angles.
Figure 8: The Interaction of Weight*Angle on the Inter-Subject Variability of the Peak Sagittal Velocity
0
5
10
15
20
25
10
20
Weight (Pounds)
Inter-Subject Variability
(Degrees)
0 Degrees3.1.2 Force Platform
Table 2 displays the results from the ANOVA of the weight*angle interaction on the inter-subject variability of the peak lateral, anterior, and vertical downward forces of the right foot.
Table 2: ANOVA Results Relative to the Inter-Subject Variability of the Peak Lateral, Anterior, and Vertical Downward Forces in the of the Right Foot
Independent
Variables Lateral Force Anterior Force
Vertical Downward Force
F-Ratio P-value F-Ratio P-value F-Ratio P-value
Weight*Angle 0.84 0.4408 1.6 0.2186 1.84 0.1769
* indicates a significant effect (p- value of less than 0.05).
This table shows that, according to the ANOVA, the weight*angle interaction was not significant on any of the ground reaction force dependent variables.
3.2 Intra-Subject Variability
The following sections describe the results from the intra-subject variability dependent variables from the LMM and the force platform. A MANOVA was run on the inter-subject variability dependent variables to control for experiment-wise error. According to the MANOVA, angle was significant.
3.2.1 Lumbar Motion Monitor
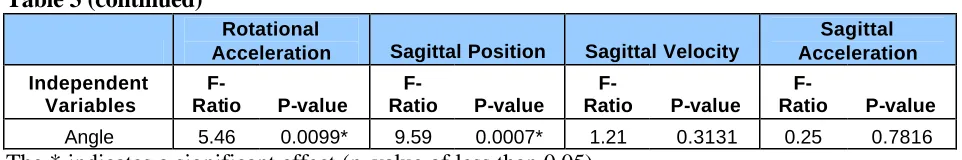
Table 3 displays the results from the ANOVA on the intra-subject variability of the peak kinematic dependent variables influenced by angle.
Table 3: ANOVA Results Relative to the Intra -Subject Variability of the Peak Kinematic Dependent Variables