Comparitive Analysis of Clustering Method
for Road Distress Detection
E. Subashri1,S.Shajun Nisha2
M. Phil Scholar, Sadakathullah Appa Collge,Tirunelveli, India1
Professor & Head of the Department, Department of PG Computer Science, Sadakathullah Appa Collge,
Tirunelveli, India2
ABSTRACT: The road is a way that support to connect two places. It plays major contributions in our daily life. Due to improper maintenance, overloading, climate conditions and some other factors causes the distresses in the roads. The common distresses are cracking, Pothole and rutting. Manually detecting the distresses are the messy and very long time consumption process. Image processing is the method that helped to find the problems in roads. In this paper two steps are involved. The first step is image enhancement that helps to enhance the image quality. Histogram is the one of the technique in enhancement. Histogram is also useful way to enhance the contrast of the image. The second step is segmentation which dividing an image into multiple parts and identify the relevant information of the image. K-means, Fuzzy C Means(FCM), are used for segmentation. It shows the best results while using Fuzzy C means for identify the road cracks.
KEY WORDS: Road cracked image, histogram, Kmeans, Fuzzy c means.
I.INTRODUCTION
The Roads are cost efficient and the most popular dominant mode of transport linking different parts of our country. Roads stretch across the length and breadth of our country. It is used by all sections of people in the society. Road network in India is the second Longest in the world accounting for 3.314 million Km. The main objective of the Road way is providing “connectivity” “Speed” and “safety” they are meant to reduce the travel time and link the metropolitan closer. Roads are affected by following distress Traverse Cracks, Longitudinal cracks, Alligator cracks, Potholes and Rutting. Enhancement is a technique that enhancing an image and provide the better contrast and more detailed image compare to non enhanced image. Histogram is one of the enhancement techniques. Histogram processing is the act of altering an image by modifying its histogram. Common use of Segmentation is to subdivide an image into its components regions or objects. Clustering is a widely used exploratory data analysis tool that has been successfully applied to biology, social science, information retrieval, signal processing, and many other fields (for example, biological data analysis, anomaly detection, image segmentation, etc.), The goal is to identify rare groups or small clusters (in terms of number of members) in the presence of other larger clusters. In this paper, It focus on the FCM clustering method to segment the road and it identify the road cracks then it is compare to the K-Means algorithm which is applied into previous work[9]. Fuzzy clustering as a soft segmentation method has been widely studied and successfully applied in image segmentation. Among the fuzzy clustering methods, fuzzy c-means (FCM) algorithm is the most popular method used in image segmentation because it has robust characteristics for ambiguity and can retain much more information than hard segmentation methods.K means clustering algorithm that classifies the input data points into multiple classes based on their inherent distance from each other. The algorithm assumes that the data features form a vector space and tries to find natural clustering in them. The points are clustered around centroids which are obtained by minimizing the objective.
II.RELATED WORK
struSctures (cracks) in road pavement surface images. Cracks are enhanced using a 1-D Gaussian smoothing filter and then processed by a 2-D matched filter to detect them. A total of 64 road pavement surface images representing several crack types are considered for experimentation, producing a qualitative evaluation. Details on image characteristics or the type of sensor used to capture them are not provided. In paper [2] On the basis of the background correction, several noise deduction methods are compared. Low-pass convolution template method is better. Finally, distress image is segmented. Simple supervised method[3] road distress detection and classification system was used that can be applied to road which suffer from the problem of cracks as itll as potholes. It was demonstrated that the system works itll for the classification of the potholes as itll as cracks. For that the classification has been performed with different sets of images and the performance of the system is evaluated. Several efforts have been made for developing a technology which can automatically detect and recognize potholes [4] , which may contribute to improvement of survey efficiency and pavement quality through prior investigation and immediate action. The existing method for pothole detection which can be divided into vibration method, 3D reconstruction method and vision based method.
In Paper[5] Itwas used for preprocessing as it proved to be the most efficient noise removal technique. Considering the results obtained after the analysis, it is concluded that 1St order moment calculation and 2nd order calculation are two parametric approaches that for the best efficiency for validation of the potholes form the considered samples of plain roads images as itll as potholes road images. Good preliminary method[6] for pothole detection using a single optical camera that can detect potholes and does not rely on training any models. It was found that the method works relativity itll in discarding other vehicles. By measuring the time it takes to perform the algorithms it was found that the algorithm execution speed is adequate given a vehicle speed less than 60 km/hr although the actual maximum distance at which the pothole can be detected needs to be improved to account for the driver reaction time. It to include potholes with no visible edges.
The manual detection[9] of road anomalies is costly and time consuming task. Many efforts are made to develop a technology to asses and recognize the road anomalies. In Paper a new unsupervised method based image processing and spectral clustering. [10] Spectral clustering to identify regions by using histogram-based data from grayscaled image. Data is collected by using in-expensive and omnipresent equipment mounted on passenger vehicles and off the shelf digital cameras for video acquisition. Thus, it is suitable for rough estimation of potholes, and it is cost effective because it uses in-expensive equipment.
Paper[7]gives view about image-processing method for the crack detection of road pavement. A different method for the detection of road cracks has been introduced. A new evaluation and comparison method for automatic detection of road cracks. It considered pixels as for detection of cracks. The dimension of the distressed area such as width in case of longitudinal, transverse cracks, and miscellaneous cracks are digitally and manually measured.
III.MOTIVATION AND JUSTIFICATION
Motivated by all these facts, it used the FCM method for identify the road cracks then it is compare to the k means method. Hence it justify that the enhancement technique with segmentation technique is suitable for this application.
IV.ORGANISATION OF THE PAPER
The Remaining Paper is organized as follows: Section V includes Methodology which includes outline of the proposed work, Section VI includes Experimental Results, Section VII includes Performance Analysis, Section VIII includes conclusion of the paper
In this paper identify the cracks using the clustering methods has four steps there are: 1. Get the Cracked image
2. Apply the enhancement technique histogram 3. Apply K-means, FCM method to segment the image 4. Get a output image.
Fig.1 Outline of Proposed Work
In figure 1 mentioned proposed work of this paper. The enhancement and segmentation techniques are applied into road image. Enhancement is the pre-processing step which is used to enhance quality. Moreover the Segmentation is also helps to segment the cracks after these processing is done, get output of the image.
V.METHODOLOGY
a)Histogram Equalization
Histogram processing is the act of altering an image by modifying its histogram. Common uses of histogram processing include normalization by which one makes the histogram of an image as flat as possible. This is also known as contrast enhancement.
h(rk) = nk
Histograms are frequently normalized by the total number of pixels in the image. Assuming a M × N image, a normalized histogram.
P (rk) = ( )
p(rk)gives an estimate of the probability of occurrence of gray level rk. The Sum of all components of a normalized histogram is equal to1. Histogram equalization is a technique for adjusting image intensities to enhance contrast.The histogram equalized image g will be defined by
gi,j = ( −1)∑ ,
Segmentation
Enhancemen
t
Output Image
Cracked
Input Image
K Means
Histogram
Equalization
FCM
b) K Means
K-Means algorithm is a quite known clustering algorithm that categorizes the input points of data into many groups produced on their inherent distance from one another .The K-means algorithm is one of the most common iterative algorithms which is basically used for its simplicity of implementation and convergence speed.K-means algorithm is statistical clustering algorithm. In this algorithm, the numbers of partitions are basically predefined. The cluster centers are arbitrarily initialized for already defined clusters. Each data point is then allocated to one of the nearest cluster. The cluster centers are then basically re-estimated which and new centroid is computed. Until there is no significant change in the cluster centre, this method is repeated. K-means performs till with many data sets, but its decent presentation is limited mainly to compact groups.
J=∑ ∑ || − ||2
1 ≤ m< ∞
Where ||xij- cj||2is a chosen distance measure batten a data point xij and the cluster centrecj , is an indicator of the
distance of the n data points from their respective cluster centers.
c)Fuzzy C Means
The Fuzzy C-Means algorithm is basically an iterative algorithm that helps to find clusters in data and in which the idea of fuzzy membership is used. As an alternative of giving a pixel to a single cluster, each pixel can have distinctive membership values on each cluster. This algorithm is an unverified clustering algorithm that is functional to quite many issues which involves classifier and clustering design, feature analysis. The Fuzzy C-Means tries to catch clusters of pixel in the data by reducing the objective function as shown in the equation below:
Jm=∑ ∑ || − ||2 1 ≤ m< ∞
where m is any real number greater than 1, uij is the degree of membership of xi in the cluster j, xi is the ith of
d-dimensional measured data, cj is th-dimension center of the cluster, and ||*|| is any norm expressing the similarity
betiten any measured data and the center. Fuzzy partitioning is carried out through an iterative optimization of the objective function shown above, with the update of membership uij and the cluster centers cj by:
Uij =
∑ || ||
|| ||
Cj = ∑∑ .
This algorithm is obtained by iteratively reducing a cost function which is reliant on the displacement of the pixels to the centre of the clusters. The pixels on an image in the immediate neighborhood own the same feature .Therefore, the association of neighboring pixels is an essential property that is of huge importance in image segmentation.
VI. EXPERIMENTAL RESULT
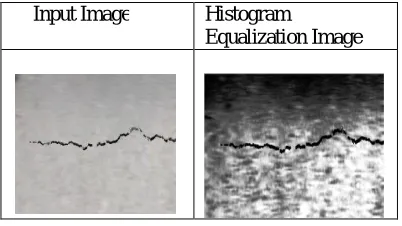
Table 1 Input and Histogram Equalization Image.
In above table 1 mention the input cracked image is enhanced by using histogram equalization Method. After the completion of enhancement processing the output image is applied into the segmentation Process.
Table 2 Segmentation Output Images
In above table 2 mentions the Segmentation output images. After the segmentation process is completed it gets two output images for K Means and Fuzzy C Means. Then each image is measure to the ground truth images.
VII.PERFORMANCE ANALYSIS
Performance measurement is the process of collecting, analyzing and/or reporting information. In this paper it proposed “Ground Truth is a set of measurements that is known to be much more accurate than measurements. It is widely applied to image processing segmentation. Sometimes synthetic images are generated from a model, to test a system whose goal is to estimate parameters of the model. In such cases the ground truth is the known parameters model.
i) PERFORMANCE METRICS:
a) True positive:
A true positive test result is one that detects the condition when the condition is present.
b) True Negative:
A true negative test result is one that does not detect the condition when the condition is absent.
c) False Positive:
A false positive test result is one that detects the condition when the condition is absent.
d) False Negative:
A false negative test result is one that does not detect the condition when the condition is present. Input Image Histogram
Equalization Image
Ground Truth Image
e) Sensitivity:
Sensitivity measures the ability of a test to detect the condition when the condition is present. Thus, Sensitivity = TP/TP+FN
f) Specificity:
Specificity measures the ability of a test to correctly exclude the condition (not detect the condition) when the condition is absent. Thus,
Specificity = TN/TN+FP
g) Accuracy:
The comparison of a measurement with a known standard, used to determine whether the measurement is reliable. Measurement accuracy is identified as the difference between the measurement of a factor and the accepted value for that factor from a trusted external source, or the percentage by which the two values differ.
Accuracy=TP+TN/TP+TN+FP+FN
ii) PERFORMANCE EVALUATION:
Table 3. Performance Metrics
Performance Metrics
Algorithms
KMEANS FCM
TRUE POSITIVE 19759 20210
TRUE NEGATIVE 1980 1673
FALSE POSITVE 0 307
FALSE NEGATIVE 1063 603
In table 3 mentioned the performance Metrics for FCM and KMeans algorithms. Performance metrics are used to measure the accuracy of the work. Using these Metrics it finds Sensitivity and Specificity value.
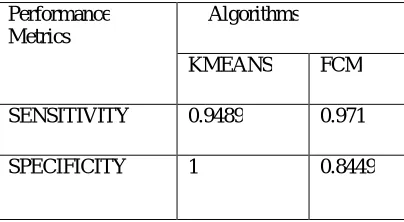
Table 4.Sensitivity and specificity values
Performance Metrics
Algorithms
KMEANS FCM
SENSITIVITY 0.9489 0.971
SPECIFICITY 1 0.8449
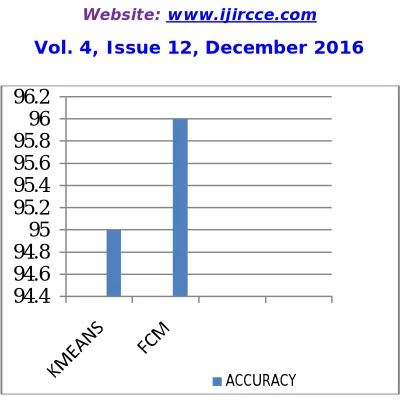
Fig 2. Accuracy result
In above fig 2 represent the accuracy result it is based on the sensitivity and specificity values. In this figure shows the FCM method has high accuracy compare to Kmeans. It identify the road cracks more accurately.
VIII.CONCLUSION
This paper it applied enhancement and segmentation techniques. In segmentation it proposed kmeans, fuzzy c means .Both are consistently among the fastest algorithms. Clustering algorithms should be chosen based on the nature of problem to be solve, characteristic of the objects to be analysed and the expected clusters. These proposed techniques are applied into the road which is suffered from the problems of distresses then these proposed method analysed and classify the road cracks and moreover the proposed system it compare these method which identify the road cracks more accurately. Finally it concluded Fuzzy C Means method finds the cracks more accurate and its estimation was 96%. The result shows that these methods identify the road cracks with reasonable accuracy.
REFERENCES
1. “Introduction of a wavelet transform based on 2D matched filter in a Markov Random Field for fine structure extraction”: Application on road crack detection Sylvie Chambon a and Peggy Subirats b and Jean Dumoulina.a LCPC, Laboratoire Central des Ponts et Chauss´ees, Bouguenais, France b CETE, Centre d’´ Etudes Techniques de l’ ´Equipement, ERA 34, Rouen, France
2. Image Preprocessing Methods to Identify Micro-cracks of Road Pavement Hui Wang, Zhang Chen*, Lijun Sun Key Laboratory of Road and Traffic Engineering of the Ministry of Education, Tongji University, Shanghai, China Email: [email protected]. Optics and Photonics Journal, 2013, 3, 99-102 doi:10.4236/opj.2013.32B025 Published Online June 2013 (http://www.scirp.org/journal/opj)
3. A Novel Technique for Automatic Road Distress Detection and Analysis Akhila Daniel Computer Science and Engineering department SCT College of Engineering, Trivandrum, Kerala Affiliated to Kerala University Preeja. V Computer Science and Engineering department SCT College of Engineering, Trivandrum, Kerala Affiliated to Kerala University. International Journal of Computer Applications (0975 – 8887)Volume 101– No.10, September 2014
4. Review and Analysis of Pothole Detection Methods 1 Taehyeong Kim*,2Seung-Ki Ryu1 Senior Researcher, Korea Institute of Civil Engineering and Building Technology, Korea (*corresponding author) 2 Research Fellow, Korea Institute of Civil Engineering and Building Technology, Korea. Vol. 5, No. 8 August 2014 ISSN 2079-8407Journal of Emerging Trends in Computing and Information Sciences
5. International Journal of Emerging Technology and Advanced Engineering Itbsite: www.ijetae.com (ISSN 2250-2459, ISO 9001:2008 Certified Journal, Volume 4, Issue 7, July 2014)590 Intelligent Pothole Detection System Himanshu Punjabi1, RuchikaNanwani, AakashVaswan 3, Raunak Jotwani4, Dr. AshwiniKunte 5.1,2,3,4 ThadomalShahani Engineering College 2Vice-principal and Head of Department ThadomalShahani Engineering College
6. DETECTING POTHOLES USING SIMPLE IMAGE PROCESSING TECHNIQUES AND REAL-WORLD FOOTAGES Nienaber*, M
Booysen* AND R Kroon***Department of E&E Engineering, Stellenbosch University, Private Bag X1, Matieland, 7602; Tel: 021 808-4013; Email: [email protected]**Computer Science Division, Stellenbosch University, Private Bag X1, Matieland, 7602Tel: 021 808-9375; Email: [email protected]
7. “POTHOLE DETECTION IN ROAD USING IMAGE PROCESSING “T. PRATHIBA1, THAMARAISELVI .M2, MOHANASUNDARI .M3
& VEERELAKSHMI .R4 .1Assistant Professor, Department of Electronics and Communication Engineering, Kamaraj College of Engineering and Technlogy, Tamilnadu, India 2,3,4UG Student, Department of ECE, Kamaraj College of Engineering and Technology, Tamilnadu, India.
94.4 94.6 94.8 95 95.2 95.4 95.6 95.8 96 96.2
BEST: International Journal of Management, Information Technology and Engineering (BEST: IJMITE) ISSN 2348-0513 Vol. 3, Issue 4, Apr 2015, 13-20 © BEST Journals
8. POTHOLE DETECTION AND VOLUME ESTIMATION USING STEREOSCOPIC CAMERAS1MARGARET VELSE THEKKETHALA, 2
RESHMA S, 3 SEBIN JACOB VARUGHESE, 4 VAISHNAVI MOHAN, 5 GEEVARGHESE TITUS 1,2,3,4,5 Dept. of ECE, AmalJyothi College of Engineering, Kottayam, Kerala, India E-mail: [email protected]
9. Analysis of Image Processing Techniques for Road Anomalies Detection Rati Sharma, Kulvinder Singh Laxmi Chand CSE, DIET, Rishikesh, CSE, DIET, Rishikesh, ECE, NSIT, Delhi University, Uttarakhand, India Uttarakhand, India Delhi, India, International Journal of Emerging Research in Management &Technology ISSN: 2278-9359 (Volume-5, Issue-1)
10. Pothole Detection with Image Processing and Spectral Clustering EMIR BUZA, SAMIR OMANOVIC, ALVIN HUSEINOVIC University of SarajevoFaculty of Electrical Engineering, Department for Computer Science and Informatics ZmajaodBosne bb. KampusUniverziteta, 71000 SarajevoBOSNIA AND HERZEGOVINA
11. PATCH DISTRESS DETECTION IN ASPHALT PAVEMENT IMAGES *S. C. Radopoulou, G.M Jog, and I. Brilakis University of Cambridge Department of Engineering Laing O’Rourke Center for Construction Engineering and Technology (*Corresponding author: [email protected])
BIOGRAPHY
Subashri E. is currently pursuing M.phil degree in computer science in sadakathullah Appa College,Tirunelveli. And completed my MSC degree, 2016 in Sadakathullah Appa College, Tirunelveli graduated under Manonmaniam Sundaranar University Tirunelveli. And completed B,sc( Compueter Science) in 2014 Sadakathullah Appa College Tirunelveli, Graduated under Manonmaniam Sundaranar University Tirunelveli.