University of Windsor University of Windsor
Scholarship at UWindsor
Scholarship at UWindsor
Electronic Theses and Dissertations Theses, Dissertations, and Major Papers
2010
Liquid water removal process in the PEMFC cathode side
Liquid water removal process in the PEMFC cathode side
Xiaojing Liu
University of Windsor
Follow this and additional works at: https://scholar.uwindsor.ca/etd
Recommended Citation Recommended Citation
Liu, Xiaojing, "Liquid water removal process in the PEMFC cathode side" (2010). Electronic Theses and Dissertations. 196.
https://scholar.uwindsor.ca/etd/196
This online database contains the full-text of PhD dissertations and Masters’ theses of University of Windsor students from 1954 forward. These documents are made available for personal study and research purposes only, in accordance with the Canadian Copyright Act and the Creative Commons license—CC BY-NC-ND (Attribution, Non-Commercial, No Derivative Works). Under this license, works must always be attributed to the copyright holder (original author), cannot be used for any commercial purposes, and may not be altered. Any other use would require the permission of the copyright holder. Students may inquire about withdrawing their dissertation and/or thesis from this database. For additional inquiries, please contact the repository administrator via email
i
LIQUID WATER REMOVAL PROCESS IN THE PEMFC CATHODE SIDE
by Xiaojing Liu
A Thesis
Submitted to the Faculty of Graduate Studies through Mechanical Engineering
in Partial Fulfillment of the Requirements for the Degree of Master of Applied Science at the
University of Windsor
Windsor, Ontario, Canada
2010
Liquid Water Removal Process in the PEMFC Cathode Side
by
Xiaojing Liu
APPROVED BY:
---
Dr. Chunhong Chen
Department of Electrical and Computer Engineering
---
Dr. Gary Rankin
Department of Mechanical, Automotive & Materials Engineering
---
Dr. Biao Zhou, Advisor
Department of Mechanical, Automotive & Materials Engineering
---
Dr. Andrzej Sobiesiak, Chair of Defense
Department of Mechanical, Automotive & Materials Engineering
iii
AUTHOR’S DECLARATION OF ORIGINALITY
I hereby certify that I am the sole author of this thesis and that no part of this thesis has been published or submitted for publication.
I certify that, to the best of my knowledge, my thesis does not infringe upon anyone’s copyright nor violate any proprietary rights and that any ideas, techniques, quotations, or any other material from the work of other people included in my thesis, published or otherwise, are fully acknowledged in accordance with the standard referencing practices. Furthermore, to the extent that I have included copyrighted material that surpasses the bounds of fair dealing within the meaning of the Canada Copyright Act, I certify that I have obtained a written permission from the copyright owner(s) to include such material(s) in my thesis and have included copies of such copyright clearances to my appendix.
ABSTRACT
The liquid water removal process in the Proton Exchange Membrane Fuel Cell
(PEMFC) has a large influence on the fuel cell performance since the PEMFC works
under a relatively low temperature. In this project, the water behavior in both the gas
flow channels and porous layer at the cathode side of a PEMFC with different channel
geometry are studied numerically. Commercial Computational Fluid Dynamics (CFD)
software package FLUENT 6.3.26 is used to conduct the simulation. The
methodology applied in the numerical investigation using the Volume of Fluid (VOF)
model in this software package and the numerical fuel cell model constructed in this
project is validated with an experiment.
v DEDICATION
ACKNOWLEDGEMENTS
I would like to thank my professor, Dr. Biao Zhou, for his guidance, encouragement
and allowing me the opportunity to join the high quality research team I have come to
know. Sincere thanks to Dr. Gary Rankin, Dr. Chunhong Chen and Dr. Andrzej
Sobiesiak for their time and help in the development of this thesis.
Additional thanks to Le Dinh Anh for his contributions.
I am also grateful for the support given by the AUTO21TM, Network of Centers of
Excellence (Grant D07-303), the Natural Sciences and Engineering Research Council
of Canada (NSERC), and the University of Windsor.
Finally, special thanks to my parents Huanfa Liu and Zhen Wang. Thank you for
putting up with my difficult times and for supporting me while I complete one of my
vii
Table of Contents
AUTHOR’S DECLARATION OF ORIGINALITY ... iii
ABSTRACT ... iv
DEDICATION ... v
ACKNOWLEDGEMENTS ... vi
LIST OF TABLES ... x
LIST OF FIGURES ... xi
LIST OF ABBREVIATIONS ... xiii
CHAPTER 1. INTRODUCTION ... 1
1.1 Fuel cell technology ... 1
1.2 Classification of fuel cells ... 2
1.3 Proton exchange membrane fuel cell (PEMFC) ... 2
1.4 Liquid water effect in PEMFC ... 3
CHAPTER 2. LITERATURE REVIEW ... 5
2.1 Numerical studies review ... 5
2.2 Experimental studies review ... 9
2.3 Objective ... 12
CHAPTER 3. NUMERICAL MODEL SETUP ... 13
3.1 Numerical simulation domain setup ... 13
3.2 Mathematical model setup ... 17
3.3 Grid setup ... 19
3.4 Initial settings of water ... 20
CHAPTER 4. NUMERICAL MODEL VALIDATION ... 22
4.1 Purpose of the experiment ... 22
4.2 Experimental methodology ... 22
4.3 Experiment setup... 23
4.3.1 Construction of the test bench ... 23
4.3.2 Transparent fuel cell ... 24
4.4 Initial setting of the fluids ... 25
4.4.1 Air inlet mass flow rate ... 25
4.4.2 Liquid water inlet mass flow rate ... 26
4.4.3 Contact angle ... 26
4.5 Experiment results and analysis ... 28
4.6 Comparison of the numerical simulation results and experiment results ... 31
4.7 Summary ... 38
CHAPTER 5. LIQUID WATER REMOVAL PROCESS IN SERPENTINE CHANNEL WITH POROUS LAYER ... 39
5.1 General process of liquid water removal ... 39
5.2 Liquid water emerging into the channel from porous layer ... 41
5.3 Liquid water moving inside the porous layer ... 48
5.4 Summary ... 55
CHAPTER 6. LIQUID WATER REMOVAL PROCESS IN STIRRED TANK REACTOR CHAMBER WITH POROUS LAYER ... 56
6.1 General process of liquid water removal ... 56
6.2 Liquid water moving inside the porous layer ... 58
6.3 Liquid water emerging into the chamber from porous layer ... 67
6.4 Summary ... 70
CHAPTER 7. LIQUID WATER REMOVAL PROCESS IN PARALLEL BAFFLE BLOCKED CHANNEL WITH POROUS LAYER ... 72
7.1 General process of liquid water removal ... 72
7.1.1 Identification of the names for different segments in the geometry ... 72
7.1.2 General process of liquid water removal ... 73
7.2 Liquid water behavior at the inlet manifold area ... 75
7.3 Liquid water behavior at the outlet manifold area ... 78
7.4 Liquid water accumulation in the cavities ... 81
7.4.1 Liquid water accumulation process ... 82
ix
7.5 Liquid water moving inside the porous layer ... 87
7.6 Summary ... 90
CHAPTER 8. CONCLUSION ... 92
REFERENCE ... 93
LIST OF TABLES
xi
LIST OF FIGURES
Fig. 1. A schematic of fuel cell technology concept... 1
Fig. 2. Basic concept of a PEMFC ... 2
Fig. 3. 3D domain for the validation model ... 14
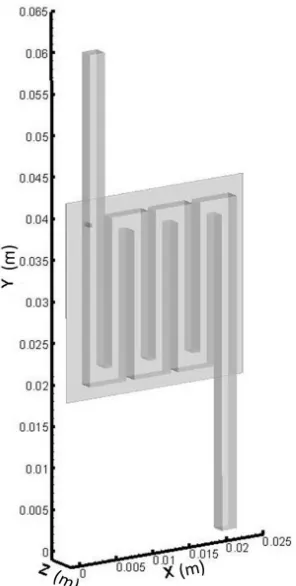
Fig. 4. 3D domain for the serpentine channel with porous layer case ... 14
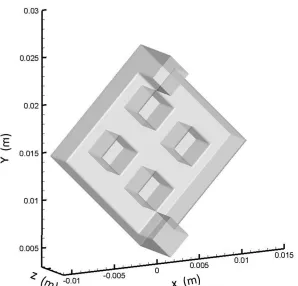
Fig. 5. 3D domain for STR chamber with porous layer case ... 16
Fig. 6. 3D domain for PBB channel with porous layer case... 16
Fig. 7. Liquid water film initial state illustrated with the serpentine with porous layer case ... 21
Fig. 8. Schematic of the test bench for the validation experiment ... 23
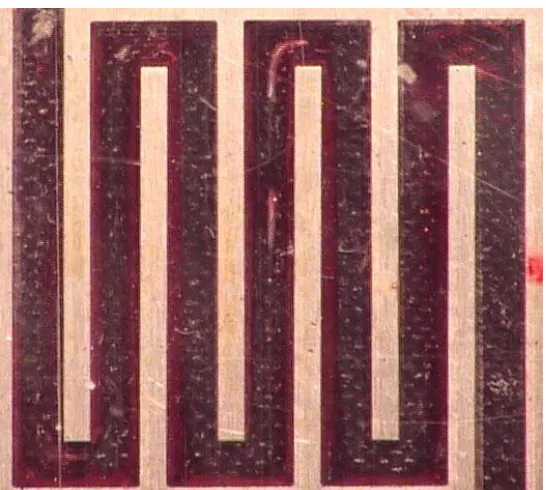
Fig. 9. A picture of the transparent fuel cell used in the experiment ... 24
Fig. 10. A picture of the commercial camera used in the experiment ... 25
Fig. 11. Contact angle measured with one liquid water droplet on the MEA ... 27
Fig. 12. Contact angle measured with one liquid water droplet on the stainless steel flow field plate ... 27
Fig. 13. Contact angle measured with one liquid water droplet on the transparent end plate ... 27
Fig. 14. Liquid water removal process in the transparent fuel cell ... 30
Fig. 15. Liquid water removal process comparison from both the validation model and the experiment ... 35
Fig. 16. Pressure drop data get from both the validation model and the experiment .. 37
Fig. 17. General process of liquid water removal in serpentine channel with porous layer domain... 40
Fig. 18. The droplet held near the bending area of the channel due to the back flow 44 Fig. 19. The droplet collides with the wall at the bend area of the channel ... 46
Fig. 20. One droplet catches up with another when moving along the channel ... 47
Fig. 21. Pressure field caused by gas flow before the liquid water film is set... 49
Fig. 23. Liquid water movement inside the porous layer along with time ... 54
Fig. 24. General liquid water removal process in STR chamber and the porous layer domain ... 57
Fig. 25. Liquid water removal process in the porous layer at the beginning period ... 61
Fig. 26. Liquid water removal process in the porous layer along with time ... 63
Fig. 27. Liquid water film broken into liquid water ligaments ... 66
Fig. 28. Liquid water emerging into the chamber area from the porous layer ... 70
Fig. 29. PBB channel with porous layer geometry with the name of different sections ... 72
Fig. 30. General process of liquid water removal in PBB channel with porous layer domain ... 75
Fig. 31. Liquid water behavior at the inlet manifold area ... 77
Fig. 32. Liquid water brought into the outlet manifold by the gas flow at the beginning period ... 79
Fig. 33. Liquid water behavior in the outlet manifold along with time ... 81
Fig. 34. Liquid water accumulated in the cavities attached with the porous layer ... 82
Fig. 35. Liquid water accumulation process in the cavities ... 84
Fig. 36. Liquid water droplet driven from one cavity to the next cavity ... 87
xiii
LIST OF ABBREVIATIONS
Re Reynolds number
d hydraulic diameter
P wetted perimeter
S momentum Source term
g acceleration of gravity (m s⋅ −2 )
u velocity vector (m s⋅ −1)
K surface curvature
s phase volume fraction
υ
kinematic viscosity (m2⋅s−1 )ρ density
ε
porosityµ dynamic viscosity (Pa s⋅ )
χ surface tension coefficient
mɺ mass flow rate (kg s/ )
Vɺ volume flow rate
f Darcy friction factor
Subscripts
g gas
l liquid
c continuity equation
m momentum equation
ch channel
CHAPTER 1
INTRODUCTION
1.1 Fuel cell technology
A fuel cell is a kind of power supply system which converts the energy generated by
the electrochemical reaction to electrical energy directly. The general concept of a fuel
cell includes the electrolyte in the middle and two electrodes on each side of the
electrolyte, one electrode is called cathode, and the other is called anode. The
electrolyte allows the protons generated by the electrochemical reaction in the anode
side to transfer through it to the other side, but prevents the electrons generated at the
same time to go across. In this case, the electrons are forced to go through the external
circuit to reach the cathode side and complete the electrochemical reaction.
Consequently, electricity is formed within the circuit. A schematic of this fuel cell
technology concept with Hydrogen and Oxygen as reactants for example is shown in
Figure 1.
Fig. 1. A schematic of fuel cell technology concept
This technology has been recognized as one of the most promising power generation
systems which have the potential to substitute the traditional power sources used in a
variety of applications nowadays, because it has the advantage of high efficiency, low
contamination and low noise. However it is still in the research stage not
commercialized yet, because some criteria like durability, reliability, and power
density are still waiting to be improved. Thus the methods to optimize these properties
2 1.2 Classification of fuel cells
Along the history of the fuel cell development, generally five categories of fuel cell
classified by their main electrolyte solution are proved to be applicable. They are
Alkaline Fuel Cell (AFC), Molten Carbonate Fuel Cell (MCFC), Phosphoric Acid
Fuel Cell (PAFC), Solid Oxide Fuel Cell (SOFC) and Proton Exchange Membrane
Fuel Cell (PEMFC). Among all these types of fuel cells, the PEMFC attracted the
highest research interest for aerospace and vehicle applications due to its low
operation temperature and relatively high power density.
1.3 Proton exchange membrane fuel cell (PEMFC)
A typical single PEM fuel cell is normally constructed with several key components:
Membrane Electrolyte Assembly (MEA) including proton exchange membrane,
catalyst layers and gas diffusion layers on both sides of the membrane; flow field
plates with flow channels embedded on each side of the MEA; and end plates on each
side of the fuel cell with clamping solutions to hold the whole fuel cell together. The
basic concept of a single PEMFC is shown in Figure 2.
The electrochemical reaction in the PEMFC is divided into two steps, the two half
reactions occur in the anode side and the cathode side of the fuel cell separately. The
anode electrode is where the oxidation reaction shown in equation 1.1 takes place.
(1.1)
While the reduction reaction as in equation 1.2 takes place at the cathode electrode.
(1.2)
As shown in above equations, PEMFC consumes Hydrogen and Oxygen, and
generates water at the cathode side while the PEMFC system is running.
1.4 Liquid water effect in PEMFC
Since PEMFC operates under a low temperature (30 to 100℃), condensation of the
water generated in the electrochemical reaction in PEMFC is inevitable. Condensed
liquid water appears mainly at the cathode side of the PEMFC where water is
generated from the reduction reaction. Some liquid water may transfer to the anode
side across the MEA due to water concentration difference and the permeability of the
MEA, but the amount of the liquid water in the anode side would be very small
compared to that in the cathode side.
The reduction reaction occurs at the interface of the membrane and the cathode side
catalyst layer in the PEMFC. The condensed water will move through the porous
layers and the gas flow channel, while the amount of water increases by continuous
reaction. The liquid water behavior in these areas has a large influence on the fuel cell
performance. On one hand, a certain amount of water in the PEMFC is necessary to
help enhance the ion conductivity of the membrane. On the other hand, too much
liquid water can corrupt the fuel cell performance causing instability and low
efficiency. The reason for saying liquid water will corrupt the fuel cell performance is
that the porous layers and channel where liquid water will move through are also the
essential path ways for the reactant gas to reach the membrane and join the reaction.
The liquid water in these areas will influence or even block the gas flow, thus
2 2 2
H ⇌ H++ e−
2 2
1
2 2
2O H e H O
+ −
4
reducing the electrochemical reaction rate and reduce the fuel cell performance. As a
matter of fact, to improve the PEMFC performance, a detailed investigation of the
CHAPTER 2
LITERATURE REVIEW
Fluid flow inside the fuel cell is deemed to be one of the most important factors
influencing fuel cell performance. In recent research, gas and liquid water
transportation behavior inside the PEMFC has become the center of the research
concentration. To investigate physical phenomena, experimentation is always firstly
considered, however in a PEMFC system, electrochemical reaction and
multi-component mass transport are involved together, so the detailed investigation
cannot be achieved by experiments. Therefore, numerical modeling and simulation
are mostly applied to investigate the PEMFC in detail. In recent years, along with the
continuous improvement of numerical models, different experimental setups are also
constructed to observe some of the phenomena in the PEMFC and validate the
numerical models. For example, the end plate of a single fuel cell are made
transparent to see the water movement in the gas flow channel, and neutron imaging
technology used to take pictures of the water movement inside the porous layer.
2.1 Numerical studies review
To investigate the fluid flow inside a fuel cell, numerical models are developed to
simulate the fuel cell system. One-dimensional models are developed at the beginning
period of the fuel cell related research. A one-dimensional mathematical model of
PEMFC cathode was presented by Bernardi and Vebrugge [1]. The mechanism of
fluid transport in the fuel cell system including both reactants and water was
investigated. However since it is only a one dimensional model, the difference of the
mass concentration along the gas flow channel and the decrease and increase of the
mass concentration with time are not considered. Nguyen and Yi [2] developed a
two-dimensional, steady-state, mass and energy transport model simulating the fluid
flow phenomena in a plane along the flow direction and perpendicular to the
membrane. The distribution of pressure and temperature along the channel, the
6
channel were obtained, but the variations of velocity and concentration across the
channel were not considered. H.-C. Liu et al. [3] proposed a two-dimensional fuel cell
model to examine the effect of baffles on the gas distribution. Setting baffles in the
channel is an important channel pattern idea that is later applied in the intedigitated
channels. However the variations across the channel were not considered either.
Following one- and two-dimensional models, three-dimensional models with different
channel shapes were constructed for further study. A three-dimensional numerical
model of a straight gas flow channel in a PEMFC was proposed by Dutta et al. [4]
using a commercial CFD software FLUENT. Applying the same software, a 3D model
of a PEM fuel cell with serpentine flow channels, which is one of the most popular
shapes of the channel used in fuel cell, is later proposed by Nguyen et al. [5]. In this
serpentine channel, the effective consumption of reactants for the reaction is increased
as compared to the straight channels. A study investigating the steady-state gas
transport phenomena in a parallel flow channel was conducted by Cha et al. [6] in
which oxygen concentration along the gas flow channel, which may affect fuel cell
performance, were discussed. A three-dimensional, transient numerical PEMFC
model was developed by Kumar and Reddy. [7]. The effect of different gas flow fields
on the PEMFC is studied with serpentine, parallel, multi-parallel and discontinuous
flow-fields individually in this paper.
The basic shapes for channel such as parallel or serpentine are commonly accepted
currently, however these kinds of channel still have their own defects making them
not perfect. Thus, different kinds of improvements have been made on these shapes to
achieve better cell performance. A general review of different shapes of channel is
performed by Li and Sabir. [8]. The channel design is classified into six main types in
this paper, they are pin-type flow field, series-parallel flow field, serpentine flow field,
integrated flow fields, interdigitated flow field and flow-field designs made from
by R. Boddu et al. [9]. Fluid flow and heat transfer inside this improved serpentine
flow channel are considered in this study. With this dual serpentine channel, the
effective reactant area on the MEA can be increased. Comparing the single serpentine
and dual serpentine model applied in this paper, the effective area on the MEA is
increased by 0.56%. Two bio-inspired designs combining the advantages of the
existing serpentine and interdigitated patterns are proposed by J.P. Kloess et al. [10].
Both numerical simulation and experiment have been conducted to investigate the
effects of these two kinds of new flow channel patterns on fuel cell performance. A
lower pressure drop from the inlet to outlet is achieved in the leaf or lung design than
the existing interdigitated flow patterns. Also, more uniform flow diffusion to the gas
diffusion layer was found in these two bio-inspired flow channel patterns. Kuo et al.
[11] investigated the performance of a PEMFC with a novel wave like gas flow
channel by numerical simulation. Compared with the conventional straight gas flow
channel, the wavelike channel increases the reactant flow velocity, enhances the fluid
transport through the porous layer, and improves the temperature distribution. As a
result, reactant utilization efficiency and superior heat-transfer characteristics are
achieved in this kind of channel design.
The research mentioned above made very important contributions to fuel cell
technology. They explained the fluid transportation process in PEM fuel cells with
different channel design, and discussed the advantages and disadvantages of these
flow fields in detail. However the liquid water effect is neglected in their simulation.
Yi et al. [12] found that water vapor condensation is unavoidable on both sides of the
fuel cell and proposed a method using water transport plate to remove excess liquid
water to the coolant flow channels by a pressure difference. Since then, the liquid
water effect in a fuel cell system has been recognized as a very important factor for
fuel cell improvement. Different CFD models with the consideration of liquid water
transportation in the fuel cell were developed to analyze this important effect. Berning
8
flow velocity, species concentration, mass transfer rate, electric current and
temperature by the simulations, and also provided detailed insight into water transport
mechanisms and mass transport limitations in this paper. Hontanon et al. [14] applied
a 3D gas flow model using the commercial software FLUENT and found that the
membrane thickness, cell voltage and current density will affect water transportation
across the membrane. You and Liu [15] simulated the liquid water concentration in
the cathode side of a PEM fuel cell and concluded that a multi-phase model must be
used to obtain more practical simulation results. Wang et al. [16] constructed a
two-phase flow model to simulate the liquid water formation and the effects of the
liquid water on the performance of a PEMFC cathode. A 3D model of a U shape
channel was constructed by Quan et al. [17] to investigate the liquid water effect
inside a fuel cell channel. The simulation results in this paper indicate that the
bending area of the fuel cell channel gives an important influence on the gas flow as
well as the liquid water distribution in a PEMFC. Jiao et al. [18-21] conducted 3D
multi-phase model simulations for different shapes of fuel cell gas flow channel.
Several kinds of initial liquid water settings are studied to simulate different water
condensation phenomena. The simulations were conducted using the VOF (volume of
fluid) model in FLUENT. And the liquid water removal process in the channel models
is discussed in detail. Le et al. [22, 23] introduced general 3D models using the
software package FLUENT simulating a whole fuel cell constructed with serpentine
channel and serpentine parallel integrated channel respectively. Liquid water effect is
considered in these models. The detail of the physics regarding mass concentration,
heat transfer, species transport and electrochemical reaction in these model are also
presented. Zhan et al. [24] studied 3D numerical models, one with a straight channel
and the other with a U shape channel considering the hydrophilicity of graphite plate
(GP) and the hydrophobicity of the gas diffusion layer (GDL) for the walls of the gas
channel, using the volume-of-fluid (VOF) model of FLUENT software. The
simulation results show that the hydrophilicity and the hydrophobicity of the channel
surfaces of the channel are the easier the water is discharged. Quan and Lai [25]
investigated the water behavior in the gas flow channel of a PEMFC cathode as well.
It is proposed in this paper, as it is a very important fluid flow path way inside a fuel
cell, the porous gas diffusion layer must be considered in the numerical model.
Therefore the calculation domain in this paper includes a U shape channel as well as a
layer of porous media attached. The software package FLUENT with VOF model is
applied in this two-phase flow simulation, and the effects of the channel surface
hydrophilicity, gas flow channel geometry, and air inlet velocity on the liquid water
behavior, and the liquid water content as well as the pressure drop inside the channel
are discussed in detail. However the liquid water behavior inside the porous layer is
not discussed. In the authors’ knowledge, there is no literature available to address the
phenomena that occur when the water goes through the porous layer and enters the
channel area which is a very important factor influencing the PEMFC performance.
2.2 Experimental studies review
Other than numerical simulation, experiment is a very important method used to study
PEMFC and validate the numerical models. A transparent fuel cell with a straight
channel is made by Hussaini et al. [26]. The visualization of cathode channel flooding
in a fuel cell is achieved through this setup. Xu and Zhao [27] did an experiment with
a conventional serpentine flow field and an enhanced serpentine flow field to a single
polymer electrolyte-based fuel cell. It is shown from this study that the new flow field
resulted in substantial improvements in both cell performance and operating stability
compared to the conventional serpentine flow field design. The conventional pin flow
channel has been proven to be applicable in PEMFC as well. However the stability
and efficiency of the fuel cell with this kind of channel are still waiting to be
improved. An experiment with an improved pin channel called a cascade-type channel
is performed by A.M. López et al. [28]. In this new design, the conventional square
shape pins are changed to thin bar shape pins perpendicular to the inlet to outlet
10
flow distribution over the catalyst layers, thus making the fuel cell performance more
stable and efficient compared to the conventional pin flow channel. An
auto-humidified operation of the channel-less, self-draining fuel cell, based on a
stirred tank reactor is demonstrated by Hogarth and Benziger [29]. This is also a kind
of improved pin flow channel. Experiment has been performed to compare the
performance of the stirred tank reactor fuel cell with a fully humidified serpentine
flow channel fuel cell. The results show that the stirred tank reactor fuel cell gives a
better performance at high current densities. The new design also has the advantage of
simplifying the fuel cell control by making the humidifiers unnecessary in the system.
However, though it is been proved by experiment that this new design offers many
benefits, the water removal process inside this channel which influences the cell
performance is still unknown since the experiment has its limitation on observing the
detail of the water behavior inside the fuel cell. Yan et al. [30] experimentally
investigated the effects of interdigitated flow channel design on the cell performance
of PEMFC. The effectiveness of the interdigitated flow channel design and the
conventional parallel flow channel design are compared. Different baffle blocked
positions of the interdigitated flow channel are studied. However, the effect of the
baffles to the fluid flow inside the channel and porous layers was not investigated as
well, since it is hard to observe the flow detail through an experiment. As a matter of
fact, a validated numerical model is needed to study these phenomena in detail.
Due to the porosity and the hydrophilicity of the gas diffusion layer and catalyst layer,
the water transportation inside the porous layers is quite different with the water
behavior in the gas flow channel, but also gives a significant influence on the fuel cell
performance. Bazylak et al. [31] conducted an experiment to study the influence of
the material properties on the water droplet movement on GDL. The water
transportation behavior in a straight channel with GDL attached is studied
experimentally by Djilali’s group [32] as well. Sinha et al. [33] did both simulation
PEMFC. Kumbur et al. [34] investigated the liquid droplet deformation at the
interface of the diffusion media (DM) and the gas flow channel theoretically and
experimentally. In Kumbur’s study, the results presented indicate that the operational
conditions, droplet height, chord length, channel size and level of surface
hydrophobicity of the DM directly affect the instability. However the droplet
deformation is studied only with a straight channel, the effects from different channel
shapes and the liquid transportation inside the porous layers were not mentioned.
Hartnig et al. [35] did an experiment to visualize the liquid water inside the porous
layers of the PEMFC using high-resolution synchrotron X-ray radiography technology.
The results of this study clearly show the initial spots of liquid water formation
beneath the ribs of the flow field channel. However it is in-plane visualization, the
method to achieve three-dimensional view is still under research.
All of the research mentioned above gave significant contributions to the fuel cell
technology improvement. At the current time, it is possible to give further attempts in
this area and create a model that can help to obtain results considering all the
necessary domains for the liquid water removal process but not be so complicated that
it consumes too much time for calculation.
According to the commonly accepted theory, a large portion of water in the fuel cell
cathode side is generated from the chemical reaction at the common plane between
the membrane and the cathode side catalyst layer as mentioned at the beginning of
this project. This means that it is inevitable that the water has to move across the
porous layer before it enters the channel area. As a result, water transport in the
porous layer is very important as well. To investigate this process and also give a
more realistic simulation result for the water removal process in the fuel cell channel,
a PEM fuel cell cathode side model is proposed with three different kinds of channels
and one porous layer attached to each of them using the commercial CFD software
12
operating conditions, the detail of phase-change and heat transfer is not considered in
this project. The chemical reactions were not considered either since the effect of the
electro-chemical reactions inside the PEMFC on the liquid water behavior is mainly
to continuously produce water.
In the following chapters, the water removal process in all the possible paths at the
cathode side of a PEMFC is studied. The computational domain, mathematical model,
grid independency and initial settings are introduced. The results from the simulation
in different aspects are presented and concluded which may help the further study of
PEMFC technology.
2.3 Objective
The focus of this project is on the liquid water effect in both the gas flow channel and
the porous layers in the cathode side of a single PEMFC. The investigation is
conducted using the commercial Computational Fluid Dynamics (CFD) software
package FLUENT 6.3.26. The methodology applied in the numerical investigation
with the Volume of Fluid (VOF) model in this software package and the numerical
fuel cell model constructed in this project is validated with an experiment in this study.
The liquid water removal process in serpentine channel, stirred tank reactor (STR)
chamber and parallel baffle blocked (PBB) channel with a porous layer attached on
CHAPTER 3
NUMERICAL MODEL SETUP
3.1 Numerical simulation domain setup
The numerical simulation domain concerned in this project is a full scale single PEM
fuel cell cathode side including gas flow channel as well as porous layers. These are
the only two areas in the cathode side of a fuel cell that allow gas and liquid water to
pass through. A simulation with exactly the same flow field in the experiment setup is
conducted to validate the numerical model. The liquid water removal process of the
serpentine channel, Stirred Tank Reactor (STR) chamber and Parallel baffle-blocked
(PBB) channel with porous layer configuration are studied in this project.
To prove that the numerical model constructed in this project is applicable and
meaningful, a validation model is proposed with the same domain and same initial
fluid flow condition with the experiment as shown in Figure 3. The width of the
channel is 2mm and the height of the channel is 1.7 mm according to the experiment
setup. The inlet and outlet straight channel has a length of 20 mm and the area of the
serpentine channel is 20mm by 20mm. The distance between each channel segment in
the serpentine area is 1mm. And the porous layer area is 2mm larger than the
serpentine area from each edge.
The serpentine channel is currently one of the most widely used channel
configurations in fuel cell research. This type of channel has no branches, but is bent
into several segments. In this project, we studied a calculation domain with nine
segments as indicated in Figure 4. The channel width of each segment and the
distance between adjacent segments are 2mm. The height of the channel which is
indicated by the Z direction dimension is 2mm as well. The straight segment of the
channel is 40mm in length. The porous layer attached to the channel has a thickness
14
Fig. 3. 3D domain for the validation model
The STR channel is a kind of self-draining channel studied experimentally by
previous researchers. They made a fuel cell with a STR channel to examine its
self-draining and auto-humidifying property and its influence on the fuel cell
performance. In our project, we applied a model domain with exactly the same STR
channel in the experimental research by the other researchers as shown in Figure 5
and examine the liquid water removal process within both channel and porous layers
using numerical simulation. The channel cross section is 3mm by 3mm, the length of
the square channel area is 15mm, and the length of the square porous layer area is
19mm. For the serpentine with porous layer case, the thickness of the porous layer is
also 0.3mm.
The PBB channel is a novel channel geometry proposed in this project as shown in
Figure 6. The baffles block the channel into several sections and force the fluid to go
through the porous layers attached to the channel. This enhances the gas usage
efficiency and helps the liquid water removal process from the porous layers. The
PBB channel applied in this project contains four baffle-blocked channel branches in
parallel, and each branch is blocked by three baffles with a baffle thickness of 1mm.
The channel cross section is 2mm by 2mm, the length of each channel is 11mm and
the distance between each channel is 2mm. The length of the square porous layer area
16
Fig. 5. 3D domain for STR chamber with porous layer case
3.2 Mathematical model setup
The numerical simulation in this project was applied in conjunction with the
commercial software package FLUENT 6.3.26 with a 3D unsteady VOF (volume of
fluid) model, which is suitable for locating the interface between different fluid
phases. A UDF (user defined function) is applied to export the data from the
calculation domain.
The Reynolds number in this model can be calculated by
Re ud υ
= (3.1)
here d 4A P
= (3.2)
where P is the wetted perimeter, and A is the cross sectional area.
The fluid flow applied in this project is laminar since the Reynolds number calculated
through the whole process of simulation is less than 1400. Also in this project, the
flow is considered as isothermal and without phase change as this project mainly is
concentrating on the liquid water removal process modeling.
The governing equations of mass and momentum is applied in both the channel and
the porous layer area. The conservation of mass in the channel area can be written as
(3.3)
where, in our case,
and the conservation of momentum can be expressed as
(3.4)
Here, the surface tension is accounted for by using the continuum surface force (CSF)
model [36], and is expressed in terms of the pressure jump across the interface. This
depends on the surface tension coefficient and is implemented in the momentum
equation as the source term.
(3.5)
where represents the surface tension coefficient, K represents the surface
( ) Sc
t ερ ερ ∂ + ∇ = ∂ u 0 c S = ( ) ( ) [ ] u
uu p u g Sm
t
ερ
ερ
ε
εµ
ρ
∂ + ∇ = − ∇ + ∇ ∇ + + ∂ χ( ) / 2
l m ch
l g
s S χK ρ
ρ ρ ∇ =
18
curvature. ρ and in above source terms represent the density and dynamic
viscosity in a volume fraction weighted average manner respectively. They can be
calculated using
ρ =ρg+sl(ρl−ρg) (3.6)
( )
g sl l g
µ=µ + µ −µ (3.7)
In the porous layer area, the governing equations of mass and momentum are also
applied. The conservation of mass is the same as in the channel area, and the
conservation of momentum has the same equation, but a different source term as
shown below:
(3.8)
The second term of this equation expresses the gas permeability in the porous layer
domain.
In the VOF model, different phases share the same momentum equation, and the
interface between phases is tracked throughout the domain by computing the volume
fraction for all types of fluids in each computational cell. For the two phase flow
concerned in this project, the volume fraction equation is shown below
(3.9)
and (3.10)
Where sl is the volume fraction of liquid and sg is the volume fraction of gas.
The sum of these two volume fraction functions is equal to 1, since we have only two
phases in this project.
A non-slip boundary condition is applied to the walls of the channel and porous layer.
Velocity inlet and pressure outlet are applied for the inlet and outlet of the domain. 2
( ) / 2 u
l
m p
l g g
s
S χK ρ µε
ρ ρ τ
∇
= −
+
( )
( ) 0
l l l l s s t ε ρ ε ρ ∂ + ∇ ⋅ = ∂ u 1 l g
s +s =
3.3 Grid setup
In order to use FLUENT to simulate the water removal process in both channel and
porous layers, the calculation domain is meshed with a grid of reasonable size. To
prove that the grid quantity applied in the model used in this project is reasonable for
the cases studied in later chapters, a grid check is performed with a simplified domain
including a straight channel and a porous layer attached. Three different grid sizes are
applied in this domain for comparison. The left column shows the case meshed with
0.0004 m cells, the middle column shows the results from the case meshed with
0.0002 m cells, and the right column shows the results from the case meshed with
0.0001 m cells. One droplet is set near the inlet area at the beginning for all three
cases, and the droplet deformation at different time steps are shown in Table 1.
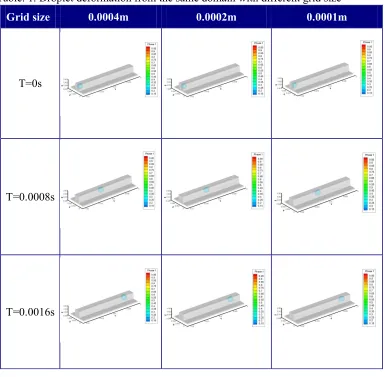
Table. 1. Droplet deformation from the same domain with different grid size
Grid size 0.0004m 0.0002m 0.0001m
T=0s
T=0.0008s
20
From the pictures in table 1, we can see that the case in the left column with a coarse
grid does not show a visible water droplet deformation along with time, while the
middle column case and the right column case show a clear shape change of the
droplet from the original sphere droplet to an egg shape with time. Theoretically for
CFD simulation, one can always achieve better results with finer mesh. However,
considering current computation capability and the time needed for simulation, the
case in the right column will consume too much resource while giving a similar result
with a 0.0002 mm mesh as in the middle column case. So in this project, the 0.0002
mm grid is applied to simulate the cases in later chapters.
In the cases we are going to discuss in later chapters, we have the grid size of 0.0002
m for each edge for the channel domain, 0.0002 m in X and Y directions, and 0.00005
m in Z direction in the porous layer domain. The time step applied in the simulations
is 10-4 s.
3.4 Initial settings of water
After the domain has been determined and the governing equations are applied to the
model, a thin water film with thickness of 0.1 mm is set in the porous layer domain
between the two planes z = 0.0001 m and z = 0.0002 m. This is seen as the red color
area indicated in Figure 7, and simulates the water generated from the common plane
between the membrane and the cathode side catalyst layer.
As shown in Figure 7 (b), the water film is placed in the middle of the porous layer,
but not adjacent to the plane z = 0 m in the porous layer, where water is generated in
the real fuel cell system. The reason for this is because the main point for this project
is to examine the water removal process, how water comes out of the porous layer and
emerges into the channel area. Varying the location of the water film at initial
conditions only changes the computational time required to witness the full effects of
water film case as our model.
(a) Liquid water film indicated by the red color (X:Y:Z=1:1:10)
(b) Liquid water film initial state sketch (–X direction view) (Y:Z = 1:10)
22 CHAPTER 4
NUMERICAL MODEL VALIDATION
4.1 Purpose of the experiment
To validate the numerical model and examine the liquid water removal process in a
single transparent PEMFC, a validation experiment is conducted. The simulation is
conducted using a numerical validation model with the same domain and same initial
settings as the experiment. Results from both experiment and simulation are
compared.
4.2 Experimental methodology
The liquid water behavior in the fluid flow paths of the PEMFC is a very important
factor influencing the fuel cell performance and the fuel cell stability. However,
visualization of the liquid water movement inside a regular PEMFC is not possible
since the channel is not exposed to human’s eyes. A single transparent PEMFC is
constructed in this experiment with the end plates fabricated from transparent
plexiglass instead of graphite. With this material change, the fluid flow inside the flow
channel can be visualized while the fuel cell system is running.
To validate the numerical model used in following chapters, the same initial
conditions are applied to both the experiment and the validation model. In order to
make sure that the initial liquid water goes into the channel at the same position of the
channel with same flow rate in both experiment and numerical model, a syringe is
inserted into the cathode side flow channel of the transparent PEMFC in the
experiment. The needle outlet is fixed at the same position as the liquid water inlet in
the numerical validation model. And the flow rate of the liquid water injection is
recorded from the experiment and set in the validation model.
After these settings, the transparent fuel cell is placed horizontally with the cathode
the desired air flow to the fuel cell. A camera is fixed above the transparent fuel cell to
record the liquid water removal process inside the flow channel.
These methods to do the experiments are discussed and optimized by the author and
Le [37] together.
4.3 Experiment setup
4.3.1 Construction of the test bench
To do a fuel cell experiment, a test bench is needed to run the fuel cell system. For
validating the numerical model used in later chapters, the test bench in the group lab
[38] is modified by the author and Le [37] to a structure as shown in the schematic in
Figure 8.
Fig. 8. Schematic of the test bench for the validation experiment
The fuel cell is horizontally fixed on a stable frame, and the syringe for injecting
liquid water droplet to the cathode channel enters from the bottom through the anode
side and MEA. Air flow supplied from an air cylinder passes a mass flow controller
and a pressure sensor and goes into the inlet of the transparent fuel cell. The flow rate
and the inlet air pressure are recorded using the Labview control panel installed in the
24
fuel cell records the liquid water removal process inside the cathode side channel
when the fuel cell system is running.
4.3.2 Transparent fuel cell
The transparent fuel cell is a single PEMFC with flow channel in a serpentine shape
as the left channel shown in Figure 9. This fuel cell is designed by the author using
the software package CATIA. The end plate of this fuel cell is made from plexiglass
to make it transparent, so that the liquid water motion inside the serpentine channel
can be recorded by the camera positioned directly above the horizontally placed fuel
cell.
Fig. 9. A picture of the transparent fuel cell used in the experiment
A supporting frame is designed to support and fix the fuel cell horizontally with the
cathode side facing up, so that the fluid flow in the channel will be influenced by the
gravity only from the direction perpendicular to the MEA, and the cathode side where
water is produced in the real fuel cell system can be recorded using the camera.
In this experiment, since the research concentrates on the liquid water removal
process inside the cathode side of a PEMFC, the anode side flow channel and the
isolation between the cathode side and the Anode side in the experiment setup is
side channel to inject the liquid water droplet. In this way, the initial liquid water
droplet in the desired position can be achieved. In the mean time the vision of the
camera will not be blocked.
4.3.3 Camera
A commercial camera is used in this experiment to capture the liquid water movement
inside the fuel cell channel. The model number of this camera is JVC GZ-MG37. The
pixel is 800.0 x, and the frame rate is 30 pictures per second.
Fig. 10. A picture of the commercial camera used in the experiment
4.4 Initial setting of the fluids
4.4.1 Air inlet mass flow rate
In the experiment done by the author, the air flow rate at the air inlet area of the
transparent fuel cell is 1.07 L/min during the whole process according to the mass
flow controller connected in the system. To set the same condition in the validation
model, the air inlet mass flow rate is calculated as below.
3 5
, 1.225 / 1.07 / min 2.18 10 /
air in air air
26 4.4.2 Liquid water inlet mass flow rate
To control and record the liquid water inlet flow rate, a syringe is used to inject the
liquid water with approximately uniform velocity into the flow channel in the
experiment. The initial volume of the liquid water inside the syringe is recorded at the
beginning before the experiment is conducted, and the time of the liquid water
injection during the experiment is recorded. Finally the volume of the liquid water left
inside the syringe after the experiment is recorded as well. By subtracting the volume
of the liquid water left inside the syringe after the experiment from the initial volume
of the liquid water inside the syringe, the total volume of liquid water which is
injected into the channel during the experiment can be determined. Dividing this
volume by the time of the liquid water injection, the average volume flow rate of the
liquid water injection in the author’s experiment is calculated as indicated in the
equation below.
8 3 0.9 0.6
3 10 / 10
initial left liquid
V V mL mL
V m s
t s
−
− −
= = = ×
ɺ (4.2)
To set the same condition in the validation model, the liquid water inlet mass flow rate
is calculated as below.
3 8 3 5
, 999 / 3 10 / 3 10 /
liquid in liquid liquid
m ρ V kg m − m s − kg s
= ɺ = × × = ×
ɺ (4.3)
4.4.3 Contact angle
To measure the contact angle of the droplet contacting different channel walls, one
droplet is put on each piece of material used to build up the channel of the PEMFC,
and pictures are taken from the horizontal direction. The contact angles are measured
from these pictures using a protractor. The results show that the air-liquid water
contact angle contacting the MEA is 130° as shown in Figure 11, the air-liquid water
contact angle contacting the stainless steel flow field plate is 53° as shown in Figure
12, and the air-liquid water contact angle contacting the transparent end plate is 43° as
Fig. 11. Contact angle measured with one liquid water droplet on the MEA
Fig. 12. Contact angle measured with one liquid water droplet on the stainless steel flow field plate
28 4.5 Experiment results and analysis
The results from the author’s experiment are shown in Figure 14. To better visualize
the liquid water inside the channel, the liquid water is dyed with red color. Droplets
are injected at the inlet area of the serpentine channel in sequence. Once the droplet
left the head of the syringe and passes into the channel, it goes quickly along the flow
direction and hits the wall at the bending area. The liquid water tends to accumulated
at this area for a short time. Then it becomes a slot moving along the flow direction
attached with the side wall of the channel. Mostly this liquid water slot sticks to one
wall of the channel during the whole removal process in the fuel cell channel. A
thicker area at the head of the liquid water slot can be observed sometimes when the
slot reaches a bend in the channel. This is due to the centrifugal effect when the fluid
meets a turn. Finally the liquid water will gradually be drained out of the channel
through the outlet.
(b) t = 0.13 s; Liquid water accumulated at the bending area of the first segment
in the channel
(c) t = 0.77 s; Liquid water slot stick to the channel wall and move along the flow
30
(d) A thicker area at the head of the liquid water slot observed when the slot
reaches the bending area of the channel
(e) t = 1 s; The liquid water slot approaching the outlet of the channel
4.6 Comparison of the numerical simulation results and experiment results
4.6.1 Image comparison
A numerical model with the same domain from the experiment setup is designed and
created by the author and Le [37] together. The liquid water removal process from the
numerical model with the initial conditions same as in the author’s experiment is
studied by the author, and the results from this model are compared with the
experiment results as in Figure 15. To compare these two results, t = 0 s is artificially
set to the instant when the first liquid water droplet is injected into the channel but has
not yet fully departed the syringe as indicated in Figure 15 (a). As Figure 15 (b) shows,
the droplets that are injected into the channel move with the gas flow to the first bend
area of the serpentine channel, and hit the wall in front of it. A part of the liquid water
from this droplet become tiny droplets and are drained with the flow, while another
part of the liquid water accumulate at the bend area for a short period of time. After
that, the liquid water forms a slot and moves along with the gas flow attaching to the
wall of the channel as shown in Figure 15 (c) to (j). Finally at t = 1 s, the liquid water
slot approaches the outlet of the channel. It can be seen from this comparison that the
liquid water position in the channel in both simulation and experiment are
qualitatively the same.
32
(b)Liquid water accumulated at the bending area of the first segment in the
channel; figure captured at t = 0.145 s from numerical model and figure
captured at 0.13 s from experiment
(c) t = 0.2 s; Liquid water move along the second segment of the channel
(e) t = 0.4 s; Liquid water reaches a bending area of the channel
(f) t = 0.5 s; Liquid water slot moves along with the gas flow to the forth segment
of the channel
34
(h)t = 0.7 s; Liquid water slot reaches a bending area again
(i) t = 0.8 s; Liquid water slot stick to the channel wall and move to the sixth
segment of the channel
(k) Liquid water approach the outlet of the channel; figure captured at t = 0.97 s
from the numerical model and figure captured at t = 1 s from the experiment
Fig. 15. Liquid water removal process comparison from both the validation model and
the experiment
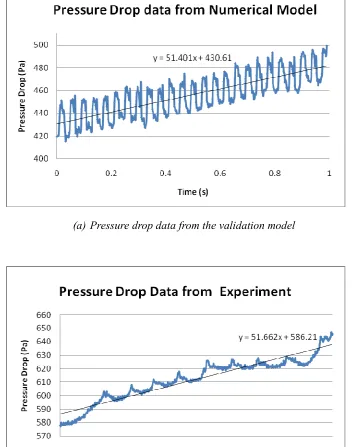
4.6.2 Pressure drop comparison
To further validate the numerical model applied in this project, the pressure drop data
from both the experiment and the validation model are compared. The pressure drop
data from the validation model is collected using the UDF function in Fluent [37], and
the result is shown in Figure 16 (a), the pressure drop in the calculation domain starts
to increase when the liquid water is injected into the channel. It continues to go higher
along with time as more liquid water is injected. Fluctuations are observed, the peaks
of these fluctuations correspond each liquid water droplet injected into the channel.
Notice that though there are fluctuations observed, the overall trend of the pressure
data is increasing from approximately 430 Pa to 480 Pa gradually. The pressure drop
data from the experiment is shown in Figure 16 (b), the trend of the pressure drop
along with time measured from the transparent fuel cell is quite similar with the data
from the numerical validation model. A similar growth rate is indicated by the slope
of the linear trend line from both numerical and experimental data. However most of
the fluctuations captured from the validation model are not captured by the pressure
36
sensitivity and the flexibility of the hose used to connect the inlet of the transparent
fuel cell to the test bench. Also the equipment used in the experiment usually responds
to the data somewhat late causing the subtle change of the data not well detected. The
hose in the experiment system as well as the part of the fuel cell channel that is longer
than the calculation domain in the experiment setup and the manifold in the
experiment system also induce a higher pressure drop. This can be observed by
comparing the pressure drop data at each time instant from Figure 16 (a) and (b). The
pressure drop in the connected hose is measured to be 20 Pa from the experimental
setup. The extra pressure drop caused by the experiment setup can be calculated by
using Darcy formulation [37] for the laminar flow.
2 2 avg L V L P f D ρ ∆ = (4.4)
Here ρVavg2 / 2 is the dynamic pressure and f is the Darcy friction factor.
The pressure drop in the manifold is
2 2
1
64 64 0.1 1.225 5.25
88 Pa Re 2 612.5 0.002 2
avg V L P D ρ × ∆ = = = (4.5)
And the pressure drop in the extra channel is
2 2
2
57 57 0.07 1.225 5.25
61 Pa Re 2 612.5 0.0018 2
avg V L P D ρ × ∆ = = = (4.6)
Thus, the total pressure drop due to connection is approximate 169 Pa. By deducting
this number, the pressure drop data from the validation model and the experiment are
(a) Pressure drop data from the validation model
(b)Pressure drop data from the experiment
38 4.7Summary
1. The feature of the liquid water movement in the channel is approximately the
same in the experiment result and the numerical result.
2. The time for each stage of the liquid water movement in the channel is similar
from the experiment result and the numerical result.
3. The pressure drop during the whole process of liquid water removal is similar
from the experiment result and the numerical result. Some fluctuations are not
captured in the experiment result due to the relatively low sensitivity and the
flexibility of the hose used to connect the inlet of the transparent fuel cell to
the test bench. Also the equipment used in the experiment usually responds to
CHAPTER 5
LIQUID WATER REMOVAL PROCESS IN SERPENTINE CHANNEL WITH POROUS LAYER
5.1 General process of liquid water removal
To show the water removal process, global water movement in this case is studied
step by step. As can be seen in Figure 17, liquid water begins to emerge into the
channel from the corner area a short period after the simulation begins. Most of the
droplets emerged into the channel move along with the gas flow attached to the wall
of the channel and are finally purged through the outlet. However some of them will
be trapped at the corner area. While a portion of the liquid water comes into the
channel area from the porous layer, another part of the liquid water remains inside the
porous layer becoming oscillating droplets and will be removed more slowly than the
other part.
40
(b) t = 0.36 s
(c) t = 0.56 s
5.2 Liquid water emerging into the channel from porous layer
From Figure 17 (a) we can see that water starts to emerge into the channel area a short
time after the simulation begins. It was observed that most of the water which
emerged into the channel domain will stay attached to at least one wall of the channel,
and move along the general gas flow direction. When the droplets get to the bend area
of the channel, most of them will be held in a certain position near the corner and
oscillate for a period of time as shown in Figure 18. This is due to the back flow
region that appears at the bend areas when the gas meets the wall. The water droplet
which is held there by the back flow will grow larger and larger along with time as
more droplets come to the same position and join the previous droplet. When this
droplet reaches a certain volume, it will move forward along the general flow
direction and collide with the wall in front of it. A part of this volume of liquid water
will become small free droplets move along with the flow to the next segment of the
channel, while another part of it will be trapped in the corner area or suspended near
the corner area as shown in Figure 19. This trapped or suspended water at the corner
area phenomenon is very similar to the phenomenon observed by Spernjak et al. [40]
from their experimental results. The pictures shown in Figure 18 and Figure 19 are the
section of the calculation domain at x = 0.02105 m, which shows the phenomena
mentioned above clearly.
Some of the small droplets that emerged into the channel from the porous layer will
stay in a certain position inside the channel attached to the porous layer until a larger
droplet meets it as shown in Figure 20, and sometimes two moving droplets will meet
each other in the channel as well. Subsequently, the combined larger droplets will
reach the position near the bend area where the droplets are held and oscillate for a
while until a certain volume of liquid water is reached, then collide at the corner.
Within all these processes, the droplets are attached to at least one wall of the channel,
while only a few of the smallest droplets become free droplets that move with the
flow and are drained out directly. Figure 20 indicates the section of the calculation
42
In Figures 18 to 20, it can be seen that the droplets in these pictures are not as round
as one would expect. Instead, they are in a shape of sharp triangles. This is because
the ratio of Y and Z axis has been adjusted to 1:10 in these pictures so that the liquid
water can be seen clearly. If shown in regular ratio, the water droplets which emerged
into the channel domain are in fact round. Also, as mentioned in the previous
paragraph, the sections in Figures 18 to 20 are all near one wall of the channel. This is
because the droplets observed in these pictures are attached not only to one wall of the
channel. They attach to the common plane of the channel and porous layer, and are
also attached to a wall of the channel which is perpendicular to the porous layer.
(a)t = 0.28 s
(c) t = 0.32 s
(d)t = 0.34 s
44
(f) t = 0.38 s
Fig. 18. The droplet held near the bending area of the channel due to the back flow
(a)t = 0.69 s
(c) t = 0.73 s
(d)t = 0.75 s
46
(f) t = 0.79 s
Fig. 19. The droplet collides with the wall at the bend area of the channel
(a)t = 0.452 s
(c) t = 0.458 s
(d)t = 0.461 s
(e) t = 0.464 s