Efficient Cluster Based Classification in Big
Data Analysis using Support Vector Machine
Seema Bawgi, Dr.Kavitha.K.S
M. Tech Student, Dept. of CSE, Global Academy of Technology, Bengaluru, India
Professor, Dept. of CSE, Global Academy of Technology, Bengaluru, India
ABSTRACT: The need for efficient environmental science has increased along with the rise of the information era and “big data across all field in society. Big data generally refer to huge data which cannot be handled with human analysis, Machine learning approach is an approach used for classification patterns and application of artificial intelligence, etc. In this project we are implementing an effective algorithm for data analysis by extracting features and adapting machine learning approach called SVM. This paper presents a new method, Clustering-Based SVM (CB-SVM), which is specifically designed for handling very large data sets. CB-SVM applies a hierarchical micro-clustering algorithm that accounts the entire data set only once to provide an SVM with high quality samples that carry the statistical summaries of the data such that the summaries maximize the benefit of learning the SVM. CB-SVM tries to generate the best SVM boundary for very large data sets given limited amount of resources.
KEYWORDS: CB-SVM, Gabor Features, Big data.
I. INTRODUCTION
Big data study is the process of examining huge data items which belongs a varies data types i.e., big data is used to know the hidden patterns, unknown correlations, market analysis, customer choices scale and other useful business informatics. The analytical findings can be helpful in analyzing effective marketing, new revenue opportunities, better customer service, improved operational efficiency, competitive advantages over rival organizations and other business benefits.
The main goal of big data analytics is to support companies make more useful business decisions by enabling data scientists, predictive modellers and other analytics professionals to analyze large volumes of transaction data, which is impossible to handle by human. That could include Web server logs and Internet click stream data, social media content and social network activity reports, text from customer emails and survey responses, mobile-phone call detail records and machine data captured by sensors connected to the Internet of Things.
Some people exclusively associate big data with semi-structured and unstructured data of that sort, but consulting firms like Gartner Inc. and Forrester Research Inc. also consider transactions and other structured data to be valid components of big data analytics applications. Big data can be analyzed with the software tools commonly used as part of advanced analytics disciplines such as predictive analytics, data mining, text analytics and statistical analysis. Mainstream BI software and data visualization tools can also play a role in the analysis process. But the semi-structured and unstructured data may not fit well in traditional data warehouses based on relational databases.
II. RELATED WORK
Jianqing Fan et.al in his paper [1] discusses statistical methods for estimating complex correlation structure from large pharmacogenomic datasets. We selectively overview several prominent statistical methods for estimating large covariance matrix for understanding correlation structure, inverse covariance matrix for network modeling, large-scale simultaneous tests for selecting significantly differently expressed genes and proteins and genetic markers for complex diseases, and high dimensional variable selection for identify important molecules for understanding molecule mechanisms in pharma cogenomics. Their applications to gene network estimation and biomarker selection are used to illustrate the methodological power. Several new challenges of Big data analysis, including complex data distribution, missing data, measurement error, spurious correlation, endogeneity, and the need for robust statistical methods, are also discussed.
Many believe that “big data” will transform business, government, and other aspects of the economy. Liran Einav in his article he discuss how new data may impact economic policy and economic research. [2] Large- scale administrative data sets and proprietary private sector data can greatly improve the way we measure, track, and describe economic activity. They can also enable novel research designs that allow researchers to trace the consequences of different events or policies. We outline some of the challenges in accessing and making use of these data. We also consider whether the big data predictive modeling tools that have emerged in statistics and computer science may prove useful in economics.
Big Data are becoming a new technology focus both in science and in industry. This paper discusses the challenges that are imposed by Big Data on the modern and future Scientific Data Infrastructure (SDI).[3] The paper discusses a nature and definition of Big Data that include such features as Volume, Velocity, Variety, Value and Veracity.
Jia Deng et.al [7] and Ritendra Datta [8] et.al also proposed a method for image retrieval from huge data. The paper refers to different scientific communities to define requirements on data management, access control and security. The paper introduces the Scientific Data Lifecycle Management (SDLM) model that includes all the major stages and reflects specifics in data management in modern e-Science. The paper proposes the SDI generic architecture model that provides a basis for building interoperable data or project centric SDI using modern technologies and best practices. The paper explains how the proposed models SDLM and SDI can be naturally implemented using modern cloud based infrastructure services provisioning model and suggests the major infrastructure components for Big Data Infrastructure.
On-command Digital universe with data prolifering by Institutions, Individuals and Machines at a very high rate. This data is categories as "Big Data"[4] due to its sheer Volume, Variety, Velocity and Veracity. Most of this data is unstructured, quasi structured or semi structured and it is heterogeneous in nature. The volume and the heterogeneity of data with the speed it is generated, makes it difficult for the present computing infrastructure to manage Big Data. Traditional data management, warehousing and analysis systems fall short of tools to analyze this data. Due to its specific nature of Big Data, it is stored in distributed file system architectures. Hadoop and HDFS by Apache is widely used for storing and managing Big Data. Analyzing Big Data is a challenging task as it involves large distributed file systems which should be fault tolerant, flexible and scalable. Map Reduce is widely been used for the efficient analysis of Big Data. Traditional DBMS techniques like Joins and Indexing and other techniques like graph search is used for classification and clustering of Big Data. [4] These techniques are being adopted to be used in Map Reduce. In this research paper the authors suggest various methods for catering to the problems in hand through Map Reduce framework over Hadoop Distributed File System.
The era of big data need not be propelled only by “big science” – the term used to describe large-scale efforts that have had mixed success in the individual-driven culture of ecology. Collectively, ecologists already have big data to bolster the scientific effort – a large volume of distributed, high-value information – but many simply fail to contribute. We encourage ecologists to join the larger scientific community in global initiatives to address major scientific and societal problems by bringing their distributed data to the table and harnessing its collective power.
III. PROPOSED SYSTEM
Figure 1 shows the block diagram of proposed architecture. The methodology consists of two major phases. One is the training phase and the other is the testing phase. Training phase consists of reading the data, pre-processing, extraction of useful features and train the feature vector. The first step is reading and pre-processing of data from the database consists of data that are to be trained. Pre-processing is the step that makes data to accessible form. This step includes resizing, rearranging, etc. After the data is pre-processed we extract the useful and unique features that help for differentiating the data. Using CB-support vector machine these feature vectors are trained. Trained data will be stored in a knowledge base.
Testing phase is the evaluation phase. Here input data is given for test. Input data involved for pre-processing and feature extraction. After feature vector is extracted from the test data the feature vector is recognized using CB-SVM classifier by using trained knowledge. Finally the test data is categorized based on the classification result.
Figure 1: Architecture of Proposed System
A. Preprocessing
Input image is applied with image pre-processing steps to enhance the visual appearance of images. Color conversion to gray image and resizing is applied. Pre-processing is followed by feature extraction.
B. Gabor Feature
The Gabor filter is generally utilized as a part of the image features. The Gabor filter wavelet is the type of sine wave adjusted by the Gaussian coefficient. The Gabor filter is helpful for extracting local and global data. The Gabor filter are tunable band pass channel, multistage and multi resolution filter.
The Gabor filter eq. (1) is utilized as a part of texture segmentation, image representation. It offers ideal resolution in space and time domain. It gives better visual representation in the involved composition pictures. Be that as it may, the current Gabor parameter requires additional time utilization for feature extraction. The Gabor filter works on the frequency, orientation and Gaussian kernel.
Y = exp 2πθ(xcosθ+ ysinθ) (3)
The terms x and y (eq. 2 and eq. 3) is the position of the filter relative to the input signal [5]. The angular representation of the filter is represented as ‘θ’. The angular orientation of the filter is represented as ‘∅’.
.
C. CB-SVM Classifier
This paper presents a new approach for scalable and reliable SVM classification. The method, called Clustering-Based SVM (CB-SVM), is specifically designed for handling very large data sets. When the size of the data set is large, SVMs tend to perform worse with training from the entire data than training from a fine quality of samples of the data set. Selective sampling (or active learning) techniques with SVMs try to sample the training data intelligently to maximize the performance of SVMs, but they normally require many scans of the entire data set.
Our CB-SVM using the similar idea applies a hierarchical micro-clustering algorithm that scans the entire data set only once to provide an SVM with high quality samples that carry the statistical summaries of the data such that the summaries maximize the benefit of learning the SVM. CB-SVM is scalable in terms of the training efficiency while maximizing the performance of SVMs.
The key idea of CB-SVM is to use a hierarchical micro-clustering technique to get finer description closer to the boundary and coarser description farther from the boundary, which can be efficiently processed as follows: CB-SVM first constructs two micro-cluster trees from positive and negative training data respectively. In each tree, a node in a higher level is a summarized representation of its children nodes.
After constructing the two trees, CB-SVM start training an SVM only from the root nodes. Once it generates the “rough” boundary from the root nodes, it selectively decluster only the data summary near to the boundary into lower (or finer) levels using the tree structure. The hierarchical representation of the data summaries is a perfect base structure for CB-SVM to perform the selective declustering effectively. CB-SVM repeats this selective declustering to the leaf level.
IV. RESULTS AND DISCUSSION
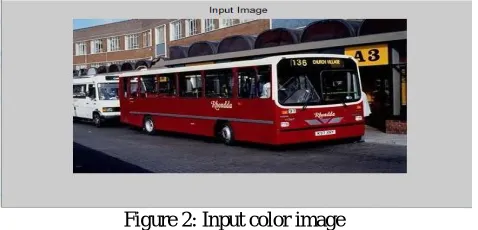
Below Figure 2 shows the input image of testing phase. Input image is applied with pre-processing steps like color conversion as show in figure 3.
Figure 2: Input color image
Figure 3: Color Converted Input Image
Using CB-SVM classifier image is retrieved, which is shown in the Figure 4.
Figure 4: Retrieved Images
V. CONCLUSION
The proposed system integrates scalable clustering method with an SVM classifier which is suitable for large set of database. The primitive SVM is not feasible for huge data set due to complexity in volume. CB-SVM gives out the best boundary for large data set. CB-SVM applies a hierarchical micro-clustering algorithm that scans the entire data set only once to provide an SVM with high quality micro-clusters that carry the statistical summaries of the data such that the summaries maximize the benefit of learning the SVM.
REFERENCES
[1] Jianqing Fan and Han Liu, “Statistical Analysis of Big Data on Pharmacogenomics”, Advanced Drug Delivery Reviews, 2013. [2] Liran Einav, Jonathan Levin, “The Data Revolution and Economic Analysis”, National Bureau of Economic Research, 2014.
[3] Yuri Demchenko, Paola Grosso, Cees de Laat and Peter Membrey, “Addressing Big Data Issues in Scientific Data Infrastructure”, Collaboration Technologies and Systems, 2013.
[4] Puneet Singh Duggal and Sanchita Paul, “Big Data Analysis: Challenges and Solutions”, International Conference on Cloud, 2013.
[5] Stephanie E Hampton, Carly A Strasser, Joshua J Tewksbury, Wendy K Gram, Amber E Budden, Archer L Batcheller, Clifford S Duke, and John H Porter, “Big data and the future of ecology”, The Ecological Society of America, 2013.
[6] Hwanjo yu, jiong yang, jiawei han, xiaolei li. “making svms scalable to large data sets using hierarchical cluster indexing”. submission to data mining and knowledge discovery: an international journal.