http://www.sciencepublishinggroup.com/j/ajtas doi: 10.11648/j.ajtas.20170602.16
ISSN: 2326-8999 (Print); ISSN: 2326-9006 (Online)
Application of Central Composite Design Based Response
Surface Methodology in Parameter Optimization of
Watermelon Fruit Weight Using Organic Manure
Dennis K. Muriithi
1, J. K. Arap Koske
2, Geofrey K. Gathungu
31
Department of Business Administration, Chuka University, Chuka, Kenya
2Department of Statistics & Computer Science, Moi University, Eldoret, Kenya 3Department of Plant Sciences, Chuka University, Chuka, Kenya
Email address:
[email protected] (D. K. Muriithi)
To cite this article:
Dennis K. Muriithi, J. K. Arap Koske, Geofrey K. Gathungu. Application of Central Composite Design Based Response Surface
Methodology in Parameter Optimization of Watermelon Fruit Weight Using Organic Manure. American Journal of Theoretical and Applied Statistics. Vol. 6, No. 2, 2017, pp. 108-116. doi: 10.11648/j.ajtas.20170602.16
Received: January 17, 2017; Accepted: February 8, 2017; Published: March 18, 2017
Abstract:
Response Surface Methodology (RSM) is a critical technology in developing new processes, optimizing their performance and improving the design. In Kenya, watermelon cultivation is gradually gaining ground. It is a crop with huge economic importance to man as well as highly nutritious, sweet and thirst- quenching. In order to increase crop production, there is need to increase soil nutrient content with organic manure such as poultry, cow or other animal wastes. At present, there are no recommended standards with respect to rate of poultry manure, cow manure and goat manure for enhancement of yield of watermelon in Kenya. The main objective of the study was to develop an approach for better understanding of the relationship between variables and response for optimum operating settings for maximum yield of watermelon crop using Central Composite Design and Response Surface Methodology. Response Surface Model evolved for response shown the effect of each input parameter and its interaction with other parameters, depicting the trend of response. Verification of the Fitness of the model using ANOVA technique shows that the model can be used with confidence level of 0.95, for watermelon production. Further validation of the model done with the additional experimental data collected demonstrates that the model have high reliability for adoption within the chosen range of parameters. The optimal value for each factor was found as 17.13tons/Ha of poultry manure, 13.3tons/Ha of cow manure and 18.1tons/Ha of goat manure. At optimal conditions, the actual value of the fruit weight of watermelon was 93.148tons/Ha. This translates to 37.3tons per acre piece of land of watermelon fruit weight for a period of 75-85 days after sowing. In addition, a peasant farmer can generate about 745,184 Kenya shillings within a period of 75 day in one acre piece of land at a low price of Kshs 20 per kilogram of watermelon fruit. RSM has resulted in saving of considerable amount of time and money hence recommended in similar study.Keywords: Central Composite Design, Response Surface Methodology, Model, Optimization, Watermelon, Fruit Weight,
Organic Manure1. Introduction
Watermelon (Citrullus lanatus thumb) is a member of the cucurbitaceous family. According to Jarret [6], it originated from the Kalahari and Sahara deserts in Africa. In Kenya, the crop is mainly grown in lower and dry Semi-arid areas of the Country, namely Nyanza, Central, Eastern, Coast and Rift valley regions. Watermelon is a crop with huge economic importance to man as well as
encouraging because of rapid reduction in soil fertility caused by both continuous cropping and use of inappropriate soil amendment materials. One of the ways of increasing the soil fertility is by application of organic material such as poultry manure, cow manure, and goat manure which are available in most parts of the country. Animal waste is essential for establishing and maintaining the optimum soil physical, chemical and biological condition that are appropriate for plant growth and development. Although readily available, utilization of these organic manures in watermelons has not been optimized for increased plant growth and fruit production.
Response surface methodology (RSM) is an important subject in the statistical design of experiment. RSM is a collection of statistical and mathematical techniques useful for developing, improving, and optimizing processes Myers [13]. It also has important applications in the design, development and formulation of new products, as well as in the improvement of existing product designs. For instance, the growth of a plant is affected by a certain amount of water x1 and sunshine x2. The plant can grow under any
combination of treatment x1 and x2. Therefore, water and
sunshine can vary continuously. When treatments are from a continuous range of values, then a response surface methodology is useful for developing, improving and optimizing the response variable. In this case, the growth of a plant is the response variable, y and it is a function of water and sunshine.
y=f(x1, x2) + e
The variable x1, and x2 are predictor variables upon
which the response y depends on. The dependent variable y is a function of x1, x2 and the experimental error term,
denoted by e. The error term represents any measurement error on the response, as well as other type of variations not counted in the function. It is a statistical error that is assumed to be distributed normally with zero mean and variance. In most Response surface methodology problems, the true response function f is unknown. In order to develop a proper approximation for function the experimentation usually starts with a lower order polynomial in some small region. If the response can be defined by a linear function of an independent variable, then the approximation function is a first order model. This model can be expressed as follows
y=α0+ α1x1+ α2x2+ e
If there is a curvature in the response surface, then a higher degree polynomial should be used. In this, an approximating function with two variables is known as second order model given as follows.
y=α0+ α1x1+ α2x2+ α11x21 + α22x22+ α12x1x2+e
In order to get the most efficient result in the approximation of empirical model the proper experimental design must be used to collect data. The data is then used to
develop an empirical model that relates the process response to the factors. The Method of Least Square is used to estimate the parameters in the empirical model, Box [1]. The response surface analysis is performed by using the fitted surface. The response surface designs are types of designs for fitting response surface. These methods are exclusively used to examine the “surface” or the relationship between the response and the factors affecting the response. Regression models are used for the analysis of the response as well as the nature of the relationship between the response and the factors. Details of experimental designs for fitting response surfaces are found in Montgomery [10], Khuri [7].
In this study, Central Composite Design was used for experimental design model with 5-level- 3 factors experiment. A 5-level-3-factor central composite design was employed in watermelon crop experiment, optimization requiring 20 experimental runs. Poultry manure, Cow manure, and Goat manure were the independent variables to optimize the response of interest (fruit Weight of watermelon at maturity). This study sought to determine the application of RSM in crop production to identify the most appropriate rates of application of animal manure for yield of watermelon. The main objective of the study was to develop an approach for better understanding of the relationship between variables and response for optimum operating settings for increased growth and yield of watermelon using Central Composite Design and Response Surface Methodology.
2. Materials and Methods
2.1. Materials
Sukari F1® watermelon a newly developed variety from East Africa Seed Company was used in the study. Similarly, goat and cow manure used for the experiment was sourced from Chuka University Kairini Farm and poultry manure from local community. Data was obtained from an experiment carried out at horticultural research and teaching farm of Chuka University. A land measuring 448 meters squared (28M by16M) was selected for the study and prepared for planting. Twenty plots of 4M by3M each was made and composite soil samples collected from the plots at 0-15 cm depth in order to assess the initial soil physical and chemical properties. The composite soil samples collected from individual plots was analyzed in the laboratory to determine initial physical-chemical properties of soils for the study. Similarly, the chemical analysis of poultry, goat and cow manure used for the experiment was evaluated using appropriate method. Each plot had 3 seeds per stand at a depth of 3cm, using a spacing of 200cm by 100cm, with 100cm Alley pathways. Data on watermelon fruit weight at maturity was collected.
2.2. Response Surface Methodology
and mathematical techniques that are useful for the modeling and analysis of problems in which a response of interest is influenced by several (three) variables and the objective is to optimize this response, Montgomery [11]. The RSM enables to evaluate operation variable that may or may not have a significant effect in the main response. The design procedure of RSM is as follows;
i. Develop an original design of experiment for adequate and reliable measure of the response of interest (fruit Weight)
ii. Develop a statistical model of the second-order model with best fittings
iii. Find the optimal set of experimental parameters, that produces a maximum value of response
iv. Present the direct and interactive effect of process parameter through two and three-dimensional plots Response Surface Methodology design allows estimation of interaction and even quadratic effect and therefore, gives an idea of the shape of the response
surface under investigation. Box-Behnken design and central composite design (CCD) are an effective design for a fitting second-order model to response surface because they use a relatively small number of observations to estimate the parameters. Rotatability is a reasonable basis for the selection of a response surface design. The purpose of RSM is optimization and the location of optimum is unknown prior to running the experiment. It makes sense to use a design that provides an equal precision of estimation in all directions. The CCD and RSM is a mathematical tool for evaluating the responses necessary to optimize watermelon yields.
2.3. Design of Experiment
The experiment was carried out as a CCD consisting of 20 experimental runs determined by the 23 full factorial designs with six axial points and six center points as shown in Figure 1.
Figure 1. Layout of the Central Composite Design (CCD) for 3 variables at 5 levels.
In this study, CCD was used for experimental design model with 5-level- 3 factors experiment. A 5-level-3-factor central composite Design was employed in watermelon growth process, optimization requiring 20 experimental runs. Poultry manure (X1), cow manure (X2) and goat manure (X3)
are the independent variables to optimize the response value of interest (Fruit weight of watermelon at maturity). In
developing the regression model, the test factors were coded according to the formulae given as where xi is a
coded variable of the ith variable, X0 is an average of the
variable in high and low level, X is (variable at high level- variable at low level)/2 and Xi is an encoded value of the ith
test variables.
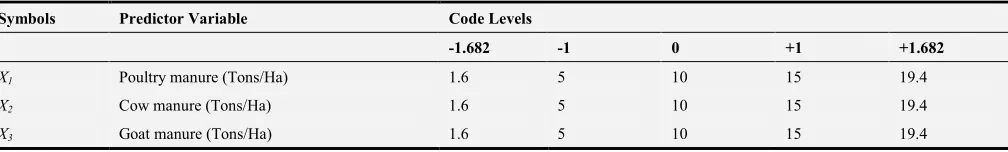
Table 1. Three Factors at Five Levels Estimated Values.
Symbols Predictor Variable Code Levels
-1.682 -1 0 +1 +1.682
X1 Poultry manure (Tons/Ha) 1.6 5 10 15 19.4
X2 Cow manure (Tons/Ha) 1.6 5 10 15 19.4
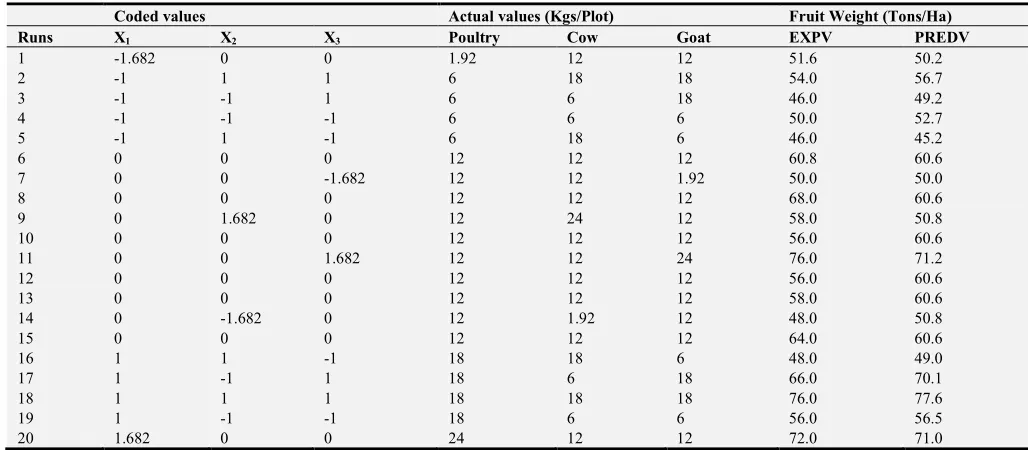
Table 2. Full Factorial Central Composite Design Matrix and Experimental Results.
Coded values Actual values (Kgs/Plot) Fruit Weight (Tons/Ha)
Runs X1 X2 X3 Poultry Cow Goat EXPV PREDV
1 -1.682 0 0 1.92 12 12 51.6 50.2
2 -1 1 1 6 18 18 54.0 56.7
3 -1 -1 1 6 6 18 46.0 49.2
4 -1 -1 -1 6 6 6 50.0 52.7
5 -1 1 -1 6 18 6 46.0 45.2
6 0 0 0 12 12 12 60.8 60.6
7 0 0 -1.682 12 12 1.92 50.0 50.0
8 0 0 0 12 12 12 68.0 60.6
9 0 1.682 0 12 24 12 58.0 50.8
10 0 0 0 12 12 12 56.0 60.6
11 0 0 1.682 12 12 24 76.0 71.2
12 0 0 0 12 12 12 56.0 60.6
13 0 0 0 12 12 12 58.0 60.6
14 0 -1.682 0 12 1.92 12 48.0 50.8
15 0 0 0 12 12 12 64.0 60.6
16 1 1 -1 18 18 6 48.0 49.0
17 1 -1 1 18 6 18 66.0 70.1
18 1 1 1 18 18 18 76.0 77.6
19 1 -1 -1 18 6 6 56.0 56.5
20 1.682 0 0 24 12 12 72.0 71.0
2.4. Mathematical Models
The second- order model representing the watermelon fruit Weight at maturity was expressed as a function of Poultry manure, cow manure and goat manure being in the input variable of watermelon response. To define the response equation, , and are assigned to poultry manure, cow manure and goat manure respectively. An appropriate polynomial (second-order) models can be expressed as;
+ + + + + +
+ + + +
Where Y is the predicted response, Xi represent the control
factors in the experimental data, isthe constant, is the linear coefficient, is the quadratic coefficient and is the cross-product coefficient (For i=1,2,3; j=2,3 and i<j).
2.5. Analysis of Variance
ANOVA is a statistical decision-making tool used for detecting any differences in average performance of tested parameters Muriithi [12]. It employs the sum of squares and F-statistic to find out the relative importance of the analyzing process parameter, measurement errors and uncontrolled parameters. It was used to check the adequacy of the model for the response in the experimentation.
3. Empirical Results and Discussion
3.1. Model Summary Statistics
The researcher sought to evaluate the component of the second order model in order to assess its suitability and the results are portrayed in Table 3
Table 3. Model Summary Statistics.
Std. Adjusted Predicted
Source Dev. R-Squared R-Squared R-Squared PRESS
Linear 1.61 0.6618 0.5893 0.3 75.02
2FI 1.33 0.819 0.7203 0.3752 66.96
Quadratic 0.94 0.9337 0.8591 0.5489 48.34 Suggested
Cubic 0.94 0.9668 0.8587 -1.4896 266.81 Aliased
Model summary statistics focus on the model maximizing the Adjusted Squared and the Predicted Squared. R-Squared refer to a measure of proportion of the variation in the dependent variable that is explained by the independent variable for a regression model. Adjusted R-Squared it is used to adjust the statistic based on the number of independent variable in the model. It compares the explanatory power of regression model that contain different independent predictors. In this case, since the multiple regression models have more than one variable, Adjusted R-Squared is the most preferred. The study found that quadratic
model was suggested for the data fitting with an Adjusted R-Squared value of 85.91%. Model explains about 85.9% of the variability in the response variable. The adjusted R-squared is often used to summarize the fit as it takes into account the number of variables in the model. In addition, quadratic model had the highest Adjusted Squared and predicted R-Squared thus most suitable for this study.
3.2. Mathematical Model
obtained by employing a least square technique to predict quadratic polynomial model for the fruit weight of watermelon and pertinent results are presented in Table 4
Table 4. Regression Coefficients Estimates.
Variable Estimate Std. Error t-Value P-value
Constant 15.14838 0. 46321 32.703 1.69e-11 ***
X1 1.54326 0.30731 5.022 0.00052 ***
X2 0.41770 0.30731 1.359 0.20395
X3 1.56923 0.30731 5.106 0.00046 ***
X12 -0.09017 0.29912 -0.301 0.76924
X22 -0.86780 0.29912 -2.901 0.01580 *
X32 0.01587 0.29912 0.053 0.95874
X1X2 -0.06250 0.40154 -0.156 0.87941
X1X3 1.06250 0.40154 2.646 0.02448 *
X2X3 0.93750 0.40154 2.335 0.04171 *
A study by Enujeke [4] found that organic manure (especially poultry manure) is most important parameter affecting growth and production of watermelon. In order to study the interaction factors (combine effect of poultry, cow and goat manure) experiment were conducted varying physical parameter using experimental design. A multiple regression data analysis was carried out with “R-Gui” statistical package. The study found that poultry and goat manure had positive significant effect on fruit weight of watermelon at 5% significance level (P-value=0.00052<0.05 and 0.00046<0.05 respectively). In addition, it was revealed
that goat manure was slightly superior in terms of its effect on fruit weight of watermelon. This implies that a one unit change of goat or poultry manure would influence the fruit weight by a factor of 1.57 and 1.54 respectively according to the current study. This was the case because the locally available poultry manure had an element of sawdust hence affected the nutrient content level. Furthermore, cow manure had insignificant effect on the fruit weight of watermelon at 5% level (P-value=0.204>0.05). The study found that combine poultry and goat manure had a significant effect on the fruit weight of watermelon at 5% significance level since the P-value was less than 0.05. Poultry manure is the richest known animal manure Enujeke [5] and Mangila [8], and it is essential for establishing and maintaining the optimum soil physical condition for plant growth and production. Also combine cow and goat manure had a significant effect on the same at 5%. The results indicates that a one unit change in combine poultry and goat manure, the fruit weight of watermelon would change by a factor of 1.0625 whereas combine cow and goat manure would change the same by a factor of 0.9375. This implies that combine poultry and cow manure would be more superior compared to combine cow and goat manure in influencing the fruit weight of watermelon. The adjusted model obtained for watermelon production as a function of the significant variables is given in Equation below
15.148 + 1.543 + 0.418 + 1.569 − 0.868 + 1.063 + 0.938
Where represent the fruit weight (Yields) of watermelon; X1, is the Poultry manure; X2, is the Cow manure
X3 is the Goat manure
This is a coded equation, useful for identifying the relative impact of the factors by comparing the factor coefficients.
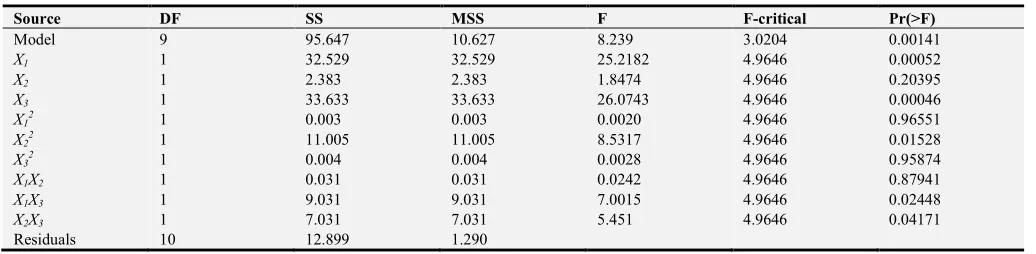
3.3. Analysis of Variance
Analysis of variance (ANOVA) was used to check the adequacy of the model for the response (fruit weight of watermelon) in the experimentation at 95% confidence level and the result are as shown in Table 5.
Table 5. Analysis of Variance.
Source DF SS MSS F F-critical Pr(>F)
Model 9 95.647 10.627 8.239 3.0204 0.00141
X1 1 32.529 32.529 25.2182 4.9646 0.00052
X2 1 2.383 2.383 1.8474 4.9646 0.20395
X3 1 33.633 33.633 26.0743 4.9646 0.00046
X12 1 0.003 0.003 0.0020 4.9646 0.96551
X22 1 11.005 11.005 8.5317 4.9646 0.01528
X32 1 0.004 0.004 0.0028 4.9646 0.95874
X1X2 1 0.031 0.031 0.0242 4.9646 0.87941
X1X3 1 9.031 9.031 7.0015 4.9646 0.02448
X2X3 1 7.031 7.031 5.451 4.9646 0.04171
Residuals 10 12.899 1.290
This study indicates that the model can be considered statistically significant according to the F-test with 95% of confidence, as the F-value of 8.24 is higher than F(9,10)=3.0204. This shows that the model is highly
statistically significant at 95% confidence level. The probability P-value is low 0.001408, indicating the significance of the model. Therefore, there is quantifiable effect of poultry, cow and goat manure on the fruit weight of
watermelon. From Table 5, it is observed that the model satisfy the adequacy conditions in non-linear form.
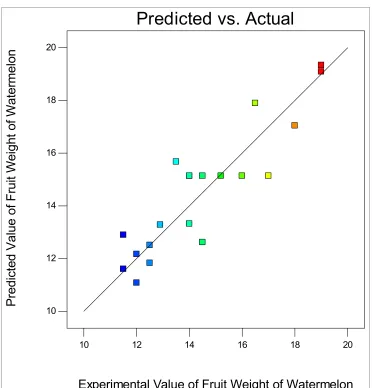
3.4. Validation of the Model
made in Figures 2.
Figure 2. Predicted Value versus Experimental value of Fruit Weight of Watermelon
In this figure the line of the best fit, represent a fairly strong fitness which the nearer experiment point to a line represent less difference with the predicted values. According to the Figure 2, an acceptable agreement can be observed between experimental results and mathematical model prediction. The more variance that is accounted for by the regression model the closer the data points will fall to the fitted regression line. Theoretically, if a model could explain 100% of the variance, the fitted values would always equal the observed values and, therefore, all the data points would fall on the fitted regression line.
3.5. Determination of the Optimal Conditions
One of the main objectives of RSM is the determination of the optimum settings of the control variables that result in a maximum (or a minimum) response over a certain region of interest. This requires having a ‘good’ fitting model that provides an adequate representation of the mean response because such a model is to be utilized to determine the value of the optimum. The pertinent results are portrayed in Table 6.
Table 6. Optimal Conditions for Maximum Fruit Weight
Variables Description Optimal Value Actual Value
X1 Poultry Manure 1.425 17.125tons/Ha
X2 Cow Manure 0.654 13.27tons/Ha
X3 Goat Manure 1.615 18.075tons/Ha
Y1 Fruit Weight 23.287 93.148tons/Ha
The optimum values of selected variables were obtained by solving the regression model and also analyzing the response surface contour plots. It was found that for a maximum (Optimal) production of watermelon fruit weight, 17.125 tons/Ha of poultry manure, 13.27 tons/Ha of cow manure and 18.08 tons/Ha of goat manure are required to produce 93.148 ton/Ha of fruit weight of watermelon. This translates to 37.26 tons per acre piece of land of watermelon fruit weight for a period of 75 -85 days after sowing. In addition, a peasant farmer can generate about 745,184 Kenya shillings within a period of 75 day in one acre piece of land. These findings were based on experiment carried out at horticultural research and teaching farm of Chuka University, Kenya.
Experimental Value of Fruit Weight of Watermelon
P
re
d
ic
te
d
V
a
lu
e
o
f
F
ru
it
W
e
ig
h
t
o
f
W
a
te
rm
e
lo
n
Predicted vs. Actual
10 12 14 16 18 20
3.6. Effect Estimates of Organic Manure on Fruit Weight of Watermelon
The study sought to establish and understand the effect of
main, quadratic and interactive effect of organic manure on fruit weight of watermelon crop production and the effect estimates are as shown in Figure 3
Figure 3. Pareto Chart of Standardized Effect on Fruit Weight of Watermelon
According to Figure 3, goat manure (X3) and poultry
manure (X1) are the most significant variables for fruit weight
of watermelon (effect of X3=5.36 and effect of X1=5.27,
followed by their interaction poultry and goat manure (effect of X1 X3=2.13), as well as cow manure (X2) and goat manure
(X3) (effect of X2 X3=1.88). In the presence of an interactive
effect, the variable cannot be analyzed separately, therefore the application of statistical method reveals the interaction (X1 X3
and X2 X3) are significant at 5% significance Level. However,
X1 X2 had negative effect (effect of X1 X2=-0.13) and
insignificant at 95% confidence level. In general, it was observed that main effects are more influential on fruit weight of watermelon crop. Plant that received adequate amount of poultry or goat manure had higher fruit weight possibly because higher rate of manure not only improve the soil conditions for crop establishment, but also released adequate nutrient element for yield enhancement. This is in harmony
with reports of Enujeke [5] and Mangila [8].
3.7. Response Surface and Contour Plots
Contour plot play a very important role in the study of the response surface. By generating contour using “Design Expert”software for response analysis, the experimenter can usually characterize the shape of the surface and locate the optimum with reasonable precision. The graphical visualization is very helpful in understanding the second-order response surface. Figure 4, 5 and 6 shows a plot of 3 dimension (3D) for different combination of variables (poultry, cow and goat manure) which exhibit the trend of variation of response (fruit weight) within the selected range of input variables and also influence of each variable over the other variable.
Figure 4. Response surface contour for interaction on yields of watermelon between Poultry and cow manure.
-1.682 -0.841 0 0.841 1.682
-1.682 -0.841
0
0.841 1.682 5
10 15 20 25
F
ru
it
w
e
ig
h
t
(K
g
s
)
Figure 4 shows fruit weight of watermelon as a function of poultry manure and cow manure. It was found that poultry and cow manure had positive effect on watermelon production; this suggests that increasing X1X2 from low to
high will increase the fruit weight of watermelon up to a certain level. The response surface corresponding to the
second order model indicates that moderately low cow manure and high poultry manure increases yields of watermelon. This is because, the previous study have found that poultry manure is rich of nutrient especially nitrogen which enhance growth and production of watermelon, Enujeke [4].
Figure 5. Response surface contour for interaction on watermelon yields between Poultry and goat manure.
Figure 5 shows fruit weight of watermelon as a function of poultry manure and goat manure. It was noted that lowering the amount of goat manure and high amount of poultry manure levels can attain maximum fruit weight. Poultry manure clearly influenced the production of watermelon yield.
Figure 6. Response surface contour for interaction on number of branches between Poultry and cow manure.
Figure 6 denotes the surface plot of the fruit weight (yields) as a function of cow and goat manure at constant/fixed poultry manure. This figure show that cow and goat manure have direct effect on the fruit weight (yields) up to a certain level and then yield’s decreases with increase of cow manure.
Combining the results presented in Figure 4, 5 and 6 watermelon production is favoured, while fruit weight is maximized (apply little amount of cow manure, high poultry manure and high goat manure levels)
-1.682 -0.841 0 0.841 1.682
-1.682 -0.841
0
0.841 1.682 5
10 15 20 25
F
ru
it
w
e
ig
h
t
(K
g
s
)
Poultry Manure Goat Manure
-1.682 -0.841 0 0.841 1.682
-1.682 -0.841
0
0.841 1.682 5
10 15 20 25
F
ru
it
w
e
ig
h
t
(K
g
s
)
4. Conclusion and Recommendation
Central composite design was successfully adopted and the experiment was designed choosing the input variables for the levels selected. Optimal conditions for yields of watermelon by the application of design of experiments using RSM were investigated. Response Surface Model evolved for response show the effect of each input parameter and its interaction with other parameters, depicting the trend of response. Verification of the Fitness of the model using ANOVA technique shows that the model can be used with confidence level of 0.95, for watermelon production. Further validation of the model done with the additional experimental data collected demonstrates that the model has high reliability for adoption within the chosen range of parameters. Surface plots generated show the trend of different responses by varying the 2 input parameters keeping the 3rd parameter constant. The optimal value for each factor was found as 17.13tons/Ha of poultry manure, 13.3tons/Ha of cow manure and 18.1tons/Ha of goat manure. At optimal conditions, the actual value of the fruit weight of watermelon was 93.148tons/Ha. This translates to 37.3tons per acre piece of land of watermelon fruit weight for a period of 75 -85 days after sowing. In addition, a peasant farmer can generate about 745,184 Kenya shillings within a period of 75 day in one acre piece of land at a low price of Kshs 20 per kilogram of watermelon fruit. With reduced number of experimental runs, fairly convincing, logical and acceptable results have been obtained, which can be followed for getting solution to optimal crop production. This has resulted in saving of considerable amount of time and money.
Acknowledgement
The Authors wish to thank the Directorate office for Research, Extension and Publication of Chuka University for the financial support.
References
[1] Box, G. E. P., W. G. Hunter and J. S. Hunter. Statistics for Experimenters: An Introduction to Design, Data Analysis andModel Building, John Wiley, New York. (1987).
[2] Boyhan, G. E. S. M. Granberry & W. T. Kelley. Soils and Fertilizer management for water melon production. The University of Georgia College of Agricultural and Environmental Sciences and the U.S. Department of Agriculture Bulletin 996, November (1999).
[3] Candioti, L. V., De, M. M., Zan, M. S., & Goicoechea, C. H. Experimental design and multiple response optimization. Using the desirability function in analytical methods development. Talanta, 124 (1) (2014), 123-138. Retrieved on October 9, 2015 (www.iosrjournals.org).
[4] Enujeke. A, Canakci. M. Optimization of pretreatment reaction for methyl ester production from chicken fat, Fuel 89 (2010): 4035-4039.
[5] Enujeke E. C. Response of Watermelon to Five different rate of Poultry Manure, IOSR-JAVS, 5 (2). (2013). PP 45-50 (www.iosrjournals.org).
[6] Jarret, B., R. Bill, W. Tom and A. Garry. Cucurbits Germplasm Report (1996). pp: 29-66. Watermelon National Germplasm System, Agricultural Service, U.S.D.A.
[7] Khuri A, Siuli M. Response Surface Methodology. Sons Inc, Wileys Coup stat 2 (2010), pp 128-149. Retrieved October 1, 2015 (www.wiley.com/wire/compstas).
[8] Mangila, E., Tabiliran, F. P., Naguit., M. R. A and Malate, R. Effects of Organic Fertilizer on the Yield of Watermelon,
Threshold 2 (2007), pp 27-35.
[9] Montgomery, Douglas C. Design and analysis of experiments:
8th Edition, New York: John Wiley & Sons; (2013). 203 pp. [10] Montgomery, Douglas C. Design and Analysis of Experiments:
Response surface method and designs. New Jersey: John Wiley and Sons, Inc. (2005).
[11] Montgomery, Douglas C. Design and Analysis of Experiments. 5th Edition, John Wiley and Sons, Inc New York, (1997). [12] Muriithi, D. K. Application of Response Surface Methodology
for Optimization of Potato Tuber Yield. American Journal of Theoretical and Applied Statistics. 4 (4) (2015). pp. 300-304.
Retrieved September 20, 2015
(http://www.sciencepublishinggroup.com/j/ajtas).
[13] Myers, R. H., Montgomery, D. C., Vining, G. G., Borror, C. M. and Kowalski, S. M. “Response Surface Methodology: A Retrospective and Literature Survey,” J. Qual. Technol., 36, (2004)., pp. 5377.
[14] Myers, R. H., Montgomery, D. C., Christine M, and Anderson C. Process and product Optimization Using Designed experiments” 3rd Edition, John Wiley & Sons New Jersey (2009).
[15] Myers, Raymond H., Khuri, Andre I. and Carter, Walter H., Jr.. Response Surface Methodology: 1966-1988.
Technometrics, 31 (2) (1989): 137-153 http://www.jstor.org [16] Oehlert, Gary W. Design and analysis of experiments:
Response surface design. New York: W. H. Freeman and Company (2000).
[17] Raheman, H., Phadatare, A. G. Diesel engine emissions and performance from blends of Karanja methyl ester and diesel.
Biomass Bioenerg. 27. (2004), 393–397.
[18] Shahin, G., Hamidi, A. A., Mohamed, H and Ali, A. Z. Application of response surface methodology (RSM) to optimize coagulation–flocculation treatment of leachate using poly-aluminum chloride (PAC) and alum, Journal of Hazardous Materials 163, (2009). 650–656, Retrieved October 9, 2015 from (www.elsevier.com).