http://www.sciencepublishinggroup.com/j/ogce doi: 10.11648/j.ogce.20180606.12
ISSN: 2376-7669 (Print); ISSN: 2376-7677(Online)
Application of Low Pressure N
2
Adsorption on Shale
Nanoscale Pore Structure: Examples from the Permian
Shanxi Formation of Transitional Facies Shale
Delu Xie
1, 2, *, Suping Yao
1, Rongjie Hu
2, Biao Liu
11School of Earth Sciences and Engineering, Nanjing University, Nanjing, China 2
National Engineering Research Center of Coal Mine Water Hazard Controlling, Suzhou, China
Email address:
*
Corresponding author
To cite this article:
Delu Xie, Suping Yao, Rongjie Hu, Biao Liu. Application of Low Pressure N2 Adsorption on Shale Nanoscale Pore Structure: Examples from
the Permian Shanxi Formation of Transitional Facies Shale. International Journal of Oil, Gas and Coal Engineering. Vol. 6, No. 6, 2018, pp. 134-141. doi: 10.11648/j.ogce.20180606.12
Received: August 15, 2018; Accepted: August 29, 2018; Published: October 12, 2018
Abstract:
Shale gas resources in transitional facies are important unconventional energy sources. In order to understand the seepage characteristics of shale reservoir, low pressure nitrogen adsorption experiment were applied to investigate the nanoscale pore structure and adsorption fractal characteristics of shale in Shanxi Formation. FHH fractal model was adopted to calculate the absorption pore fractal dimension values D and quantitatively confirm the relationship between fractal dimension values and pore parameters. Results show that distribution curve obtained by the desorption branch present pore size distribution ranges from 1.14 nm to 173.39 nm, micropores and macropores developed and concentrated, no obvious dominant peak in the mesopores (2-25 nm) with relatively uniform distribution. Fractal dimension values range from 2.42 to 2.81, indicating shale pore structure is complex and heterogeneous. Fractal dimension is positively correlated with specific surface area and total pore volume, and highly negatively correlated with the average pore diameter. Fractal dimension is also a characterization of buried depth, and there is a weak positive correlation between them. With the increase of buried depth, fractal dimension has an increasing trend. The study provides a new method to further understand the shale nanometer pore structural heterogeneity.Keywords:
Low Pressure N2 Adsorption Isotherms, Nanoscale Pore, Adsorption Characteristics, FHH Fractal Model,Shanxi Formation Shale
1. Introduction
To date, the hot spot of shale gas research is focused on the fields closely related to development technology, but the research on shale gas seepage such as adsorption and desorption is insufficient [1]. Adsorption pore is an important storage space of shale reservoir, and affects the shale gas content and even the production process by affecting the characteristics of shale gas adsorption and desorption.
The research methods of reservoir adsorption characteristics include NMR, small angle X-ray scattering (SAXS), mercury intrusion, low pressure N2 adsorption and
high resolution transmission electron microscopy [2]. Because of the complexity of pore in shale reservoir, the conventional
Euclidean geometry theory has a bottleneck in describing pore structure, so fractal geometry was proposed later. C. E. Krohn considered that the small-scale sandstone pore has fractal characteristics by SAXS, while the large-scale sandstone pores does not have fractal characteristics [3]. P. Wong et al. considered that the surface of shale pore has fractal characteristics by SAXS, which is closely related to clay properties. H. Tong (2004) used low pressure N2 adsorption
condensation-adsorption pore (> 45 ~ 285 nm) and adsorption pore (< 45 nm)[5].
Mercury porosimetry or low pressure N2 adsorption
isotherms have become the most common method for studying pore fractal [6, 7, 12]. Comparatively speaking,
mercury intrusion analysis is more common in macropore analysis [8]. Nitrogen adsorption method is more advantageous in the analysis of micropore and mesopore of mudstones in detail.
Figure 1. Geographical map of Huainan coalfield and sampling locations [10].
The lower limit of pore radius is about 0.3 nm, and the maximum pore radius is more than 100 nm. Quantitative study of shale micropores (< 2 nm) has exceeded the available range of pore size larger than 7.5 nm obtained by mercury intrusion [9]. In this paper, the adsorption characteristics of adsorption pore of Shanxi Formation shale samples in Huainan coalfield were studied by low pressure N2 adsorption isotherms. The
fractal dimension of adsorption pore was calculated by FHH fractal model, and the relationship between fractal dimension and pore parameters was discussed.
2. Samples and Experiments
2.1. Sample Collection and Preparation
The main structural form of Huainan coalfield is compound syncline along NWW orientation, and the folds and fault structures are developed in general [10]. The sampling well is located in southern Huainan coalfield (Figure 1). The main coal-bearing rock series in Huainan coalfield include Permian Lower Shihezi Formation and Shanxi Formation. Coal seam, mudstone, shale, interbedded sandstone-mudstones, siltstone and medium-fine sandstone are are extensively developed. The thickness of mudstone and shale accounts for about 1/4 of the total thickness of the strata, forming in the transitional delta environment of marine and continental facies [11].
More than 300 drilling samples were collected in this work. Six representative shale samples numbered as PQ-226, PQ-247, PQ-252, PQ-259, PQ-268, PQ-284 from Shanxi Formation were selected from top to bottom to perform low pressure N2 adsorption isothermal measurement.
2.2. Analytical Methods
Low-pressure (0–101.3 kPa) N2 isotherms were performed
at the State Key Laboratory for Mineral Deposits of Nanjing
University. Prior to the N2 adsorption experiments, samples
were automatically degassed at~110℃ for about 14 h in a vacuum oven. N2 adsorption data were collected at 77 K using
Quanta chrome Autosorb-1 on 60 mesh samples. The relative pressure (p/p0) for N2 ranges from 0.009 to 0.995. During the
analysis, an automatic equilibrium-detection algorithm was employed to determine when equilibrium had been achieved between the adsorbed and the unadsorbed phases prior to isotherm data collection. The N2 data collected on crushed
samples were interpreted using the multi-point Brunauer– Emmett–Teller (BET) model for specific surface area (SSA) [13] and Barrett–Joyner–Halenda (BJH) model for total pore volume [14-15].
2.3. Fractal Model
Reservoir rock structure generally has fractal characteristics. Referring to the relatively mature fractal research on coal reservoirs at home and abroad [22-23], FHH model is a most widely used volume fractal model reflecting the pore volume heterogeneity
Ln (V/V0)=λln (ln (p0/p))+K (1)
where p0 is the saturated vapor pressure; V0 is the gas volume
of monolayer adsorption; V is the gas adsorption volume at the balance pressure p; λ is the slope of ln (V/V0) and ln (ln (p0/p))
is the double logarithmic coordinate; K is a constant, and the volume fractal dimension D= D=3+λ [24]. If there are fractal characteristics of pores, there is a linear relationship between lnV and ln (ln (p0/p)).
3. Result
3.1. Adsorption Parameters and Pore Size Distribution
3.53 to 30.04m2/g by BET model, with an average of 20.94 m2/g (Table 1). Compared with Berea sandstones studied by Donaldson, the SSA of shales is about 20 times than that of sandstones. Shale has a larger specific surface area, which is related to its relatively high content of clay minerals and fine particles with larger SSA than coarse-grained minerals, making gas adsorption capacity storage more stronger. The total pore volume ranges from 0.0391 to 0.0822 ml/g with an average of 0.06450 ml/g, which is closely related to the ultra-low pore properties of shale, and the average pore diameter ranges from 6.01 to 49.56 nm.
According to the QSDFT model [16-17] and the IUPAC classification standard, the pore size distribution curve is obtained by using the desorption branch data (Figure 2). The curve reflects the distribution of micropores, mesopores and macropores in shale samples. (1) The pore size ranges from
1.14 nm to 173.39 nm; (2) The pore size distribution curve shows multi-peak distribution, and the peak value is related to the amount of pores. The width of the curve indicates the concentration or dispersion of pore size distribution. As seen in Figure 2, peak (a) corresponds to pore diameter of 1.03~2.16 nm and the peak value is 1.66 nm, indicating that the sample is rich in micropores and very concentrated in this stage; the results are consistent with the distribution of micropores in the shale samples studied in Barnett and other areas in North America [18]; dominant peak (b) corresponds to pore diameter of 54.83~72.27 nm, reflecting that macropores account for the considerable proportion in pore types; (3) No obvious dominant peak was found in the mesopores (2-50 nm), reflecting the pore distribution was relatively uniform in this stage.
Table 1. Types of isothermal curves and adsorption pore structural parameters of shale by low-temperature nitrogen.
Sample ID BET SSA (m2/g) Total pore volume (ml/g) Average pore diameter (nm) p/p0
PQ-226 30.08835 0.0756 6.998178 0.0504~0.9962
PQ-247 3.531855 0.0391 49.56084 0.0548~0.9951
PQ-252 13.9628 0.066 29.1361 0.0491~0.9964
PQ-259 25.14216 0.0726 6.010446 0.0501~0.9945
PQ-268 26.90565 0.0822 13.32519 0.0498~0.9943
PQ-284 26.00164 0.0515 6.176698 0.0493~0.9956
Figure 2. Distribution curve of pore size.
3.2. Adsorption and Desorption Characteristics
In the study of adsorption phenomena, adsorption isotherm is the most common method used to indicate adsorption properties. Several typical shale samples were selected for isothermal adsorption experiments, and the adsorption-desorption curves were obtained by origin plotting software (Figure 3).
3.2.1. Adsorption Curve Characteristics
According to the isotherm classification standard of International Union of Pure and Applied Chemistry (IUPAC), it can be considered that Figure 3 belongs to the type of type IV adsorption curve (Figure 4). From the analysis of
Figure 3. Adsorption-desorption isothermals of shale by low-pressure nitrogen.
Figure 4. Types of adsorption isotherm.
3.2.2. Hyteresis Loop Characteristics
with the desorption curve, and there is an obvious "hysteresis loop". ABC is the adsorbed branch when the equilibrium pressure rises, ACD is the desorbed branch when the pressure decreases, and ABCD is the hysteresis loop (Figure 3 a~ f). The hysteresis loops of each samples are similar, and are generally formed after p/p0>0.45. Observing the shape of adsorption isotherm and analyzing the shape and width of hysteresis loop ABCD can study the structure of adsorption pore to a certain extent.
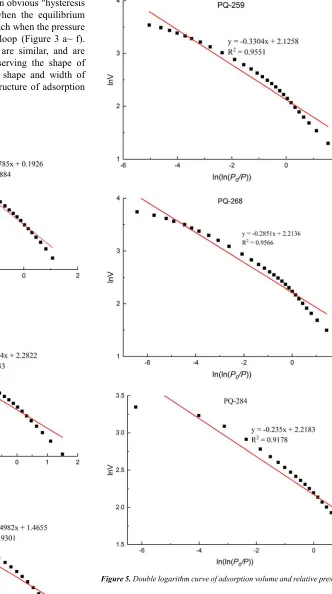
Figure 5. Double logarithm curve of adsorption volume and relative pressure.
mesoporous materials with parallel plate-like slots and pores; the hysteresis loops are wide and the mesoporous distribution is relatively wide.
4. Implication of Fractal Dimension on
Pore Structure
The fractal dimension is calculated by the experimental data of adsorption process when the relative pressure p/p0 is greater
than 0.45, because the adsorption-desorption curve is "divergent" after p/p 0=0.45. The experimental data of N2
isotherms were processed according to formula (1). The slope of each sample curve (Figure 5) was obtained by using the
principle of least square method with ln (ln (P0/P)) as X axis
and lnV as Y axis. Then the pore fractal dimension and fractal characteristics were obtained (Table 2). According to Figure 5, the correlation coefficient R2 of the fitting curves is close to 1, that is, there exist a high correlation between lnV and ln (ln (p0/p)). Based on the fractal geometry theory, the fractal
dimension is related to the complexity of pore structure. Generally, the fractal dimension of pore structure range from 2 to 3, and the the pore surface is smoother when the fractal dimension approaches 2. When the fractal dimension approaches 3, the pore surface is rougher, more complex, and heterogeneous.
Table 2. Calculation results of adsorption pore fractal dimension for shale samples.
Sample ID Depth/m lnV vs ln (ln (P0/P)) Fractal dimension D correlation coefficent R2
PQ-226 1721.975 y = -0.1927x + 2.5486 2.8073 0.913
PQ-247 1743.4 y = -0.5785x + 0.1926 2.4215 0.9884
PQ-252 1747.8 y=-0.4982x + 1.4655 2.5018 0.9301
PQ-259 1760.35 y = -0.3304x + 2.1258 2.6696 0.9551
PQ-268 1784.97 y = -0.2851x + 2.2136 2.7149 0.9566
PQ-284 1799.6 y = -0.235x + 2.2183 2.765 0.9178
Once the pore fractal dimension exceeds 3, the pore does not have fractal characteristics in the pore size range. Table 2 shows that the fractal dimension is between 2.42 and 2.81, indicating that the fractal characteristics of shale pores are obvious in the nanoporous scale, and the pore structure of shale samples is complex and the micro-pore heterogeneity is strong.
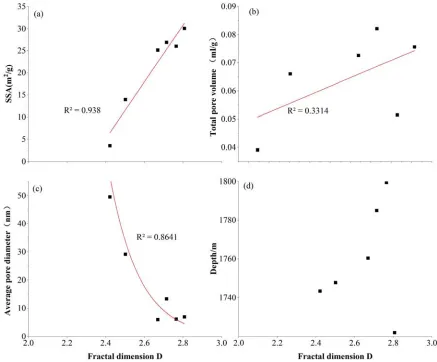
The complexity and heterogeneity of pore structure can be characterized by fractal dimension. According to the fractal theory, The larger the fractal dimension of pore volume is., the more complex the pore geometry will be. In order to study the implication of fractal dimension on pore structure, relationship between fractal dimension and average pore diameter, pore volume, specific surface area and buried depth were analysed by the fitting curves (Figure 6).
4.1. Implication of Fractal Dimension on SSA
The gas adsorption of shale is mainly manifested on the pore surface, and the fractal dimension can reflect the irregularity and complexity of the pore surface, so the fractal dimension has a certain characterization of the adsorption capacity of shale. The fractal dimension D is significantly positive correlated with SSA (Figure 6a), and the correlation coefficient is 0.938. The larger the fractal dimension is, the more complex the pore structure is, the rougher the surface is, and the larger the surface area is. The contribution of organic matter and clay minerals in shale to methane adsorption worth further study.
4.2. Implication of Fractal Dimension on Total Pore Volume
The geometric meaning of fractal dimension mainly represents the pores distribution in three-dimensional space. Although the pore irregularity can not be directly characterized by the average pore size, but when the average pore size becomes small, pore volume has a decreasing trend, so there is a certain relationship between the fractal dimension and pore volume. Figure 6 (b) shows the relationship between fractal dimension and pore volume. The correlation coefficient R2 between fractal dimension and pore volume is 0.33. The fractal dimension is weakly positively correlated with the total pore volume.
4.3. Relationship Between Fractal Dimension and Average Pore Diameter
There has a good linear negative correlation between the fractal dimension D and the average pore diameter of shale (Figure 6c). The correlation coefficient R2 is 0.86. The smaller the average pore diameter is, the higher the fractal dimension is. This rule is similar to the research on the relation between pore fractal dimension of coal reservoir and average pore size.
4.4. Relationship Between Fractal Dimension and Burial Depth
Studies have shown that the complexity of pore structure varies regularly with burial depth. Fitting the relationship between fractal dimension and burial depth (Figure 6d). The fractal dimension of pore has a weakly positive correlation with depth. the fractal dimension presents an increasing trend with the increase of depth. In a certain depth range, and the metamorphism degree of pore structure of the shale reservoir is enhanced with the increase of burial depth due to increased temperature and pressure, which is consistent with fractal
characteristics of pore structure obtained by mercury intrusion [24].
5. Conclusion
The low temperature liquid N2 isotherm measurement and
fractal characteristics of the Permian Shanxi Formation shale samples from Huainan coalfield are discussed. The following conclusions are drawn:
(1) Adsorption isotherms generally belong to type IV, and hysteresis loop H3。Shale pore structure regularity is poor,
parallel plate-like slot pores are developed. Pore size distribution ranges from 1.14 nm to 173.39 nm, micropores and macropores developed and concentrated, no obvious dominant peak in the mesopore (2-25 nm) with relatively uniform distribution.
(2) The adsorption pore of Shanxi Formation shales in the study area has obvious fractal characteristics. The average correlation coefficient R2 is above 0.9 and the fractal dimension value is between 2.42 and 2.81 The pore structure of the shale is complex and heterogeneous.
(3) Fractal dimension is positively correlated with specific surface area and total pore volume, and highly negatively correlated with the average pore diameter;
fractal dimension is also a characterization of buried depth, and there is a weak positive correlation between them. With the increase of buried depth, fractal dimension has an increasing trend.
Acknowledgements
This study was jointly supported by the National Science and Technology Major Project, China (Grant No. 2016ZX05002-006-005), the Major State Basic Research Development Program of China (“973” Project, Grant No. 2014CB239102), the National Natural Science Foundation of China (Grant No. 41372127) and National Engineering Technology Research Center Set-up Project Plan (Grant No. 2014FU125Q06).
References
[1] R. Wang, N. Zhang, X. Liu, et al. Research progress of mechanism of adsorption and desorption of gas in shale. Science Technology and Engineering, 2013, 13:5561-5567. [2] Y. B. Yao, D. Liu, Y. Cai, et al. Advanced characterization of
pores and fractures in coals by nuclear magnetic resonance and X-ray computed tomography.Science China Earth Sciences D, 2010, 53 (6):854-862.
[3] X. Yan, Z. Li, J. Meng, et al. Shale pore structure characteristics by fractal research.Petrochemical Industry Application, 2013, 05: 20-22.
[5] L. Hu, Y. Zhu, S. Chen, et al. Research on fractal characteristics of shale pore structure in the Longmaxi formation in Shuanghe, Southern Sichuan. Xinjiang Petroleum Geology, 2013, 01:79-82.
[6] X. Fu, Y. Qin, X. Xu, et al. Fractal study on pore and fracture system of coal reservoir.Journal of China University of Mining Technology, 2001, 03:11-14.
[7] F. Yang, Z. Ning, D. Kong, et al. Pore structure of shales from high pressure mercury injection and nitrogen adsorption method.Natural Gas Geoscience, 2013, 3:450-455.
[8] X. Xie, H. Tang, C. Wang, et al, Method comparison between nitrogen adsorption and mercury injection at testing shale pore size distribution.Natural Gas Industry, 2006, 12:202-203. [9] Y. Yao, D. Liu, W. Huang. Research on the pore and fractures
system properties of coaled methane reservoirs and recovery in Huainan and Huaibei coalfields, 2006, 02:163-168.
[10] Liu, Z., et al.. Improvement of drainage gas of steep gassy coal seam with underground hydraulic fracture stimulation: A case in Huainan, China. International Journal of Oil Gas & Coal Technology, 2016, 13:386-391.
[11] Peng, S. (1990). Characteristics and origin of piebald mudstone in Permian member in the Huainan coalfield. Geological Review, 1990, 07:135-142.
[12] D. L. Xie. et al. Fractal characteristics of adsorption pore of shale based on low temperature nitrogen experiment. Journal of China Coal Society, 2014, 39:2466-2472.
[13] B. Stephen, P. H. Emmett, Edward Teller, Adsorption of gases in multimolecular layers.Journal of the American Chemical Society: 1938, 60:309-319.
[14] K. Yang, X. Lu, J. Xu, et al. Preliminary verification of distribution of shale common calculation methods of pore size based on has adsorption isotherm.Journal of China Coal Society, 2013, 05:817-821.
[15] K. Yang, Simulations of gas adsorption and chainmolecules transportation in micro scaled pores of rocks and its preliminary application in petroleum geology [D].Nanjing University, 2011.
[16] E. C. Donaldson, Kendall R. F., Baker B. A., et al. Surface-area measurement of geologic materials.SPE Journal, 1975, 15:111-116.
[17] Brunauer S, Deming L S, Deming W E, et al. On a theory of the vander Waals adsorption of gases.Journal of the American Chemical Society, 1940, 62:1723-1732.
[18] G. Hasegawa, K. Kanamori, K. Nakanishi, et al. New Insights into the relationship between micropore properties, ionic sizes, and electric double-layer capacitance in monolithic carbon electrodes . Journal of Physical Chemistry C, 2012, 116,:26197-26203.
[19] J. C. Groen, Peffer L A A, Pérez-Ramírez J, Pore size determination in modified micro and mesoporous material., Pitfalls and limitations in gas adsorption data analysis.Microporous and Mesoporous Materials, 2003, 60:1-17.
[20] Q. Xin, M. Luo, Methods of Modern Catalysis Research.Science Press, 2009.8-22,
[21] H. Liu, S. Wu, X. Jiang, et al. The configuration analysis of the adsorption isotherm of nitrogen in low temperature with the lignite char produced under fast pyrolysis.Journal of China Coal Society, 2005, 30:507-510.
[22] L. Xu, D. Zhang, X. Xian, Fractal dimensions of coals and cokes. Journal of Colloid and Interface Science, 1997, 190:357-359.
[23] Rigby S P, Predicting surface diffusivities of molecules from equilibrium adsorption isotherms.Colloids and Surfaces A:Phy-sicochemical and Engineering Aspects, 2005, 262:139-149.
![Figure 1. Geographical map of Huainan coalfield and sampling locations [10].](https://thumb-us.123doks.com/thumbv2/123dok_us/9896261.1977121/2.595.64.531.136.316/figure-geographical-map-huainan-coalfield-sampling-locations.webp)