Biosignal –Based Multimodal Biometric System
Kuk Won Ko and Sangjoon Lee
*School of Mechanical and ICT Convergence Engineering, Sun Moon University, S. Korea.
Received 02 May 2016; received in revised form 25 June 2016; accepted 26 June 2016
Abstract
This study concerns personal identification based on electrocardiogram (ECG) and photo-plethysmogram (PPG) signals. We manufac-tured a bio-signal measurement system that can simultaneously measure ECG and PPG signals, using which three channels of ECG signal and one channel of PPG signal were acquired from the right-hand index finger of a total of 33 sub-sets for 3 minutes. Lead-I signal of the three-channel ECG signal and the one-channel PPG signal were selected for recognition. For each subject, 160 heartbeats were automatically separated from the acquired bio-signals, and a total of 21 features, comprising 15 ECG features, 4 ECG-related PPG features, and 2 features con-cerning PPG only, were extracted from each heartbeat. Letting the 21 features form a single data point, heartbeat features of each subset were used as the training data for a support vector machine (SVM) classifier, with the number of data points being adjusted from 10 to 80, and the data points (80 – 150) other than the training data were used as the testing data, in order to investigate the recognition performance indices. As a result, the proposed algorithm showed high recognition performance of 99.28% accuracy, 0.88% FRR, 0.85% FAR, 99.28% sensitivity, and 99.31% specificity, when there are 80 training data points. Moreover, even when there are 10 training data points, the proposed algo-rithm showed the performance of 92.77% ac-curacy, 7.23% FRR, 6.29% FAR, 92.77% sen-sitivity, and 93.21% specificity, which can be evaluated as an extremely high recognition performance considering that there was a total of 4,950 testing data points.
Keywor ds: biometric, pattern recognition, per-sonal identification
1.
Introduction
separated from the overall ECG signal, and 6 features from PPG signal, in order to promote the real-time operation of the recognition algo-rithm. The proposed algorithm adopts down slope trace waveform (DSTW) method [6], which shows high peak detection rate, for the detection of P, Q, R, S, and T points of the ECG signal. For pattern recognition, one-against-one support vector machine (SVM) algorithm was used, which shows excellent recognition results in various fields, and is capable of multi-class classification.
2.
Method
2.1. Bio-Signal Measurement System
While the previous ECG recognition and disease detection algorithms can be assessed in terms of validity by using existing public data-base files such as MIT ECG datadata-base for veri-fication, there is no public database that includes a simultaneous measurement of PPG s ignals linked with ECG signals. Therefore, the hard-ware for simultaneous measurement of ECG and PPG signals was manufactured for the acquisi-tion of bio-signals for the recogniacquisi-tion algorithm in this study.
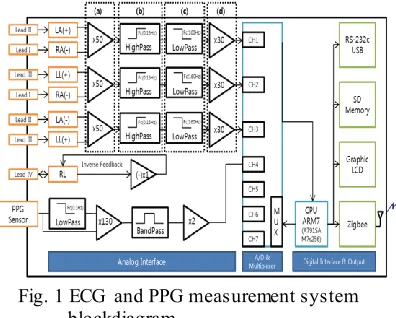
Fig. 1 ECG and PPG measurement system blockdiagram
Fig. 1 shows the block diagram and the photograph of the manufactured ECG and PPG measurement system hardware. ECG was measured in three channels (LA-RA, LL-LA, and RA-LL) based on the Willem Einthoven triangle method. Moreover, low-pass filters and high-pass filters with cutoff frequencies of 0.16Hz and 160Hz, respectively, were implemented in hardware, with the total amplification gain of the ECG signal being 1500, as shown in (a-b) and (a-c) of Fig. 1. For PPG measurement, the
output signal from the filter and the original signal were differentially amplified by imple-menting a high-pass filter with cutoff frequency of 0.1 Hz in order to prevent the saturation due to the DC offset from the light output during am-plification, as shown in the PPG measurement hardware in Fig. 1. Moreover, a band-pass filter with cutoff frequencies of 0.1Hz and 8Hz was designed and implemented. Fig. 2 shows an actual measured signal being displayed and stored on PC.
Fig. 2 Measurement software
2.2. Peak Detection from ECG and PPG Signals through DSTW
Fig. 3 DSTW peak detection method[6] Peaks are detected from the ECG signal by generating DSTW, as shown in Fig. 3, in order to firstly detect the R peaks in ECG, which are convenient to detect [6]. After the R peak is detected as shown in Fig. 4, Q, S, P, T, and end of T are sequentially detected in accordance with a given detection rule (Eqs. 1- 5).
Fig. 5 Results from the detection of PPG Peaks (Onset, Peak) (Subject 4)
The points to be detected from the PPG signal were selected to be the onset points, which are the initial points, and PPG peaks. Onset peaks are used to detect the fiducial points in accordance with given rules (Eq. 6), after the PPG peak has been detected as shown in Fig. 5.
Q k Index(Argmin[X n ]), for R k 30 n R(k) (1)
S k Index(Argmin[X n ]), forR k n R k 30 (2)
P k Index(Argmax X n ), forQ k 60 n Q(k) (3)
T k Index(Argmax X n ), forS k n S k 100 (4)
k Index( ),
end min
T Arg X n forT k n T k 50 (5)
Onset k Index(ArgminP n ), forPPGpeak k 100 n PPGpeak k (6)
where k denotes the indices of each peak from one to M (1≤k≤M), and n denotes the indices of the sampled data for X(n) and P(n). The actual data were sampled at 250 Hz, and n=1 implies 4 ms 〖 (T〗 _s=1/F_s )
2.3. Feature Extraction
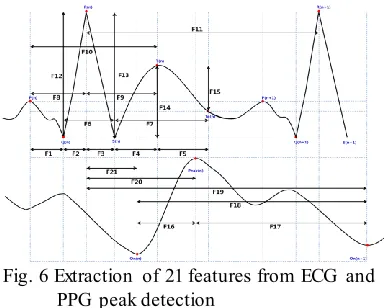
As shown in Fig. 6, the features for bio-metric recognition can be extracted by detecting the six types of ECG peaks and the two types of PPG peaks. For this algorithm, a total of 21 features were established by extracting 15 types of ECG features, 3 types of PPG features, and 3 types of features relating to both ECG and PPG. 2.4. Support Vector Machine for classification
SVM is a new genre of learning systems for pattern recognition, devised by Corters and Vapnik [7]. While SVM did not receive much attention initially, it is recently being used in various fields including bioinformatics, charac-ter recognition, handwriting recognition, facial recognition, and object recognition, and is widely used for supervised pattern recognition owing to its excellent performance.
Fig. 6 Extraction of 21 features from ECG and PPG peak detection
The training and classification algorithm for the proposed algorithm was based on one-against-one multi-class SVM algorithm, which is not af-fected by the curse of dimensionality. 160 peaks were detected (P, Q, R, S, T, andTend) from the ECG signals simultaneously acquired from each of the 33 test subjects, and, likewise, 160 peaks (Onset, andPPGpeak) were detected from the PPG signals, forming a set of 21 features for each peak. From each of the 34 dataset files, the first (10-80) features were used as the training data, and the other (140 – 80) features were used as the testing data. Moreover, we examined the difference in recognition rate between the case where only ECG features are considered, and the case where both ECG and PPG features are considered.
3.
Results and Discussion
3.1. Testing method
FRR =𝑁𝑁𝑤
𝑡× 100 (7)
FAR =Tr− TT n
r × 100 (8)
where Nw is number of wrong recognition, Nt is
number of testing data for target subject, Tr is
total recognition number for taget subject, Tn is
testing data number.
Moreover, the sensitivity and specificity of the proposed algorithm were investigated using the true positives (TP), the false positives (FP), and the false negatives (FN). For a biometric recognition algorithm, TP, FP, and FN are de-fined as follow:
TP (true positive): Number of accu-rately recognized test subjects.
FP (false positive): Number of falsely rec-ognized test subjects. (The number of data points classified as the subject in question – TP)
FN (false negative): The number of subject data points that should have been recognized, however, were not recog-nized. (The number of testing data points from each subject -TP)
Sensitivity and specificity are defined by Eqs. 9 and 10 below, respectively.
Sensitivity =TP + FNTP × 100 (9)
Specificity =TP + FPTP × 100 (10)
3.2 Testing Result
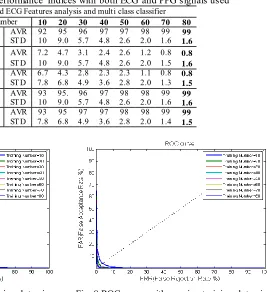
Table 1 Recognition Performance Indices with both ECG and PPG signals used
PPG and ECG Features analysis and multi class classifier Training Number 10 20 30 40 50 60 70 80
Accuracy (%) AVR 92 95 96 97 97 98 99 99
STD 10 9.0 5.7 4.8 2.6 2.0 1.6 1.6
FRR (%) AVR 7.2 4.7 3.1 2.4 2.6 1.2 0.8 0.8
STD 10 9.0 5.7 4.8 2.6 2.0 1.5 1.6
FAR (%) AVR 6.7 4.3 2.8 2.3 2.3 1.1 0.8 STD 7.8 6.8 4.9 3.6 2.8 2.0 1.3 0.8
1.5
Sensitivity (%) AVR 93 95. 96 97 98 98 99 99
STD 10 9.0 5.7 4.8 2.6 2.0 1.6 1.6
Specificity (%) AVR 93 95 97 97 98 98 99 99
STD 7.8 6.8 4.9 3.6 2.8 2.0 1.4 1.5
Fig. 7 ROC curve with varying training data size
(15 ECG features used only) Fig. 8 ROC curve with varying training data size (21 ECG and PPG features used)
Fig. 7 shows the performance indices of recognition using a multi-class SVM classifier with 15 ECG features detected from the actual measurement data from 33 test subjects. 89.92%
from each subject. This result corresponds to the recognition with respect to 2,640 tes ting heartbeat data from a total of 33 ECG signals. The proposed algorithm was tested based on a total of 21 feature points, by adding the 6 PPG feature points measured simultaneously from the same subject to the 15 ECG feature points. Recognition performance indices, which are shown in Table 1, displayed the results of 99.28% accuracy, 0.88% FRR, 0.85% FAR, 99.28% sensitivity, and 99.31% specificity. This is the performance when 80 training data points from the ECG and PPG signals measured from 33 test subjects are used, and 2,970 testing data points were used overall.
Moreover, as shown in Table 1 and Fig. 8, the accuracy index shows the high performance of 92.7% even when 10 training data points are applied out of the 160 heartbeat data from each subject (4,950 testing heartbeat data). The result of the above test is better than or equal to the performance o f the e xis ting common recognition s ys tems , and the recognition performance is observed to be extremely higher compared to the previous test. Therefore, it can be deduced that the consideration of the features of two types of signals for the design of bio-metric recognition systems leads to a higher recognition performance than when a single type of signal is used.
4.
Conclusions
This paper concerns the implementation of a multi-modal biometric recognition system and algorithm, wherein ECG and PPG signals were used for the recognition. Since there is no pre-vious database where ECG and PPG signals are linked, a biometric system that is capable of actual ECG and PP G meas urements was manufactured, and three channels of ECG signal and one channel of PPG signal were acquired from a total of 33 subjects for 3 minutes. Lead-I signal of the three channels of ECG signals only and the 1-channel PPG signal were selected for recognition. With the ECG signals acquired from each subject, 160 heartbeats were separated and 15 ECG features were extracted from each heartbeat. Moreover, 4 PPG features related to ECG and 2 features of PPG only were selected, so that a total of 21 features were used for the recognition. The recognition performance indices of the proposed biometric recognition system were investigated by adjusting the
number of training heartbeat data between 10 and 80. The performance indices of the recog-nition based on ECG features only were found to be 89.92% accuracy, 10.08% FRR, 9.79% FAR, 89.92% sensitivity, and 90.21% s pecificity . Furthermore, the performance indices of the recognition combining PPG were found to be 99.28% accuracy, 0.88% FRR, 0.85% FAR, 99.28% sensitivity, and 99.31% specificity, when there are 80 heartbeat data for training, which indicate an ext remely high recognition performance. Therefore, it can be deduced that the use of the features of a combination of more than two bio-signals can lead to a higher recog-nition performance than the use of a single bio-signal. Moreover, the recognition system based on the combination of the two signals exhibits the performance of 92.77% accuracy, 7.23% FRR, 6.29% FAR, 92.77% sensitivity, and 93.21% specificity, even when 10 heartbeat data are used for training, which can be viewed as an extremely high recognition performance, considering that there were 4,950 testing heart-beat data.
Acknowledgement
This work was supported by the Human Res ource Training Program for Regional Innovation and Creativity through the Ministry of Education and National Research Foundation of Korea (NRF-2014H1C1A1066998).
References
[1] L. Biel, et al., “ECG analysis: A new ap-proach in human identification,” IEEE Trans actions on Instrumentation and Measurement, vol. 50, no. 3, pp. 808-812, 2001.
[2] J. M. Irvine, et al., “EigenPulse: Robust human identification from cardiovascular function,” Pattern Recognition, vol. 41, no. 11, pp. 3427-3435, 2008.
[3] T. W. Shen and W.J. Tompkins, “Biometric statistical study of one-lead ECG features and body mass index (BMI),” 27th Annual International Conference Engineering in Medicine and Biology Society, IEEE press, September, 2005.
[4] S. A. Israel, et al., “ECG to identify individuals,” Pattern Recognition, vol. 38, no. 1, pp. 133-142, 2005.
Biometrics Symposiums, Baltimore, USA, 2006.
[6] J. Kim, et al., “An event detection algorithm in ECG with 60Hz interference and base-linewandering,” Proceedings of the 2nd International Conference on Interaction Sciences, Information Technology (ICIS ‘09),
Culture and Human New York, NY, USA, 2009.