_________________________________________________________ Journal of Experimental Biology and Agricultural Sciences
KEYWORDS
Soybean
Nitrogen fertilizer
Cropping pattern
Grain yield
ABSTRACT
Response of soybean crop toward N fertilizer in paddy fields is influenced by the cropping pattern. Present study was conducted for finding out the effect of two cropping pattern viz rice -rice-soybean and rice-soybean-soybean and N fertilization on the production of soybean crops. Results of the study revealed that the cultivation of soybean after rice required higher amount of N fertilizer (30 kg N / ha of urea or 90 kg N / ha of ZA) to increase the grain yield from 0.5 t / ha (control) to 3.4 t / ha while in case of soybean after soybean cropping pattern soybean did not required any additional dose of N fertilizer for increasing the grain yield up to 3 t / ha.
Suryantini and Henny Kuntyastuti
Indonesian Legume and Tuber Crops Institute (ILETRI)
Received – March 25, 2015; Revision – April 28, 2015; Accepted – June 29, 2015 Available Online – July 05, 2015
DOI: http://dx.doi.org/10.18006/2015.3(3).316.323
EFFECT OF NITROGEN FERTILIZATION ON SOYBEAN PRODUCTION UNDER
TWO CROPPING PATTERNS
E-mail: [email protected] (Suryantini)
Peer review under responsibility of Journal of Experimental Biology and Agricultural Sciences.
* Corresponding author
Journal of Experimental Biology and Agricultural Sciences, June - 2015; Volume – 3(3)
Journal of Experimental Biology and Agricultural Sciences
http://www.jebas.org
ISSN No. 2320 – 8694
Production and Hosting by Horizon Publisher (www.my-vision.webs.com/horizon.html).
All rights reserved.
1 Introduction
Soil nitrogen plays a crucial role in sustainable agricultural production but it can be disturbed by disturbing the supply of useable nitrogen (Santoso et al., 2001; Spiertz, 2010). It has been well reported that Indonesian paddy soil is generaly deficient of N nutrient. According to Adisarwanto et al. (1998) paddy soil of East Java, Bali and NTB provinces have very low N content (0.07 to 0.25% ). Similarly, in another survey Adisarwanto et al. (1999) reported that paddy soil of Ngawi and Banyuwangi have N status between 0.12 to 0.36%. Furthermore, paddy soil of Mojokerto, Banyuwangi and NTB
have Entisol type of soil and showed NO3 concentration range
between 5-70 mg / kg and N content between 0.08 to 0.19% (Adisarwanto & Suhartina, 2000; Adisarwanto et al., 2001). Soil texture affects the rate of N2O losses, coarse-texture soil
favor the loss of N2O while fine-texture soil have capacity to
retain the N2O and decrease the loss of Nitrogen from the soil
(Gentile et al., 2008). The decline in the intensity of tillage accompanied by an increase in crop diversification is very effective to increase the levels of total soil N (Al Kaisi et al., 2005). According to Dou et al. (2007) continuous cultivation soybean of had negative effect on the soil N level as compared to the sorghum–wheat–soybean and wheat–soybean cropping pattern.
Total N uptake by a plant also depends on the various environmental factor like types of soil, soil nature, total available nitrogen in soil and cropping pattern. Nature of soil and dose of fertilizers severely affect the fertilization process, according to Adisarwanto et al. (1998) urea is not a good nitrogen source for the Vertisol or Entisol paddy soil. It was reported that fertilization by urea @ 50 kg/ha did not increase soybean grain yield in Vertisol paddy field at Ngawi or Entisols at Jambegede and Banyuwangi (Adisarwanto et al. 1998). Even at the application of 100kg urea/ha on soybean followed by soybean (rice-soybean-soybean) and soybean followed by rice (rice-rice-soybean) also did not increase the grain yield (Suryantini & Kuntyastuti, 1998). However, the application of ZA at 50 kg/ha increased soybean grain yield by 0.26 t/ ha (18%) in Entisol at Jambegede and by 0.36 t/ha (19%) in Vertisol at Ngawi (Riwanodja et al., 2001). Furthermore, the combination of 50 kg/ha urea and S-elementary 150 kg/ha also increased grain yield by 0.81 t / ha (86%) (Adisarwanto et al. 2001).
Similarly, Suryantini (2008) reported that the application of 50 kg/ha urea did not increase grain yield of soybean planted after rice. Conversely, in soybean planted after soybean (rice-soybean-soybean), the application of 50 kg urea/ha or
Rhizobium inoculation at recommended rate increased the grain yield of soybean. Both nitrogen source (urea and
Rhizobium) did not increase grain yield of soybean when there was manure residues, or given to soybean planted after rice (Suryantini & Rahmianna, 2001). Information regarding the effect of cropping pattern on nitrogen fertilization are in scarcity therefore present study have been conducted to find
out the effect of two cropping pattern viz rice-rice-soybean and rice-soybean-soybean on the nitrogen fertilization.
2 Materials and Methods
The experiment was conducted in Entisol paddy fields at Jambegede Research Station Malang-Indonesia, during the dry seasons of 2010. Soybeans were planted after rice and after soybean crops in the cropping sequences of rice-rice-soybean and rice-soybean-soybean respectively. A randomized block design with three replications was used for present study. N fertilizer were applied at the rate of 0, 30, 60, 90, 120, 150, 180 and 210 kg N / ha from two sources, namely Urea and ZA (ammonium sulfate - (NH4)2SO4). Sulfur supplement (S) @
210 kg N / ha was equated to all treatments using sulfur powder. This sulfur was also added in control namely without N and without N and S. The sulfur powder containing 85% S; while (NH4) 2SO4 containing 21% N and 24% S and urea containing 46% N.
A composite soil samples was collect from each site before planting and analyzed for soil physical- chemical analysis (Table 1 and 2). Soil pH was measured in slurry (1:2.5 soil to water ratio) by glass electrode using an electronic pH, available P was measured by the method described by Bray 1. Total available N before planting was determined using the micro-Kjeldahl method while organic carbon was determined by the Walkley and Black wet oxidation method. Exchangeable bases were determined by ammonium acetate extraction, with Ca and Mg estimated by Atomic Absorption Spectrophotometer (AAS), and K by the flame photometer. Zn, Cu, Fe and Mn were measured by extraction using DTPA, with quantitative determination by AAS. Bulk density was determined by the cylinder method and total porosity was calculated from values of bulk and particle density. Clay size fraction was determined by the pipette method. The texture classes were defined according to the textural triangle by FAO.
Willis soybean varieties were planted in plots measuring 4 m x 5 m with a spacing of 40 cm x 10 cm, two plants / hill. Thinning was done at the age of 10 DAP (days after planting) and spared two plants / hill. Fertilizer N was applied twice (50% each) at planting and flowering in bands 10 cm from the plant rows. Weeding was done two times at 15 and 35 DAP, and watered every 20 days. Control of pests / diseases was done by monitoring the control threshold. Plants were harvested when 95% of pods had turned brown and fallen leaves. Data were collected at 60 DAP from samples of 5 plants per plot for shoot and root dry weight as well as number of branches per plant. Oven dried shoots were grinded homogenously and left at 400°C for 1 h for the development of ash, this ash samples were analyzed for estimating the total mineral including K, Ca, Mg, P, and S. Chemical analysis were done by energy-dispersive x-ray analysis (EDXA). While total N was determined by modified Kjeldahl digestion colorimetric method. At harvesting time 10 plants per plot were collected
317 Suryantini and Kuntyastuti
for measuring plant height, number of filled pods per plant and 100 seed weight, while the harvested plots of 3 m x 4 m was observed for number of harvested plants (plant population) and grain yield. Statistical analysis of data was carried out using standard analysis of variance (Gomez & Gomez, 1984). The significance of the treatment effect was determined using the F-test. To determine the significance of the difference between the means of treatments, Duncan Multiple Range Test (DMRT) was computed at the 5% probability level.
3 Results and Discussion
3.1 Rice-Soybean-Soybean Cropping Pattern
No significant difference was reported in Entisol paddy soil after rice and soybean cultivation. Soil after rice and soybean crops were poor in organic matter and macro nutrients likes N and S, but these soils were rich in P, K, Ca and Mg as well as for other micro nutrients (Table 1). The texture of the studied soil was clay loam and it has 17-19% water holding capacity and high cation exchange capacity (CEC). The saturated
hydraulic conductivity (Ksat) for the studied soil was low (0.8 cm / hour) and the penetration of these soil was high (Table 2).
Soybean after soybean grew well with a population nearly 460 thousand/ha approaching the optimum population. Optimal plant population is one of the requirements to achieve high yield (Table 4). Though conditions are favourable but fertilization by N did not have any significatory effect on shoot and root dry weight as well as number of branches. Dry weight of shoot and root reached 9.98 and 0.91 g/plant at the application of 180 Kg/ha and 150 Kg/ha respectively (totally equivalent to 4.53 t / ha stover). Increasing the dose of urea favor the plant growth characters. Application of urea and ZA @30 kg/ ha have positive effect on the plant growth characters and application at this level increased plant height from 40.3 cm (control) to 45.7 and 46.3 cm respectively and this treatments shows superiority over the other treatments of ZA. Further increases the levels of N and ZA have not showing any significant effect on the plant heights and number of branches/plant (Table 3).
Table 1 Chemical properties of Entisol paddy soil in rice-rice-soybean and rice-soybean-soybean cropping system (0 -20 cm depth).
Chemical properties Rice-Rice-Soybean Rice-Soybean-Soybean
pH H2O 0.78 0.80
pH KCl 1.20 1.23
C-org (%) 2.56 2.50
N (%) 53.00 51.30
P2O5 Bray I (ppm) 399.49 399.50
SO4 (ppm) 1.84 0.80
K (me/100 g) 20.4 20.8
Ca (me/100 g) 0.13 0.45
Mg (me/100 g) 39.0 41.0
KTK (me/100 g) 22.0 22.0
Fe (ppm) 17.0 19.0
Zn (ppm) 16 16
Cu (ppm) 44 50
Mn (ppm) 40 34
Data are mean of three replicates
Table 2. Physical properties of Entisol paddy soil used for rice-rice-soybean and rice-soybean-soybean cropping system (0-20 cm depth).
Physical properties Rice-Rice-Soybean Rice-Soybean-Soybean
Ksat (cm/hour) 0.78 0.80
Bulk density (g/cm3) 1.20 1.23
Porosity (%) 53.00 51.30
Penetration (N/cm2) 399.49 399.50
Water content pF 2,5 (%) 39.0 41.0
Water content pF 4,2 (%) 22.0 22.0
Available water (%) 17.0 19.0
Sand (%) 16 16
Silt (%) 44 50
Clay (%) 40 34
Texture class Clay loam Clay loam
Table 3 Effect of N fertilizer on vegetative growth of soybean in rice-soybean-soybean cropping system.
Nitrogen Source and its dose Dry weight (g/plant) Plant height (cm) Branches
(no./plant)
Shoot Root
Without NS (Control) 8.56±0.91c 0.80±0.02b 43.2±1.56d 2.0
Without N (Control) 8.98±0.73bc 0.76±0.10b 40.3±0.97f 1.9
Urea -30 Kg N/ha 8.82±1.02bc 0.82±0.08ab 45.7±1.56ab 1.4
Urea -60 Kg N/ha 9.56±0.56b 0.90±0.12a 45.3±2.53b 2.3
Urea -90 Kg N/ha 9.71±0.85ab 0.87±0.05ab 44.1±1.00c 1.4
Urea -120 Kg N/ha 9.73±0.99ab 0.72±0.06bc 45.1±0.87b 2.0
Urea -150 Kg N/ha 9.64±0.35ab 0.91±0.10a 44.4±0.99bc 1.7
Urea -180 Kg N/ha 9.98±0.56ab 0.73±0.09bc 42.7±1.21de 2.3
Urea -210 Kg N/ha 9.12±0.79b 0.64±0.05c 44.1±1.90c 2.5
ZA -30 Kg N/ha 10.47±1.1a 0.73±0.07bc 46.3±1.28a 1.8
ZA -60 Kg N/ha 9.68±0.15ab 0.89±0.02a 45.0±2.90b 2.0
ZA -90 Kg N/ha 8.07±0.30c 0.83±0.10ab 46.7±3.05a 2.4
ZA -120 Kg N/ha 8.44±0.25c 0.57±0.0d 42.3±2.50e 1.6
ZA -150 Kg N/ha 9.58±0.55ab 0.59±0.01d 44.9±2.88bc 2.5
ZA -180 Kg N/ha 9.59±0.61ab 0.70±0.08bc 41.1±0.56ef 1.9
ZA -210 Kg N/ha 9.99±0.22ab 0.77±0.0b 43.1±1.74d 1.8
Average 9.37 0.76 44.0 2.0
DMRT 5% NS NS NS S
CV (%) 12.31 13.90 3.58 21.91
Data are mean of five plants; ± Standard Error of mean; Values without common letters differ significantly at LSD P< 0.05; Non Significant (NS) value on Duncan Multiple Range Test (DMRT) was computed at the 5% probability level
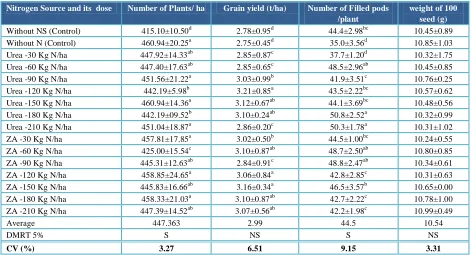
Table 4. Effect of N fertilizer on plant population, grain yield and yield components of soybean in rice-soybean-soybean cropping system.
Nitrogen Source and its dose Number of Plants/ ha Grain yield (t/ha) Number of Filled pods /plant
weight of 100 seed (g)
Without NS (Control) 415.10±10.50d 2.78±0.95d 44.4±2.98bc 10.45±0.89
Without N (Control) 460.94±20.25a 2.75±0.45d 35.0±3.56d 10.85±1.03
Urea -30 Kg N/ha 447.92±14.33ab 2.85±0.87c 37.7±1.20d 10.32±1.75
Urea -60 Kg N/ha 447.40±17.63ab 2.85±0.65c 48.5±2.96ab 10.45±0.85
Urea -90 Kg N/ha 451.56±21.22a 3.03±0.99b 41.9±3.51c 10.76±0.25
Urea -120 Kg N/ha 442.19±5.98b 3.21±0.85a 43.5±2.22bc 10.57±0.62
Urea -150 Kg N/ha 460.94±14.36a 3.12±0.67ab 44.1±3.69bc 10.48±0.56
Urea -180 Kg N/ha 442.19±09.52b 3.10±0.24ab 50.8±2.52a 10.32±0.99
Urea -210 Kg N/ha 451.04±18.87a 2.86±0.20c 50.3±1.78a 10.31±1.02
ZA -30 Kg N/ha 457.81±17.85a 3.02±0.50b 44.5±1.00bc 10.24±0.55
ZA -60 Kg N/ha 425.00±15.54c 3.10±0.87ab 48.7±2.50ab 10.80±0.85
ZA -90 Kg N/ha 445.31±12.63ab 2.84±0.91c 48.8±2.47ab 10.34±0.61
ZA -120 Kg N/ha 458.85±24.65a 3.06±0.84a 42.8±2.85c 10.31±0.63
ZA -150 Kg N/ha 445.83±16.66ab 3.16±0.34a 46.5±3.57b 10.65±0.00
ZA -180 Kg N/ha 458.33±21.03a 3.10±0.87ab 42.7±2.22c 10.78±1.00
ZA -210 Kg N/ha 447.39±14.52ab 3.07±0.56ab 42.2±1.98c 10.99±0.49
Average 447.363 2.99 44.5 10.54
DMRT 5% S NS S NS
CV (%) 3.27 6.51 9.15 3.31
Data are mean of five plants; ± Standard Error of mean; Values without common letters differ significantly at LSD P<0.05; Non Significant (NS) value on Duncan Multiple Range Test (DMRT) was computed at the 5% probability level
Table 5 Effect of N fertilizer on vegetative growth of soybean in rice-rice-soybean cropping system.
Nitrogen Source and its dose Dry weight (g/plant) Plant height (cm) Branches
(no./plant)
Shoot Root
Without NS (Control) 8.51±1.56c 0.94±0.08ab 64.7±2.33d 3.5±0.98
Without N (Control) 8.40±1.89c 0.98±0.10a 67.7±4.56c 3.8±0.85ab
Urea -30 Kg N/ha 8.65±1.88c 0.85±0.20bc 66.5±2.05cd 4.2±0.45a
Urea -60 Kg N/ha 7.19±1.26d 0.85±0.17bc 67.2±3.26c 4.1±0.91ab
Urea -90 Kg N/ha 9.63±1.32b 1.01±0.09a 68.1±1.55b 3.7±1.00b
Urea -120 Kg N/ha 9.88±0.99b 0.93±0.25ab 67.9±2.10bc 3.8±1.03ab
Urea -150 Kg N/ha 9.07±0.85bc 0.95±0.15ab 68.9±1.56ab 4.1±0.99ab
Urea -180 Kg N/ha 8.90±1.45bc 0.94±0.19ab 62.1±3.05e 3.3±0.74c
Urea -210 Kg N/ha 9.42±1.69b 0.90±0.05b 68.1±2.89b 3.3±0.52c
ZA -30 Kg N/ha 8.67±1.87c 0.87±0.10b 65.5±1.45cd 3.9±0.98ab
ZA -60 Kg N/ha 9.73±2.06b 1.01±0.02a 69.2±2.22a 3.6±1.00b
ZA -90 Kg N/ha 8.98±1.42bc 0.89±0.16b 69.9±1.74a 3.4±0.75bc
ZA -120 Kg N/ha 7.89±0.81dc 0.80±0.23c 65.6±2.56cd 4.0±1.08ab
ZA -150 Kg N/ha 9.61±0.45b 1.00±0.25a 68.5±3.00b 4.0±0.82ab
ZA -180 Kg N/ha 9.84±1.56b 0.97±0.13a 65.0±2.15cd 4.0±0.75ab
ZA -210 Kg N/ha 10.28±1.56a 1.00±0.09a 69.4±2.77a 4.6±1.10a
Average 9.04 0.93 67.1 3.8
DMRT 5% S S S S
CV (%) 13.85 14.85 6.35 12.97
Data are mean of five plants; ± Standard Error of mean; Values without common letters differ significantly at LSD P<0.05; Non Significant (NS) value on Duncan Multiple Range Test (DMRT) was computed at the 5% probability level
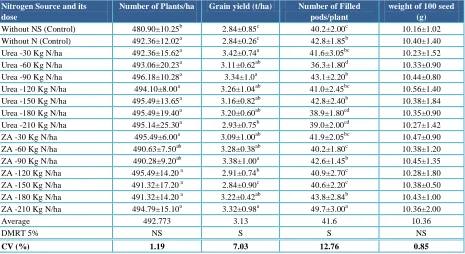
Table 6 Effect of N fertilizer on plant population, grain yield and yield components of soybean in rice-rice-soybean cropping system.
Nitrogen Source and its dose
Number of Plants/ha Grain yield (t/ha) Number of Filled pods/plant
weight of 100 seed (g)
Without NS (Control) 480.90±10.25b 2.84±0.85c 40.2±2.00c 10.16±1.02
Without N (Control) 492.36±12.02a 2.84±0.26c 42.8±1.85b 10.40±1.40
Urea -30 Kg N/ha 492.36±15.62a 3.42±0.74a 41.6±3.05bc 10.23±1.52
Urea -60 Kg N/ha 493.06±20.23a 3.11±0.62ab 36.3±1.80d 10.33±0.90
Urea -90 Kg N/ha 496.18±10.28a 3.34±1.0a 43.1±2.20b 10.44±0.80
Urea -120 Kg N/ha 494.10±8.00a 3.26±1.04ab 41.0±2.45bc 10.56±1.40
Urea -150 Kg N/ha 495.49±13.65a 3.16±0.82ab 42.8±2.40b 10.38±1.84
Urea -180 Kg N/ha 495.49±19.40a 3.20±0.60ab 38.9±1.80cd 10.35±0.90
Urea -210 Kg N/ha 495.14±25.30a 2.93±0.75b 39.0±2.00cd 10.27±1.42
ZA -30 Kg N/ha 495.49±6.00a 3.09±1.00ab 41.9±2.05bc 10.47±0.90
ZA -60 Kg N/ha 490.63±7.50ab 3.28±0.38ab 40.2±1.80c 10.38±1.20
ZA -90 Kg N/ha 490.28±9.20ab 3.38±1.00a 42.6±1.45b 10.45±1.35
ZA -120 Kg N/ha 495.49±14.20 a 2.91±0.74b 40.9±2.70c 10.28±1.80
ZA -150 Kg N/ha 491.32±17.20 a 2.84±0.90c 40.6±2.20c 10.38±0.50
ZA -180 Kg N/ha 491.32±14.20 a 3.22±0.42ab 43.8±2.84b 10.43±1.00
ZA -210 Kg N/ha 494.79±15.10a 3.32±0.98a 49.7±3.00a 10.36±2.00
Average 492.773 3.13 41.6 10.36
DMRT 5% NS S S NS
CV (%) 1.19 7.03 12.76 0.85
Data are mean of five plants; ± Standard Error of mean; Values without common letters differ significantly at LSD P<0.05; Non Significant (NS) value on Duncan Multiple Range Test (DMRT) was computed at the 5% probability level
Table 7 Effect of N fertilizer on macro nutrients uptake at 60 DAP on soybean in rice-soybean-soybean cropping system.
Nitrogen Source and its dose N (g/plant) P (g/plant) K (g/plant) Ca (g/plant) Mg (g/plant) SO4 (g/plant)
Without NS (Control) 0.2123 0.0291 0.1609 0.1489 0.0317 0.1002
Without N (Control) 0.1814 0.0296 0.1446 0.1212 0.0386 0.1024
Urea -30 Kg N/ha 0.2637 0.0291 0.1464 0.1367 0.0335 0.0926
Urea -60 Kg N/ha 0.2342 0.0306 0.1635 0.1262 0.0373 0.1147
Urea -90 Kg N/ha 0.2117 0.0301 0.1651 0.1272 0.0534 0.1049
Urea -120 Kg N/ha 0.1995 0.0292 0.1615 0.0808 0.0379 0.0963
Urea -150 Kg N/ha 0.1745 0.0328 0.1610 0.1379 0.0415 0.1070
Urea -180 Kg N/ha 0.2345 0.0299 0.1657 0.1387 0.0459 0.0699
Urea -210 Kg N/ha 0.2025 0.0274 0.1541 0.1259 0.0365 0.0912
ZA -30 Kg N/ha 0.2563 0.0336 0.1780 0.1048 0.0488 0.1048
ZA -60 Kg N/ha 0.2275 0.0329 0.1694 0.1578 0.0445 0.0958
ZA -90 Kg N/ha 0.1816 0.0202 0.1380 0.1122 0.0395 0.0678
ZA -120 Kg N/ha 0.2009 0.0287 0.1401 0.0996 0.0405 0.0751
ZA -150 Kg N/ha 0.2347 0.0307 0.1801 0.1284 0.0441 0.1092
ZA -180 Kg N/ha 0.2282 0.0307 0.1774 0.1247 0.0432 0.1026
ZA -210 Kg N/ha 0.2547 0.0330 0.1848 0.1229 0.0490 0.1139
Average 0.2186 0.0298 0.1619 0.1246 0.0416 0.0968
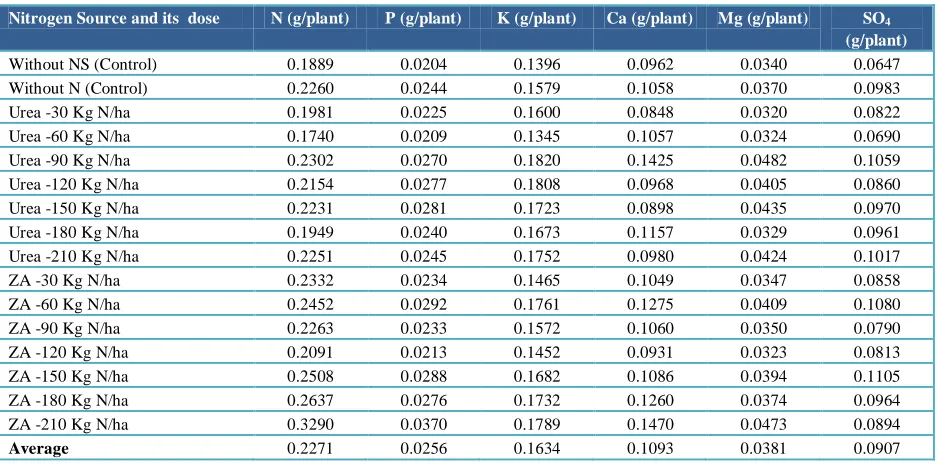
Table 8 Effect of N fertilizer on macro nutrients uptake at 60 DAP by soybean grown in rice -rice-soybean cropping system.
Nitrogen Source and its dose N (g/plant) P (g/plant) K (g/plant) Ca (g/plant) Mg (g/plant) SO4
(g/plant)
Without NS (Control) 0.1889 0.0204 0.1396 0.0962 0.0340 0.0647
Without N (Control) 0.2260 0.0244 0.1579 0.1058 0.0370 0.0983
Urea -30 Kg N/ha 0.1981 0.0225 0.1600 0.0848 0.0320 0.0822
Urea -60 Kg N/ha 0.1740 0.0209 0.1345 0.1057 0.0324 0.0690
Urea -90 Kg N/ha 0.2302 0.0270 0.1820 0.1425 0.0482 0.1059
Urea -120 Kg N/ha 0.2154 0.0277 0.1808 0.0968 0.0405 0.0860
Urea -150 Kg N/ha 0.2231 0.0281 0.1723 0.0898 0.0435 0.0970
Urea -180 Kg N/ha 0.1949 0.0240 0.1673 0.1157 0.0329 0.0961
Urea -210 Kg N/ha 0.2251 0.0245 0.1752 0.0980 0.0424 0.1017
ZA -30 Kg N/ha 0.2332 0.0234 0.1465 0.1049 0.0347 0.0858
ZA -60 Kg N/ha 0.2452 0.0292 0.1761 0.1275 0.0409 0.1080
ZA -90 Kg N/ha 0.2263 0.0233 0.1572 0.1060 0.0350 0.0790
ZA -120 Kg N/ha 0.2091 0.0213 0.1452 0.0931 0.0323 0.0813
ZA -150 Kg N/ha 0.2508 0.0288 0.1682 0.1086 0.0394 0.1105
ZA -180 Kg N/ha 0.2637 0.0276 0.1732 0.1260 0.0374 0.0964
ZA -210 Kg N/ha 0.3290 0.0370 0.1789 0.1470 0.0473 0.0894
Average 0.2271 0.0256 0.1634 0.1093 0.0381 0.0907
Application of N fertilizers caused increases in the soybean grain yield and weight of 100 seeds and it is significantly differ than the control. Soybean grain yield and weight of 100 seed were higher and reached an average of 2.99 t/ ha and 10.54 g respectively (Table 4). Similarly number of pod was also reported at par or higher than the control and it reach up to 50.8 pod/plant on the application of urea at 180 Kg N/ha. Result of the study revealed that Application of urea shows superiority over the application of ZA (Table 4). While the other doses of N fertilizers did not show significant increases the number of pods as compared to the dose of 180 kg/ha. Lack
of crop response to fertilizer N presumably related with N fixation of indigenous Rhizobium. Generally the soil frequently
used for soybeans plantation contain enough Rhizobium
population. According to Salvagiotti et al. (2008) a negative exponential relationship was observed between N fertilizer rate and N2 fixation when N was applied in the top 0–20 cm of soil or on the soil surface. They reported highest N fixation (337 kg/ ha) in the treatment without chemical N fertilization application and a consequence exponential decline 129 and 17 kg/ha was reported in maximum N2 fixation at the application of 100 and 300 kg/ha respectively.
3.2 Rice-Rice-Soybean Cropping System
Result of the study clearly suggested that cropping pattern having soybean after rice shows better soybean growth than the soybean after soybean. The average plant height reached 67.1 cm, while the average shoot weight was reported 9.04 g/plant and it was higher than the control (Table 5). However shoot dry weight, plant height and number of branches was not affected by N fertilizer. Among the two nitrogen sources ZA shows superiority over the urea but it is not significantly differ. With respect to the response of N fertilizer, addition of sulfur powder @ 282 kg / ha (to equalize the content of S in the treatment of 210 kg N / ha of ZA) in the treatment without N increased the weight of 100-seeds from 10.16 to 10.40 g. Combination of N and S fertilizers did not have any significant effect on the weight of 100 seeds. Similarly, N fertilizer did not increase number of pods and weight of seeds per plant (Table 6). The positive influence of sulfur on the weight of 100 seeds might be related to its role in seed production and quality especially in the formation of seed proteins (Jamal et al., 2010; Devi et al., 2012; Choudhary et al., 2014).
Nitrogen fertilization had no effect on grain yield in case of grown soybean after soybean while a positive effect on grain yield was obtained in the condition of grown soybean after rice. Grain yield of soybean grown after rice without N fertilizer was 2.84 t / ha. The application of urea at 30 kg / ha increased grain yield by 0.58 t/ha (20%) to 3.42 t / ha, and it was the highest grain yield level while the using of ZA @ 90 kg / ha increased the grain yield by 0.54 t / ha (19%) to 3.38 t / ha (Table 6). These findings were different than the findings of Kuntyastuti et al. (2007) those have reported that N fertilization @ 30-210 kg / ha in clayey loam textured soils poor of N did not increase grain yield of soybean grown after rice (rice-rice-soybean) as well as after soybean (rice-soybean-soybean).
The results of this study add to the fact that response of soybean to fertilizer N has been inconsistent (Gan et al., 2003; Barker & Sawyer, 2005) which may be related to large variation in indigenous soil N supply such as net soil N mineralization, irrigation, atmospheric deposition, or other factors affecting yield responses to N (Salvagiotti et al., 2008). Although growth and grain yield of soybean grown after rice was better than soybean grown after soybean but the N uptake in both fields were relatively similar, as well as other nutrients (Table 7 and 8). This indicates that cropping pattern had no effect on nutrient uptake by soybean plants (Table 1).
Conclusion
Soybean planted after rice in rice-rice-soybean cropping pattern required 30 kg N / ha of urea or 90 kg N / ha of ZA to increase grain yield by 0.5 t / ha while soybean planted after soybean in rice-soybean-soybean cropping pattern did not require N fertilizer.
Acknowledgment
The authors thank Prof. Sudaryono in the Indonesian Legume and Tuber Crops Institute (ILETRI), for his valuable comments on the manuscript
Conflict of interest
Authors would hereby like to declare that there is no conflict of interests that could possibly arise.
References
Adisarwanto T, Kuntyastuti H, Suhartina (1998) The efficiency of fertilization using soil testing and soybeans plant on several types of wetland soil. The Increase in Input Use Efficiency, Resources and Productivity of Soybean. Balitkabi Technical Report 1997/1998 Pp 1-19.
Adisarwanto T, Riwanodja, Suhartina (1999) Study of soil and plant nutrient status and soybean yield in Entisol and Vertisol. Increasing the Efficiency of Fertilizer Use, Land Management and Soybeans Productivity. Balitkabi Technical Report 1998/1999 Pp 1-17
Adisarwanto T, Suhartina (2000) Determination of P fertilizer recommendation based on soil tests in Entisol. Increasing Efficiency of Nutrient, Water and Land Management Improvement Efficiency of Nutrient, Water and Land Management for Soybean in Entisol and Oxisol Paddy Fields. Balitkabi Final Report 1999/2000 Pp 1-15.
Adisarwanto T, Kuntyastuti H, Rahmianna AA, Riwanodja (2001) Optimization and efficiency of nutrient and organic matter management for soybean in paddy fields. In: Adisarwanto, Kuntyastuti H, Radjit BS, Manshuri AG, and Suryantini (Eds). The Optimization of Soil Physic and Crop Management and The Improvement of Soybean Seed yield Quality in Wetland and Dryland. Book II No. 1, Pp 6-56.
Al-Kaisi MM, Yin X, Licht MA (2005) Soil carbon and nitrogen changes as influenced by tillage and cropping systems in some Iowa soils. Agriculture. Ecosystems and Environment. 105:635–647. doi:10.1016/j.agee.2004.08.002.
Barker DW, Sawyer JE (2005) Nitrogen application to soybean at early reproductive development. Agronomy Journal 97: 615–619.
Choudhary P, Jhajharia A, Kumar R (2014) Influence of sulphur and zinc fertilization on yield, yield components and quality traits of soybean (Glycine Max L.). The Bioscan 9:137-142
under upland conditions. Journal of Agricultural Science 4: 1-10. DOI: 1-10.5539/jas.v4n4p1.
Dou F, Wright AL, Hons FM (2007) Depth distribution of soil organic C and N after long-term soybean cropping in Texas.
Soil & Tillage Research 94:530–536.
doi:10.1016/j.still.2006.10.001
Gan, Y, Stulen I, van Keulen H, Kuiper PJC (2003) Effect of N fertilizer topdressing at various reproductive stages on growth, N2 fixation and yield of three soybean (Glycine max (L.) Merr.) genotypes. Field Crops Research 80: 147–155. doi:10.1016/S0378-4290(02)00171-5.
Gentile R, Vanlauwe B, Chivenge P, Six J (2008) Interactive effects from combining fertilizer and organic residue inputs on nitrogen transformations. Soil Biology and Biochemistry 40:2375–2384. doi:10.1016/j.soilbio.2008.05.018.
Gomez KA, Gomez AA (1984) Statistical Procedures for Agricultural Research 2nd ed. New York. John Wiley & Sons
Jamal A, Moon YS, Abdin MZ (2010) Sulphur -a general overview and interaction with nitrogen. Australian Journal of Crop Science 4:523-529
Kuntyastuti H, Wijanarko A, Soedarjo M, Manshuri AG (2007) Nitrogen fertilizer on soybean in rice-soybean and soybean-soybean cropping pattern. In: Harnowo, Rahmiana AA, Suharsono, Muchlish MA, Rozi F, Subandi, and Makraim AK (Eds) Increasing Production of Legumes and Tuber Crops Supporting Food independency. Proceedings of National Seminar. Pp: 243-254
Riwanodja, Purwaningrahayu RD, Adisarwanto T (2001) The efficiency of fertilizer N and S on soybean in paddy fields. Nutrient and Water Management to Improve Efficiency and Productivity of Soybean. Balitkabi Technical Report 2000.
Salvagiotti F, Cassman KG, Specht JE, Walters DT, Weiss A, Dobermann A (2008) Nitrogen uptake, fixation and response to
fertilizer N in soybeans: A review. Field Crops
Research108:1–13. doi: 10.1016/j.fcr.2008.03.001.
Santoso D, Suthipradit S, Sajjapongse A (2001) Soil nutrient status as an indicator of sustainable farming systems. In: Subagyo H, Sabiham S, Shofiyati R, Siswanto AB, Irawan, Rahman A, Ropiq S (Eds) Structuring the Use of Land As Devices of Spatial Planning In Order To Increase Welfare. Proceedings of the National Congress VI HITI, held on 12-15 December 1995 Jakarta, pp 225-231.
Spiertz JHJ (2010) Nitrogen, sustainable agriculture and food security. A review. Agronomy for Sustainable Development 30:43-55. doi: 10.1051/agro:2008064
Suryantini, Kuntyastuti H (1998) The use of Rhizoplus and Urea on soybean in rice-rice-soybean and rice-soybean-soybean cropping pattern. In: Sudaryono, Soedarjo M, Widodo Y, Suyamto H (Eds.). Proceedings of the National Seminar and Annual Meeting of the Regional Commissioner HITI 1998. Book II, Pp 80-86
Suryantini, Rahmiana AA (2001) Increasing the effectiveness of rhizoplus and inorganic fertilizer for soybean productivity in Regosol and Vertisol soil through the use of organic fertilizers. In: Arsyad DM, Soejitno J, Kasno A, Sudaryono (Eds.). Performance of Technology to Increase Productivity for Legume and Tuber Crops. Agricultural Research and Development Center Pp 269-277.
Suryantini (2008) Improvement of soybean yield in paddy fields planted after rice and after soybeans through the use of organic, inorganic and biological fertilizer. Agritek 17: 422-428