164
Car Wash Wastewater Treatment Using an Advanced Oxidation Process:
A Rapid Technique for the COD Reduction of Water Pollutant Sources
Reza Davarnejad
*, Kasra Sarvmeili,
Meysam Sabzehei
Department of Chemical Engineering, Faculty of Engineering, Arak University, Arak 38156-8-8349, Iran.
*Corresponding author: Reza Davarnejad, e-mail: [email protected].: +98-9188621773 Fax: + 98-86-34173450
Received Febraury 19th, 2019; Accepted August 25th , 2019.
DOI: http://dx.doi.org/10.29356/jmcs.v63i4.786
Abstract. In this paper, a car wash wastewater (CW) was treated by an economic and eco-friendly method called electro-Fenton (EF) technique. The experiments were conducted to investigate the effect of five important variables including reaction time, current density, pH, H2O2/Fe2+ molar ratio and H2O2/Car wash
wastewater (mL/L) on the quality characteristics of wastewater such as COD, BOD5, TOC, TSS, heavy metals,
EC, surfactants and hardness. By applying Box-Behnken design (BBD) and response surface methodology (RSM), the optimum operating conditions were obtained. The optimum conditions for COD [as a main factor in a wastewater (according to the environmental protocols)] removal of 68.72% were experimentally found at reaction time of 75.80 min, current density of 58.81 mA/cm2, pH of 3.02, volume ratio of H2O2/CW of 1.62
mL/L, H2O2/Fe2+ molar ratio of 3.66.
Keywords: Car wash wastewater; electro-fenton; optimization; water quality.
Resumen. En este artículo se trató un agua residual de “car wash” (CW) con un método amigable con el medioambiente denominado electro-Fenton. Los experimentos fueron realizados para investigar el evecto de cinco variables importantes incluyendo el tiempo de reacción, la densidad de corriente, pH, la relación molar H2O2/Fe2+ y la relación H2O2/agua residual de “car wash” (mL/L) sobre la calidad del agua residual, tales como
DQO, DBO, COT, SST, metales pesados, conductividad eléctrica, surfactantes y dureza. Aplicando un diseño “Box-Behnken” (BBD) y la metodología de la superficie de respuesta (RSM por sus siglas en inglés), se determinaron las condiciones de operación optimizadas. Las condiciones optimizadas para DQO (como factro principal medido en el agua y siguiendo protocolos estandarizados) se logra remover el 68.72% a un tiempo de reacción de 75.80 min, con una densidad de corriente de 58.81 mA/cm2, pH 3.02, H2O2/CW de 1.62 mL/L y
H2O2/Fe2+ de 3.66.
Palabras clave: Agua residual de “car wash”; electro-fenton; optimización calidad de agua.
Introduction
165
problems and threatens the health of humans, due to its toxic nature, including organic compounds and heavy metals [5-7].
Car wash stations enter a large amount of contaminated wastewater into a municipal sewage cycle [8]. This wastewater contains pollutants such as detergents, grease, oils, heavy metals and organic matter which increase the amount of Biological Oxygen Demand (BOD) and Chemical Oxygen Demand (COD) in the wastewater [9]. Therefore, the treatment of this wastewater is necessary before entering urban sewage. Furthermore, the return of water from wastewater treatment to the consumption cycle reduces water consumption during the washing process at the car wash.
Various methods such as flocculation [9], membrane filtration [10], adsorption [10], biological treatment [9] and chemical oxidation [11] have been used for the treatment of car wash wastewaters(CW). The limitations in these processes and operations can be eliminated by the use of alternative methods. In the recent years, Advanced Oxidation Processes (AOP) have attracted the attention of researchers [12]. These AOPs operate on the basis of the production of oxidants such as hydroxyl radical. Hydroxyl radical is able to decompose organic pollutants during a short and non-selective contact [13-15]. In the end, organic matter decomposes into non-toxic compounds such as water and carbon dioxide when exposed to hydroxyl [16-18]. The most commonly used AOP is the Fenton process. In the Fenton reaction and in acidic conditions, electron transfer between ferrous ions (Fe2+) and H2O2 leads to hydroxyl radical production (Eq. 1) which plays a main
role in reducing COD [19, 20]:
Fe
2++
H
2
O
2→
Fe
3++ OH˚ +
OH
−(1)
Electrochemical Advanced Oxidation Processes (EAOP) can use electricity to produce hydroxyl radical [21]. The most popular process among EAOPs is the electro-Fenton (EF) process because it uses electricity as an eco-friendly source of energy. Cost-effectiveness and simplicity of operation are the other advantages to make EF suitable for wastewater treatment [22,23]. The EF process which is a combination of Fenton and electro-coagulation processes has a high impact in treating hazardous and organic pollutants [24]. In this process with in situ production of hydroxyl radical as the second most powerful oxidizing species
(E˚=2.8V) is able to oxidize organic pollutants to inorganic ones (Eqs. 2 and 3).
OH˚
+
Organic pollutants
→
Primary intermediates
(2)
Primary intermediates
+
OH˚
→CO
2+ H
2O + inorganic ions
(3)
So, an EF process was employed for the treatment of a real CW. The effect of main independent variables [such as reaction time, current density, pH, H2O2/Fe2+ molar ratio and volume ratio of H2O2/CW
166
Experimental
Materials and methods
Wastewater sampling and characteristics
The wastewater used in this study was collected from a local car wash station (Sadaf Car wash, Malayer, Iran). The samples were collected over a week (9-11 a.m. of every day). 20 L of the car wash station was prepared and stored in a plastic container. The container was transported to Arak University Chemical Engineering Research Lab and stored at 4 °C before further analysis. According to the analysis done by the Oil Industry Health Center on this wastewater, the initial quality characteristics of wastewater were reported in Table 1. The pH can be adjusted by 0.1 M H2SO4 and 0.1M NaOH (supplied by Merck Co., Quebec, Canada)
for each experiment. Since the wastewater cannot pass the environmental protocol, it should be treated. Moreover, BOD5/COD ratio is less than 1 (≈0.34). Therefore, the EF process as a rapid, easy and efficient one is suggested [28].
Table 1. Initial quality characteristics of wastewater. Water quality parameter Unit Value
COD mg/L 460
BOD5 mg/L 155
TOC mg/L 170
TSS mg/L 350
Heavy metals mg/L 366
pH 7.6
EC µs/cm 604
Surfactants µg/L 458
Hardness mg/L 740
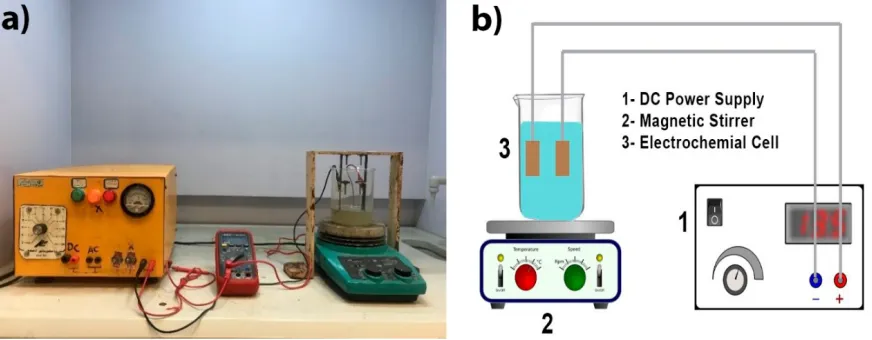
Experimental set-up
The experimental set-up main parts are DC power supply, digital magnetic mixer, 400 mL cell as the reactor and two parallel plate iron electrodes in a rectangular shape with total surface of 1cm2, where the spacing
between them was 3 cm (Fig. 1). In each run, 150 cm3 of CW was taken and its pH was measured using a pH
meter (METTLER-TOLEDO 320, Ohio, US). The pH meter was calibrated with the standard buffers kit (supplied by Merck Co.) at the room temperature (25 ± 2 °C) before each analysis. A desired amount of ferrous salt (FeSO4.H2O) and hydrogen peroxide (H2O2) were added to the cell before turning on the DC power supply.
Then, the electrodes were connected to a constant potential difference that was provided from a DC power supply (30 V and 10 A). The stirrer speed was fixed at 400 rpm (without observing vortex formation). All experiments were carried out at room temperature (25 ± 2 °C) and atmospheric pressure.
167
Fig 1. (a) EF apparatus, (b) EF schematic diagramDesign of experiments
The Design Expert software (version 10.0.0) was applied for the experiments design. As shown in Table 2 five independent variables including reaction time (X1), current density (X2), pH (X3), volume ratio of
H2O2/CW mL/L (X4) and H2O2/Fe2+ molar ratio (X5) with three level full factorial Box-Behnken response
surface experimental designs were used. Therefore, forty seven experiments were designed [27, 28]. The goal of this study was to find the optimized operating conditions for maximizing the COD removal percentage (Y%) as a main factor in the water quality consideration.
Table 2. Independent variables and their levels
Coded factors Factor
Variable
+1 0 -1
85 50 15 X1
Reaction time (min)
80 50 20 X2
Current density (mA/cm2)
5 3.5 2 X3
pH
2.5 1.4 0.3 X4
H2O2/wastewater (mL/L)
5 2.75 0.5 X5
H2O2/Fe2+
Removal percentage calculated by the following equation:
𝑌𝑌
(%) =
𝑐𝑐𝑖𝑖−𝑐𝑐0𝑐𝑐𝑖𝑖
× 100
(4)
where, Ci and C0 are initial and final concentrations, respectively. Table 3 shows experimental matrix design
168
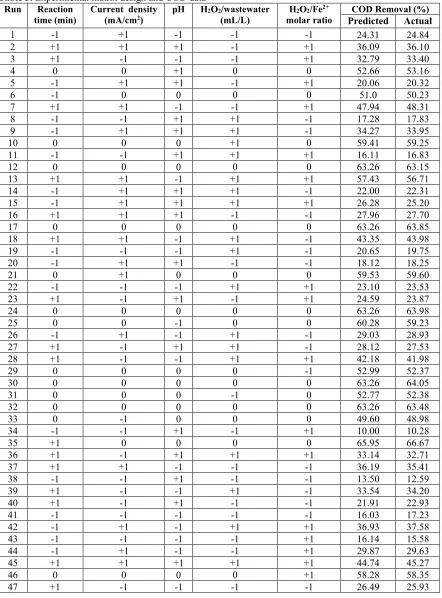
Table 3. Experimental matrix design and COD dataRun Reaction
time (min) Current(mA/cm density 2) pH H2O2(mL/L) /wastewater H2O2/Fe 2+
molar ratio PredictedCOD Removal (%)Actual
1 -1 +1 -1 -1 -1 24.31 24.84
2 +1 +1 +1 -1 +1 36.09 36.10
3 +1 -1 -1 -1 +1 32.79 33.40
4 0 0 +1 0 0 52.66 53.16
5 -1 +1 +1 -1 +1 20.06 20.32
6 -1 0 0 0 0 51.0 50.23
7 +1 +1 -1 -1 +1 47.94 48.31
8 -1 -1 +1 +1 -1 17.28 17.83
9 -1 +1 +1 +1 -1 34.27 33.95
10 0 0 0 +1 0 59.41 59.25
11 -1 -1 +1 +1 +1 16.11 16.83
12 0 0 0 0 0 63.26 63.15
13 +1 +1 -1 +1 +1 57.43 56.71
14 -1 +1 +1 +1 -1 22.00 22.31
15 -1 +1 +1 +1 +1 26.28 25.20
16 +1 +1 +1 -1 -1 27.96 27.70
17 0 0 0 0 0 63.26 63.85
18 +1 +1 -1 +1 -1 43.35 43.98
19 -1 -1 -1 +1 -1 20.65 19.75
20 -1 +1 +1 -1 -1 18.12 18.25
21 0 +1 0 0 0 59.53 59.60
22 -1 -1 -1 +1 +1 23.10 23.53
23 +1 -1 +1 -1 +1 24.59 23.87
24 0 0 0 0 0 63.26 63.98
25 0 0 -1 0 0 60.28 59.23
26 -1 +1 -1 +1 -1 29.03 28.93
27 +1 -1 +1 +1 -1 28.12 27.53
28 +1 -1 -1 +1 +1 42.18 41.98
29 0 0 0 0 -1 52.99 52.37
30 0 0 0 0 0 63.26 64.05
31 0 0 0 -1 0 52.77 52.38
32 0 0 0 0 0 63.26 63.48
33 0 -1 0 0 0 49.60 48.98
34 -1 -1 +1 -1 +1 10.00 10.28
35 +1 0 0 0 0 65.95 66.67
36 +1 -1 +1 +1 +1 33.14 32.71
37 +1 +1 -1 -1 -1 36.19 35.41
38 -1 -1 +1 -1 -1 13.50 12.59
39 +1 -1 -1 +1 -1 33.54 34.20
40 +1 -1 +1 -1 -1 21.91 22.93
41 -1 -1 -1 -1 -1 16.03 17.23
42 -1 +1 -1 +1 +1 36.93 37.58
43 -1 -1 -1 -1 +1 16.14 15.58
44 -1 +1 -1 -1 +1 29.87 29.63
45 +1 +1 +1 +1 +1 44.74 45.27
46 0 0 0 0 +1 58.28 58.35
169
Results and discussion
Regression model based on ANOVA and testing
In this paper, correlations between the response function (Y) and the independent variables were obtained by the following second-order quadratic polynomial model [29]:
𝑌𝑌
=
𝛽𝛽
0+
∑
𝑘𝑘𝑗𝑗=1𝛽𝛽
𝑗𝑗𝑥𝑥
𝑗𝑗+
∑ 𝛽𝛽
𝑖𝑖<𝑗𝑗 𝑖𝑖𝑗𝑗𝑥𝑥
𝑖𝑖𝑥𝑥
𝑗𝑗+
∑
𝑘𝑘𝑗𝑗=1𝛽𝛽
𝑗𝑗𝑗𝑗𝑥𝑥
𝑗𝑗2+
∈
(5)
where, Y is the response. β0 is a constant coefficient. βj, βijand βjj are the coefficients for the linear, quadratic
and interaction effects, respectively. Xi and Xj are the coded levels for the independent variables. K is the
number of independent variables and ɛ is the random error.
The following equation presents the BBD model for COD removal percentage obtained from the software. In fact, it shows the relation between all responses and operating variables.
COD(%)=
63.26 + 7.23
𝑋𝑋
1+ 4.97
𝑋𝑋
2−
3.81
𝑋𝑋
3+ 3.32
𝑋𝑋
4+ 2.64
𝑋𝑋
5+
0.36
𝑋𝑋
1𝑋𝑋
2−
0.51
𝑋𝑋
1𝑋𝑋
3+ 0.61
𝑋𝑋
1𝑋𝑋
4+ 1.55
𝑋𝑋
1𝑋𝑋
5−
0.91
𝑋𝑋
2𝑋𝑋
3+
0.26
𝑋𝑋
2𝑋𝑋
4+ 1.36
𝑋𝑋
2𝑋𝑋
5−
0.21
𝑋𝑋
3𝑋𝑋
4−
0.90
𝑋𝑋
3𝑋𝑋
5+ 0.59
𝑋𝑋
4𝑋𝑋
5−
4.54
𝑋𝑋
12−
8.70
𝑋𝑋
22−
6.79
𝑋𝑋
32−
7.17
𝑋𝑋
42−
7.63
𝑋𝑋
52(6)
where, X1, X2, X3, X4 and X5 are reaction time (min), pH, current density (mA/cm2), H2O2/wastewater volume
ratio and H2O2/Fe2+ molar ratio, respectively. The experimental and predicted data (obtained from Eq. 6) for
COD are shown in Table 3, as well.
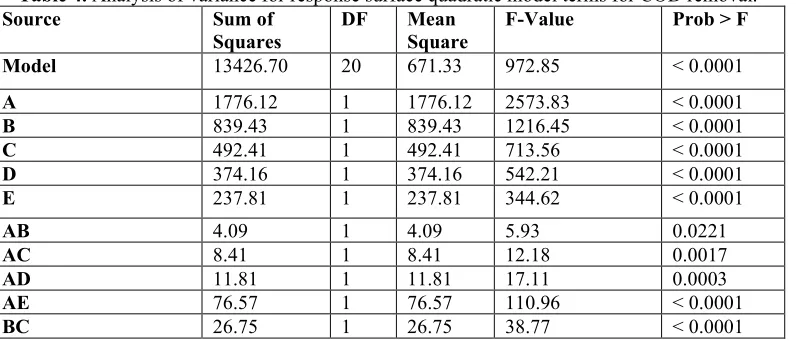
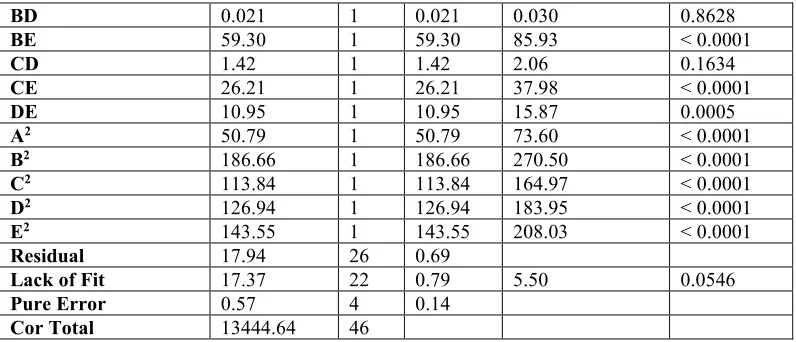
ANOVA analysis
Table 4 shows analysis of variance (ANOVA) for response surface quadratic model terms for COD removal. They will be significant when Prob > F values are less than 0.05. A model can properly predict the response when R2 is close to one. Therefore, X1, X2, X3, X4, X5, X1X2, X1X4, X2X3, X2X4, X2X5, X3X4, X4X5,
X12, X22, X32, X42, X52 terms for COD removal were significant and non-negligible terms. There is a good
agreement between the predicted data and the experimental ones since the R2 equals to 0.9987 for COD. As the
R2, R2 adjusted, R2 predicted amounts are close to one, it can be concluded that regression model is appropriate
for this research as illustrated in Table 5 [30].
Table 4. Analysis of variance for response surface quadratic model terms for COD removal.
Source Sum of
Squares DF Mean Square F-Value Prob > F
Model 13426.70 20 671.33 972.85 < 0.0001
A 1776.12 1 1776.12 2573.83 < 0.0001
B 839.43 1 839.43 1216.45 < 0.0001
C 492.41 1 492.41 713.56 < 0.0001
D 374.16 1 374.16 542.21 < 0.0001
E 237.81 1 237.81 344.62 < 0.0001
AB 4.09 1 4.09 5.93 0.0221
AC 8.41 1 8.41 12.18 0.0017
AD 11.81 1 11.81 17.11 0.0003
AE 76.57 1 76.57 110.96 < 0.0001
170
BD 0.021 1 0.021 0.030 0.8628
BE 59.30 1 59.30 85.93 < 0.0001
CD 1.42 1 1.42 2.06 0.1634
CE 26.21 1 26.21 37.98 < 0.0001
DE 10.95 1 10.95 15.87 0.0005
A2 50.79 1 50.79 73.60 < 0.0001
B2 186.66 1 186.66 270.50 < 0.0001
C2 113.84 1 113.84 164.97 < 0.0001
D2 126.94 1 126.94 183.95 < 0.0001
E2 143.55 1 143.55 208.03 < 0.0001
Residual 17.94 26 0.69
Lack of Fit 17.37 22 0.79 5.50 0.0546
Pure Error 0.57 4 0.14
Cor Total 13444.64 46
Table 5. Quadratic model ANOVA result for COD removal.
COD Removal Variable
0.83 Standard Deviation
38.07 Mean
0.9987
2
R
0.9976 adjusted
2
R
0.9952 predicted
2
R
2.18 Coefficient of variance (C.V)
64.74 Press
100.773 Adequate precision
171
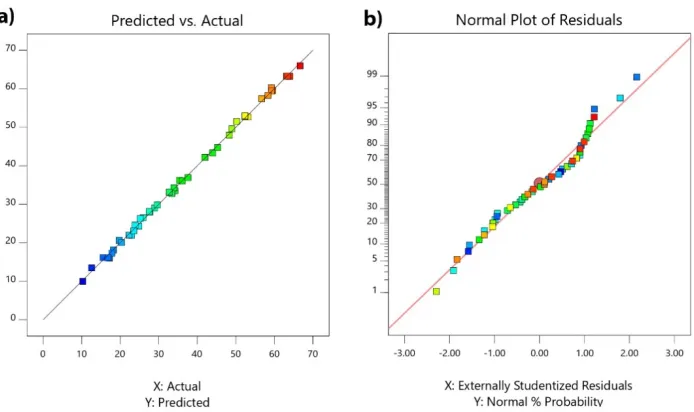
Fig. 2. (a) Predicted data versus actual ones, (b) Normal plot of residuals.Three dimensional plots for the regression model
172
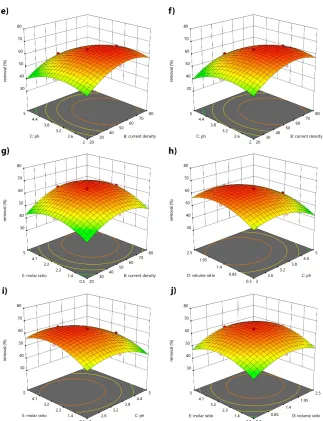
Fig. 3. Three-dimensional surface of COD removal (as a water quality sample) as a function: (a) reaction time and current density, (b) reaction time and pH, (c) reaction time and H2O2/CW (mL/L), (d) reaction time andH2O2/Fe2+, (e) current density and pH, (f) current density and H2O2/CW (mL/L), (g) current density and
H2O2/Fe2+, (h) pH and H2O2/CW (mL/L), (i) pH and H2O2/Fe2+, (j) H2O2/CW (mL/L) and H2O2/Fe2+.
Effect of pH
The pH is one of the most important parameters for the EF process because it controls the hydroxyl radical formation [33]. In fact, hydroxyl radical formation can be expected to play a significant role during the EF reaction. The COD changes with pH are shown in Figs. 3(b), 3(e), 3(h) and 3(i). It affects the ferrous ions speciation and hydrogen peroxide decomposition. The ferrous ions precipitate when pH increases. In fact, it inhibits the ferrous ions regeneration. Therefore, the Fenton reaction rate decreases. Moreover, hydrogen peroxide cannot be decomposed to hydroxyl radical by Fe2+ when pH is less than two. It seems that hydrogen
173
peroxide and Fe2+ reaction rate will be decreased. The highest COD removal (66.67%) was obtained at pH of
3.5 [34-37]. The Fenton's reaction in the bulk of solution was promoted when the produced hydrogen peroxide reacted with Fe2+. Furthermore, the hydroxyl radicals generated at the reaction increase [34,38,39].
Effect of current density
The current density is directly related to COD removal. The effect of current density (20-80 A/m2) on
COD removal are shown in Figs. 3(a), 3(e) 3(f) and 3(g) [30,40]. The COD removal increases with increasing the current density. In fact, this is due to increasing ferrous ions regeneration from ferric ions at cathode in high current densities. It then enhances the Fenton reaction and increases the hydroxyl radical generation at the anode surface [41]. Moreover, the removal will be decreased after a certain point of current density. This may due to the competitive reactions in the cell. The oxygen production on anode and the hydrogen production on cathode occur at high current densities.
Effect of reaction time
The effect of reaction time on COD removal is shown in Figs. 3(a), 3(b), 3(c) and 3(d). The COD removal increases, and it reaches a maximum value of 66.67% at reaction time of 85 min. It seems that the reaction time of 85 min is enough for the COD removal. This is due to large amount of hydrogen peroxide production which causes H2O2 decomposition to oxygen and water. Moreover, combination of hydroxyl radicals
decreases their concentration in the solution [30].
Effects of H
2O
2/Fe
2+molar ratio and volume ratio of H2O2/CW
According to Figs. 3(c), 3(f), 3(h) and 3(j), COD removal increased with H2O2 amount increment. On
the other side, the molar ratio is a significant factor in the EF process which directly affects on the economical aspects of the process. Effects of H2O2/Fe2+ molar ratio on the COD removal are shown in Figs. 3(d), 3(g), 3(i)
and 3(j). It can be observed that increasing the H2O2/Fe2+ molar ratio increases the amount of COD removal, as
well [42].
As shown in these figures, hydroxyl radicals are decomposed by excessive hydrogen peroxide. In this side reaction, hydrogen peroxide and hydroxyl radical react and a weaker oxidant (hydroperoxyl radical) is produced (Eq. 7) [28,40].
OH
°+H
2
O
2→H
2O+ HO
2°(7)
Optimization and validation
Numerical optimization was done to find the maximum value of COD and the other water quality parameters removal. The optimum conditions were statistically obtained at reaction time of 75.80 min, current density of 58.81 mA/cm2, pH of 3.02, volume fraction of H2O2/CW of 1.62(ml/ l) and H2O2/Fe2+ molar ratio of
174
Table 6. Optimizedoperating data obtained from the software for all water quality parameters.Water quality parameter
Operating Parameters Reaction
time (min)
Current density (mA/cm2)
pH H2O2/wastewater
(mL/L) H2O2/Fe
2+
molar ratio
COD 75.80 58.81 3.02 1.62 3.66
BOD5 60.20 75.14 2.88 2.02 2.79
TOC 80.05 66.12 3.56 1.25 3.65
TSS 69.44 55.36 2.94 2.14 2.94
Heavy metals 74.36 76.80 2.69 1.07 3.26
EC 82.30 70.05 3.14 1.85 3.78
Surfactants 68.88 61.55 3.66 1.53 2.80
Hardness 78.66 44.14 3.00 1.66 3.60
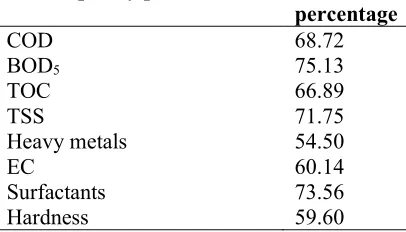
Table 7. Removal percentage values at the optimum conditions for all water quality parameters.
Water quality parameter
Removal
percentage
COD
68.72
BOD
575.13
TOC
66.89
TSS
71.75
Heavy metals
54.50
EC
60.14
Surfactants
73.56
Hardness
59.60
Conclusion
The EF process as an efficient, simple and eco-friendly technique was proposed for the treatment of a real CW. However, the dissolved organic pollutants are mineralized in inorganic sludge during the electro-Fenton process and abundance of suspended solids facilitates the mineralization process but, formation of an impermeable film layer may reduce the reduction of Fe3+ on the cathode and reduce the process efficiency.
ANOVA showed good coefficient of determination values (R2 > 0.99) for the correlation. According to the
analysis, reaction time had a very significant effect on the COD removal. Since CW COD reduced to 143.88 mg/L (at the optimum conditions), a series of EF process or another supplementary treatment (applicable for lower COD values such as biological treatment) is requested for lower COD values than this however it properly satisfies the environmental standards.
References
1. Distefano, T.; Kelly, S. Ecological Economics 2017, 142, 130-147.
175
4. Kim, S.; Chu, K.H.; Al-Hamadani, Y.A.J.; Park, C.M.; Jang, M.; Kim, D-H.; Yu, M.; Heo, J.; Yoon, Y. Chemical Engineering Journal 2018, 335, 896-914.
5. Zietzschmann, F.; Stützer, C.; Jekel, M.; Water Research 2016, 92, 180-187.
6. Zietzschmann, F.; Altmann, J.; Hannemann, C.; Jekel, M. Water Research 2015, 83, 52-60. 7. Liu, C-H.; Wu, J-S.; Chiu, H-C.; Suen, S-Y.; Chu, K.H. Water Research 2007, 41, 1491-1500. 8. Panizza, M.; Cerisola, G Journal of Electroanalytical Chemistry 2010, 638, 236-240.
9. Zaneti, R.; Etchepare, R.; Rubio, J. Resources, Conservation and Recycling 2011, 55, 953-959. 10.Pinto, A.C.S.; de Barros Grossi, L.; de Melo, R.A.C.; de Assis, T.M.; Ribeiro, V.M.; Amaral, M.C.S.;
de Souza Figueiredo, K.C. Journal of Water Process Engineering 2017, 17, 143-148.
11.Magnago, R.F.; Berselli, D.; Medeiros, P. Journal of Engineering Science and Technology 2018,13,838-50.
12.Lee, H.; Shoda, M. Journal of Hazardous Materials 2008, 153, 1314-1319.
13.Golbaz, S.; Jonidi Jafari, A.; Rezaei Kalantari, R. Iranian Journal of Health and Environment 2013, 5, 423-432.
14.Ghoneim, M.M., El-Desoky, H.S.; Zidan, N.M. Desalination 2011, 274, 22-30.
15.Karimi, A.; Mahdizadeh, F.; Eskandarian, M. Chemical Industry and Chemical Engineering Quarterly/CICEQ 2012, 18, 89-94.
16.Gençten, M.; Özcan, A. Chemosphere 2015, 136, 167-173.
17.Loaiza-Ambuludi, S.; Panizza, M.; Oturan, N.; Özcan, A.; Oturan, M.A. Journal of Electroanalytical Chemistry 2013, 702, 31-36.
18.Khataee, A.; Vatanpour, V.; Ghadim, A.A. Journal of Hazardous Materials 2009, 161, 1225-1233. 19.Mohanty, N.R.; Wei, I.W. Hazardous Waste and Hazardous Materials 1993, 10, 171-183.
20.Safarzadeh-Amiri, A.; Bolton, J.R.; Cater, S.R. Journal of Advanced Oxidation Technologies 1996, 1, 18-26.
21.Atmaca, E. Journal of Hazardous Materials 2009, 163, 109-114. 22.Nidheesh, P.V.; Gandhimathi, R. Desalination 2012, 299, 1-15.
23.Rosales, E.; Pazos, M.; Sanroman, M.A. Chemical Engineering & Technology 2012, 35, 609-617. 24.Davarnejad, R.; Sabzehei, M. Separation Science and Technology 2018, 4,1-0.
25.Zhang, H.; Jin Choi, H.; Canazo, P.; Huang, C.P. Journal of Hazardous Materials 2009, 161, 1306-1312.
26.Virkutyte, J.; Rokhina, E.; Jegatheesan, V. Bioresource Technology 2009, 101, 1440-1446.
27.Kabuk, H.A.; İlhan, F.; Avsar, Y.; Kurt, U.; Apaydin, O.; Gonullu, M.T. CLEAN – Soil, Air, Water 2013, 42, 571-577.
28.Davarnejad, R.; Nikseresht, M. Journal of Electroanalytical Chemistry 2016, 775, 364-373.
29.El-Ghenymy, A.; Garcia-Segura, S.; Rodríguez, R.M.; Brillas, E.; El Begrani, M.S.; Abdelouahid, B.A. Journal of Hazardous Materials 2012, 221-222, 288-297.
30.Davarnejad, R.; Mohammadi, M.; Ismail, A.F. Journal of Water Process Engineering 2014, 3, 18-25. 31.Ghaemi, N.; Zereshki, S.; Heidari, S. Process Safety and Environmental Protection 2017, 111,475-90. 32.Körbahti, B.K.; Aktaş, N.; Tanyolaç, A. Journal of Hazardous Materials 2007, 148, 83-90.
33.Babuponnusami, A.; Muthukumar, K. Separation and Purification Technology 2012, 98, 130-135. 34.Jiang, C-c.; Zhang, J-f. Journal of Zhejiang University-SCIENCE A 2007, 8, 1118-1125.
35.Nidheesh, P.; Gandhimathi, R. Desalination 2012, 299, 1-15.
36.Mohajeri, S.; Aziz, H.A.; Isa, M.H.; Zahed, M.A.; Adlan, M.N. Journal of Hazardous Materials 2010, 176, 749-758.
37.Badawy, M.I.; Ali, M. Journal of Hazardous Materials 2006, 136, 961-966. 38.Babuponnusami, A.; Muthukumar, K. CLEAN – Soil, Air, Water 2011, 39, 142-147.
39.Buxton, G.V.; Greenstock, C.L.; Helman, W.P.; Ross, A.B. Journal of Physical and Chemical Reference Data 1998, 17, 513-886.
40.Davarnejad, R.; Sahraei, A. Desalination and Water Treatment 2016, 57, 9622-9634. 41.Moussavi, G.; Aqanaghad, M. Sustain Environ Res 2015, 25, 249-254.