Application of a
S
equential Data Assimilation
Technique to Improve Modeling of Surface
Currents Using Radar Data at a Coastal Domain
Lei Ren
1,*and Michael Hartnett
21 School of Marine Engineering and Technology, Sun Yat-sen University, China 2 College of Engineering & Informatics, National University of Ireland, Galway, Ireland
[email protected], [email protected]
Abstract
Numerical model is generally to simulate hydrodynamic parameters such as surface currents. However, it has limits such as difficulty in definition of initial and boundary conditions. As remote sensing such as satellite and radars advances and is applied in practice. Data assimilation technique has becoming a promising means to improve modeling performance through taking advantages of available observations. In this paper, surface currents hourly monitored by a radar system were assimilated into a 3D numerical model to improve modeling performance using a sequential data assimilation algorithm. Results indicated that application proposed data assimilation approach not only improved hindcasting of surface flow fields, but also improved its forecasting.
1
Introduction
Modelling of surface currents is an activity of great importance in coastal regions in marine science. It is not only useful for operation- and planning-related decisions such as vessel towing and search and rescue, but also useful for fisheries and recreational activities such as yachting and boating. Since definition of initial and boundary conditions in numerical models affect model performance to a large extent, in order to improve modelling performance of surface currents accompanying by advances in marine observation platforms such as satellite and radars, data assimilation technique that combines observed data with model states has increasingly becoming a promising means [1, 2]. In this work, surface currents with fine temporal and spatial resolution are
Volume 3, 2018, Pages 1752–1757
introduction about research domain, radar data, numerical model and data assimilation algorithm. Results are given in Section 3, followed by conclusions in Section 4.
2
Methodologies
2.1 Research Domain
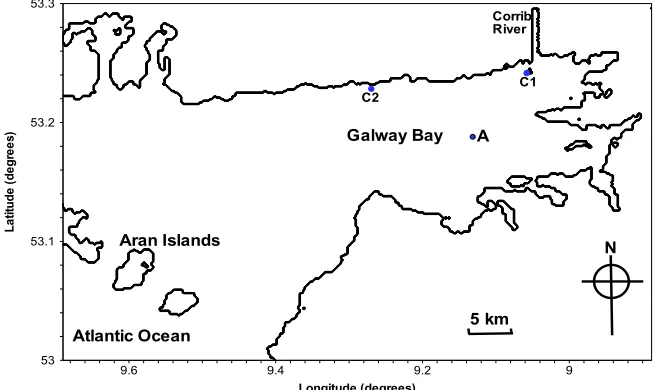
Galway Bay is located at the west coast of Ireland. Variations in surface currents in Galway Bay area are mainly tide and wind-induced [3]. A radar monitoring system with fine temporal and spatial resolution has been deployed in Galway Bay since 2011. Figure 1 shows deployment of the radar system in Galway Bay.
Figure 1 Deployment of HF radar system in Galway Bay (C1 and C2 indicates the HF radar stations)
2.2 Radar data
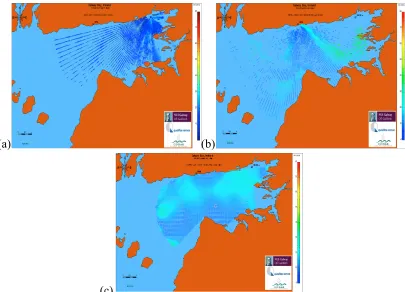
CODAR is a land-based high frequency remotely sensing radar system that measures the near-surface ocean currents in a coastal area with fine temporal and spatial resolutions. One such system, consisting of two radar masts, was deployed on Galway Bay (see Figure 1) in 2011. This system is capable of monitoring the surface currents and wave parameters over most of inner Galway Bay. Measurements obtained from the CODAR system are in near real time. When a radar signal scatters off a wave whose wavelength is exactly equal to half of the transmitted signal wavelength, the radar signal can return measurement information to the radar receiver [4-6]. A single HF radar station determines radial components of surface currents toward and away from that station. Total surface currents are computed and displayed as vector fields, by combining the radial surface current velocity components from two or more different masts [7, 8], see Figure 2.
Longitude (degrees)
L
at
itu
d
e
(d
eg
re
es
)
9 9.2
9.4 9.6
53 53.1 53.2 53.3
Corrib River
Galway Bay A
C2
C1
Aran Islands
Atlantic Ocean
N
(a)
(b)
(c)
Figure 2Surface currents observed by CODAR ((a) radial surface vector field from station C1, (b) radial surface vector field from station C2, (c) total surface vector field after combination)
The temporal and spatial resolutions of surface currents in the Galway Bay domain are sixty minutes and 300 m, respectively. The operating frequency of both radar stations in Galway Bay at C1 and C2, as shown in Figure 1, is 25 MHz.
2.3 Numerical model
The numerical model, EFDC, was used to simulate the hydrodynamic circulation of Galway Bay. Only the hydrodynamic module was used during this research. In this research, a barotropic model of Galway Bay (see Figure 1) was developed using a regular grid coordinate system. A detailed description on setting up vertical layer structure for the Galway Bay can be found in the study by Ren, Nash and Hartnett [9]. The meteorological forcing data were obtained at one-minute intervals from the Informatics Research Unit for Sustainable Engineering (IRUSE) weather station. Records of the River Corrib inflows, which enter Galway Bay close to the north of point C1 in Figure 1, were obtained from the Irish Office of Public Works (OPW). Tidal water elevation time series generated from Oregon State University Tidal Inversion Software (OTIS). The simulation period was from Julian Day 211 to 230 in 2013; spin-up period is Julian Day 211–220; data assimilation period is Julian Day 220–228 01:00; forecasting period is from Julian Day 228 01:00.
where, U is the model background states; U/ is the observation states from radars; λ is the nudging parameter;(physics) denotes the physical process mathematically described in the numerical model. Simplified nudging parameter λ is used in this work.
λ = 11
t34 × e
17
784 (2)
where, t3 is an assimilation timescale, which determines the strength of the nudging parameter; t: is
a damping time scale for the nudging term; e17874 is the exponential decay parameter, which controls
the depth of influence of the nudging parameter; z is the water depth (m); z: is the depth of influence (m).
3
Results
Sensitivity experiments on nudging data assimilation parameters and assimilation cycle length were examined. Analysis indicated that the best assimilation timescale and depth of influence is 1800s and 4m respectively. The best data assimilation is to combine interpolated radar data into model at each model computation time step.
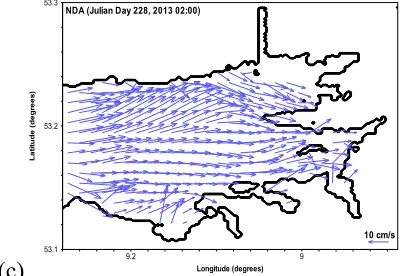
In order to show modelling performance after employing data assimilation technique, surface flow fields at a representative forecasting time step are shown in Figure 3. FR indicates the “Free Run” model without employing data assimilation; NDA indicates the best nudging data assimilation model.
(a)
Longitude (degrees)(b)
L a ti tu d e (d e g re e s ) 9 9.2 53.1 53.2 53.3 10 cm/s FR (Julian Day 228, 2013 02:00)
(c)
Figure 3 Forecasting of surface flow fields at 02:00 Julian Day 228 ((a) model FR; (b) radar data; (c) model NDA)
Figure 3 shows that pattern of surface flow trend in model NDA is closer to radar data then model FR. This indicates assimilation procedure had improved modelling forecasts.
4
Conclusions
Real-time radar measurements were blended into a numerical model EFDC using a nudging data assimilation algorithm. The most appropriate nudging parameters were determined based on sensitivity experiments. Assimilation of the remotely sensing radar data at each model computational time step resulted in a good forecasting performance compared with a “free run” model and models with longer data assimilation cycle lengths. Comparison indicates that assimilation of radar data using a nudging algorithm is a powerful tool for improving model performance. The nudging algorithm has been shown to be particularly useful when updating is applied at each model computational time step. These forecasts can provide useful information for a variety of applications, such as search and rescue and oil spill operations.
Acknowledgments
Authors would like to thank Informatics Research Unit for Sustainable Engineering (IRUSE) for providing the weather data, Oregon State University (OSU) for providing the OTIS tide software, and Ireland’s High-Performance Computing Centre (ICHEC) for providing computation service.
References
[1] L. Ren, M. Hartnett, Sensitivity analysis of a data assimilation technique for hindcasting and forecasting hydrodynamics of a complex coastal water body, Computers & Geosciences, 99 (2016) 81-90.
[2] L. Ren, S. Nash, M. Hartnett, Forecasting of Surface Currents via Correcting Wind Stress with Longitude (degrees)
L
a
ti
tu
d
e
(d
e
g
re
e
s
)
9 9.2
53.1 53.2 53.3
[4] J. Wang, R. Dizaji, A.M. Ponsford, Analysis of clutter distribution in bistatic high frequency surface wave radar, in: Conference on Electrical & Computer Engineering, IEEE, Canada, 2004, pp. 1301-1304.
[5] B.K. Haus, J.D. Wang, J. Rivera, J. Martinez-Pedraja, N. Smith, Remote Radar Measurement of Shelf Currents off Key Largo, Florida, U.S.A, Estuarine, Coastal and Shelf Science, 51 (2000) 553-569.
[6] T.O. Ojo, J.S. Bonner, C.A. Page, Simulation of constituent transport using a reduced 3D constituent transport model (CTM) driven by HF Radar: Model application and error analysis, Environmental Modelling & Software, 22 (2007) 488-501.
[7] B. Lipa, D. Barrick, A. Alonso-Martirena, M. Fernandes, M. Ferrer, B. Nyden, Brahan Project High Frequency Radar Ocean Measurements: Currents, Winds, Waves and Their Interactions, Remote Sensing, 6 (2014) 12094-12117.
[8] B. Lipa, C. Whelan, B. Rector, B. Nyden, HF Radar Bistatic Measurement of Surface Current Velocities: Drifter Comparisons and Radar Consistency Checks, Remote Sensing, 1 (2009) 1190-1211.
[9] L. Ren, S. Nash, M. Hartnett, Observation and modeling of tide- and wind-induced surface currents in Galway Bay, Water Science and Engineering, 8 (2015) 345-352.
[10] G. Gopalakrishnan, A.F. Blumberg, Assimilation of HF radar-derived surface currents on tidal-timescales, Journal of Operational Oceanography, 5 (2012) 75-87.