R E S E A R C H A R T I C L E
Open Access
Controlled testing of novel portion control
plate produces smaller self-selected portion
sizes compared to regular dinner plate
Joel W. Hughes
1*, Carly M. Goldstein
2, Carly Logan
3, Jessica L. Mulvany
1, Misty A. W. Hawkins
4, Amy F. Sato
1and John Gunstad
1Abstract
Background:Obesity is a global health crisis, and portion control is a key method for reducing excess body weight. Given consumers’familiarity with large portion sizes, reducing portion sizes can be difficult. Smaller plates are often recommended to reduce portion sizes and appear to reduce portion sizes. However, there are no studies evaluating dishes specifically designed to facilitate portion control. The aim of the present study was to validate the efficacy of a novel portion control plate inspired by the Ebbinghaus and Delboeuf visual illusions to promote serving smaller portions compared to a larger dinner plate.
Methods:In two studies with a total of 110 university students, we determined whether the use of the portion control plate would result in smaller food portions compared to a larger dinner plate. The portion control plate was smaller and incorporated portion size indicators. Study 1 used instructions from My Plate based on plate ratios (e.g.,“the USDA recommends filling half your plate with vegetables”) and study 2 used absolute portion size recommendations (e.g.,“1 cup of vegetables”).
Results:The portion control plate produced smaller self-selected servings in both studies. However, the servings of vegetables selected were smaller than recommended portion sizes for both the portion control plate and the regular dinner plate.
Conclusions:Portion control plates have the potential to reduce self-selected portion sizes. Future research should include studies in a broader range of ages and clinical trials of portion control dishes for weight loss.
Keywords:Portion size, Obesity, Overweight, Energy intake, Cognitive science, Optical illusions
Background
Obesity has been declared an epidemic by the World Health Organization [1, 2] as nearly 35% of individuals in the United States are obese [3] and the worldwide prevalence of obesity has risen to 36.9% for men and 38% for women [4]. One reason for the obesity epidemic is the excess intake of energy combined with reduced energy expenditure, with large portion sizes implicated as a key player in promoting this imbalance [5]. Many food portions sold in the United States exceed the United States Department of Agriculture (USDA) and
Food and Drug Administration (FDA) standards by alarming proportions [6]. For example, typical cookies average 700% larger than USDA standards, cooked pasta 480% larger, steaks 224% larger, and bagels 195% larger [7]. As might be expected, portion control strategies are commonly recommended [8] and were emphasized in the 2010 and 2015 USDA dietary guidelines [4, 9]. Un-fortunately, many persons have difficulty learning the healthy portion sizes for different foods and consistently consuming those amounts [10]. Accordingly, the need for tools to enhance portion control is clear and has in-spired investigations of the influence of serving dishes and plates design on portion size and food consumption. Based on the Delboeuf illusion (Fig. 1; [11, 12]), in which a similar amount of food looks larger on a smaller vs. * Correspondence:[email protected]
1Department of Psychological Sciences, Kent State University, P.O. Box 5190,
Kent, Ohio 44242, USA
Full list of author information is available at the end of the article
larger plate, the recommendation to use smaller plates is now widespread.
The recommendation to use smaller plates appears supported by a recent meta-analysis which concluded that larger plate sizes result in greater self-selected por-tion sizes and food consumed, but that plate size did not affect consumption of fixed portion sizes from different sized plates [13]. Furthermore, the effect of plate size was stronger when people were not aware that they were in a food study, such as when they were distracted with other tasks or participating under a cover story [13, 14]. Another systematic review concluded that dishware size does not have a consistent effect on food intake. [15] However, there is little research on the intentional use of portion control dishware.
We reasoned that people using portion control dishes would be attempting to reduce portion sizes to reduce
caloric intake. For example, a randomised clinical trial employing a commercially available portion control plate and bowl (The Diet Plate, Glossop, England [16]) in a weight loss intervention for patients with type 2 diabetes reported greater weight loss in the group using the por-tion control dishware than in the treatment-as-usual control group [17]. In this trial the portion control dish-ware was not merely smaller than comparison dishes, but instead had portion size indicators for common foods.
Portion control dishes designed to incorporate both portion size indicators and visual illusions from the cog-nitive science literature might be effective in reducing portion sizes. The senior authors (JWH and JG) designed a plate inspired by the Delboeuf illusion (Fig. 1; [11, 18]) and the Ebbinghaus illusion (Fig. 2; [19]). In the Delboeuf illusion, the two inner solid “circles” (represented by Fig. 1Delboeuf Illusion. Permission to use this figure was not required because this figure was created by the lead author
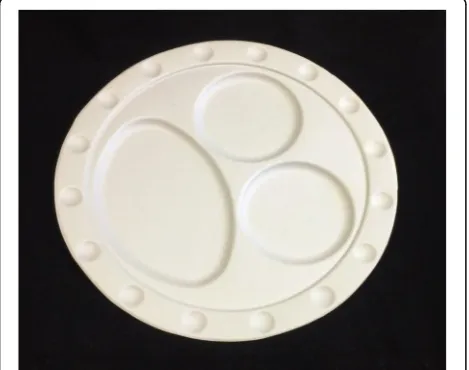
apples in Fig. 2) are the same size. In the Ebbinghaus illusion, a circle appears larger if it is surrounded by smaller circles. We also added portion size indicators consistent with standard portion sizes (in the USA) for fruit or vegetables (1 cup/236.6 ml), grains or starches (1/2 cup/118.3 ml), and protein (3 oz./85 g) [4, 9] (see Fig. 3). The intent was to create a plate that facilitates selecting appropriate portion sizes on a relatively small plate. Here we report the initial validation experiments using this design.
We tested the efficacy of a portion control plate de-signed to promote the serving and consumption of smaller portions. In two studies, we determined whether use of the portion control plate would result in selection of smaller portions compared to a large dinner plate. We hy-pothesized that participants would place less food onto the portion control plate compared to the comparison plate. Study 1 used instructions based on plate ratios from myplate.gov (e.g.,“the USDA recommends filling half your plate with fruits or vegetables.”). Study 2 used instructions based on serving sizes (e.g.,“1 cup fruits or vegetables”). Study 2 was conducted because the instructions given in Study 1 could result in exaggerated differences between portion sizes for the different plates. That is, the portion sizes participants were instructed to select were relative in Study 1 (“1/2 the plate”) vs absolute in Study 2 (“1 cup”).
Methods
Design
Both studies used a 2 (plate: portion control versus com-parison) × 2 (order: portion control first versus portion control second) design. All participants used both plates in order to increase power by controlling individual dif-ferences (e.g., hunger, food serving habits). A delay of
10 min elapsed between conditions, and the order of plate presentation was counterbalanced across subjects.
Materials
A portion control plate was designed for the present study by the senior authors (JWH and JG) and proto-typed using vacuum forming from food-grade plastic material (see Fig. 3). This plate combines the Delboeuf and Ebbinghaus illusions in an attempt to increase the perceived portion size of food served. The plate mea-sures 25 cm in diameter (area = 490.87 cm2), and has a border of 2 cm leaving a 21 cm diameter area for plating food. The plate also has serving size indicators for grains/starches, protein, and fruit/vegetables, which reduce the usable plating area. The protein and grains circles are 8.5 cm in diameter and .5 cm deep. The fruit/vegetable oval was 14.5 cm by 9.5 cm. For comparison, large white porcelain dinner plates were purchased from an online re-tailer [20]. The plate chosen was a 30.48 cm diameter (area = 729.7 cm2) white porcelain plate (Model COP-21 by CAC China [21]) and had no distinguishing markings (e.g., border, edge) (see Fig. 4).
Three slow cookers with a 4.7 l capacity were used to prepare protein, grain and vegetables to be portioned onto the plates by participants. The protein chosen was Tyson® Grilled & Ready® Chicken Breast Strips (Tyson, Inc., Springdale, AR, USA). The grain was FoodClub® enriched long grain rice (Topco Holdings, Inc., Topco Associates LLC., Elk Grove Village, IL, USA). The vegeta-bles were FoodClub®canned sweet peas (Topco Holdings, Inc., Topco Associates LLC., Elk Grove Village, IL, USA). The slow cookers were approximately 80% full and maintained at a uniform level of fullness for all study participants.
Fig. 3Portion control plate inspired by the Delboeuf and Ebbinghaus
Participants and procedures
Participants were recruited through a psychology depart-ment research recruitdepart-ment system as well as from poster advertisements distributed across the campus of a large, Midwestern university in the United States. Few inclu-sion and excluinclu-sion criteria were specified; participants were English-speaking university students and were asked not to participate if they reported intolerance or allergy to the foods used (although they were not con-sumed). Study 1 included 70 university undergraduates (47 females and 23 males) aged 18 to 33 who partici-pated in the first study (see Table 1). Study 2 included 40 undergraduates (29 females and 11 males) aged 18–30 (see Table 2). No individuals participated in both studies.
Both studies took place in a university psychology la-boratory setting. Participants completed the procedures individually and used the plates in a private room that did not contain any measuring devices (e.g., scale). Par-ticipants provided informed consent and completed a demographics form. The participants were then presented with the first plate trial. The type of plate they received first (portion control plate or comparison dinner plate) was randomized. For study 1, participants were instructed that “the USDA recommends filling half your plate with fruits or vegetables, one quarter of your plate protein, and one quarter of your plate grains,” consistent with USDA guidelines [4] and the MyPlate [22, 23] guidelines. For study 2, participants were instructed to select amounts consistent with one portion of each of three types of food:
“3 ounces of protein, 1 cup of vegetables, and one half cup of grains.” When giving instructions for the portion con-trol plate, researchers pointed to each of the serving size indicators. After serving food onto the first plate, partici-pants completed self-report questionnaires for 10 min as a distractor task. The questionnaires included The Penn State Worry Questionnaire [24], a questionnaire that inquired about texting and driving, and a questionnaire that asked questions about smartphone application
usage. After working on the distractor items for 10 min, the participants were presented with the alternate plate and were given the same instructions for portion-ing food onto the plate. Out of sight of the participants, the food that had been served onto the plates was then weighed in grams. Height, weight, and BMI were re-corded for each subject following portioning out the food onto both plates (see Tables 1 and 2). At the end of the study, subjects were compensated and debriefed.
Measures
An Ohaus Scout Pro SP2001 electronic scale was used to weigh the food to the hundredth gram after each trial (Parsippany, NJ, USA). A demographics and health be-havior survey form was used to record information on age, gender, height, weight, years of education, employ-ment type/status, race, and the presence of any chronic medical conditions. Height and weight were measured after other study procedures using a Detecto model 439 balance scale with height bar (Detecto Scale, Webb City, MO, USA).
Data analysis
All analyses were performed using IBM SPSS (version 22, IBM Corporation, Armonk, NY, USA). Multiple 2 (gender: male versus female) × 2 (plate: portion control versus comparison) × 2 (order: portion control plate first versus second) analyses of variance were conducted to compare portion sizes in grams. Plate was a repeated measures variable. Effects with p< .05 were considered significant. We did not correct for multiple comparisons because we had directional hypotheses for three effects. Also, any effects of gender or order, as well as any inter-actions, would not necessarily support our hypotheses. Therefore, we chose a less stringent significance level in order to detect these potential effects. Simple main effects were performed for any significant interactions
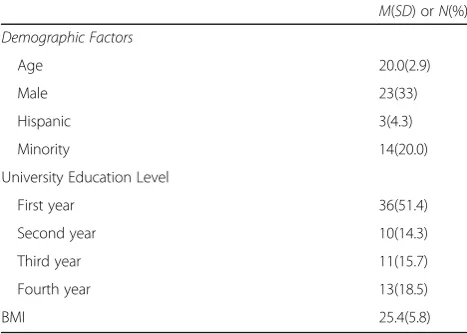
Table 1Characteristics of Participants in Study 1 (N= 70) M(SD) orN(%)
Demographic Factors
Age 20.0(2.9)
Male 23(33)
Hispanic 3(4.3)
Minority 14(20.0)
University Education Level
First year 36(51.4)
Second year 10(14.3)
Third year 11(15.7)
Fourth year 13(18.5)
BMI 25.4(5.8)
Table 2Characteristics of Participants in Study 2 (N= 40) M(SD) orN(%)
Demographic Factors
Age 20.0(2.0)
Male 11(27.5)
Hispanic 2(5.0)
Minority 7(17.5)
University Education Level
First year 9(22.5)
Second year 8(20.0)
Third year 11(27.5)
Fourth year 11(27.5)
Post-baccalaureate 1(2.5)
observed. Sample sizes were chosen a priori and no in-terim analyses were conducted. The results of Study 1 were not known before Study 2 was completed. Results were summarized and presented in figures for concise-ness, but all cell means are presented in the Additional file 1.
Results
Portion sizes in study 1
Results for Study 1 are summarized in Fig. 5. For pro-tein, portion size was significantly greater on the regular plate (M = 93.3 g, SD = 35.3) compared to the portion control plate (M = 62.1 g, SD = 20.6),F (1, 66) = 59.3, p< .0005. No other main effects or interactions were ob-served, p’s > .15. For grains, a three-way interaction of gender, order, and plate type was observed, F (1, 66) = 6.30,p= .02. Simple main effects were performed by conducting analyses separately for the two orders of plate presentation. When the portion control plate was presented first, portion size was larger on the regular plate compared to the portion control plate, F (1,33) = 31.82, p< .0005. When the portion control plate was presented second, main effects of gender (p = .01) and plate type (p< .005) were moderated by an interaction of gender with plate type,F(1, 33) = 4.87,p= .04. Examination of mar-ginal means suggested that men presented with the regu-lar dinner plate first served regu-larger portions of grains (M= 115.9 g,SD= 28.2) than women presented with the regular dinner plate (M = 79.5 g,SD= 39.3), whereas the portion sizes for the portion control plate were more simi-lar between men (M = 58.8 g, SD = 24.1) and women (M= 49.8 g,SD= 22.4).
For vegetables, an interaction of order and plate type was observed,F(1,66) = 4.87,p= .031. When the portion control plate was presented first, participants placed lar-ger portions on the regular plate (M= 164.5 g,SD= 64.3)
than the portion control plate (M = 83.3 g, SD= 29.2), F(1,33) = 7.0, p= .01. When the regular plate was pre-sented first, participants again placed larger portions on the regular plate (M= 138.3 g,SD= 80.1) than the por-tion control plate (M= 98.0 g,SD= 29.0),F(1,33) = 6.9, p = .01. The interaction appears to have been due to a smaller effect when the regular plate was presented first.
Portion sizes in study 2
Results for Study 2 are summarized in Fig. 6. Effects of plate type were observed for protein, F (1, 36) = 6.9, p= .01, vegetablesF(1, 36) = 10.58,p= .002, and grains, F(1, 36) = 14.55, p= .001. For each food, portion sizes were larger for the regular plate compared to the portion control plate. No order effects, gender effects, or interac-tions were observed.
Discussion
The findings of the study indicate that use of a portion control plate resulted in smaller portion sizes for pro-tein, starch, and vegetables. In Study 1, interactions not-withstanding, participants served smaller portions (33% less chicken, 41% less rice, and 16% less peas) on the portion control plate than the regular dinner plate. In Study 2, participants served smaller portions (12% less chicken, 25% less rice, and 16% less peas) on the portion control plate than the regular dinner plate. Instructions based on both MyPlate (e.g., “half vegetables”) and USDA portion sizes (e.g., “one cup vegetables”) yielded similar results.
In previous studies, the differences between smaller and larger plates ranged from 30% larger to 200% larger in the studies included in a recent meta-analysis [13]. In the studies reported here, the area of the portion control plate was 33% smaller than the regular plate. The effect size observed in this literature depends on several
0 20 40 60 80 100 120 140 160 180
Protein Grains Vegetables
grams
Portion Control
Regular
factors, but halving the plate size was suggested to result in roughly a 29% reduction in self-served portions [13], which compares favorably with the reductions in protein and starch we observed.
Portion control dishes used intentionally may yield stronger effects than merely switching from larger to smaller plates, as there are negative reports of the effects of plate size on portion sizes. For example, a recent re-view of the effects of dish size on self-selected portion size argued that the results can be explained by the ef-fects of distraction and the type of food serving dish used [14]. Specifically, studies that used a smaller con-tainer only yielded reduced food consumption when also paired with distraction (e.g., [25–27]). Furthermore, all negative findings used different sizes of plates (e.g., [28]) in contrast to the studies finding an effect which often used bowls or other containers. Moreover, a Cochrane review of tableware size for changing food consumption reported a small to medium effect of tableware size on food selection [5] and argued that reducing portion size could reduce caloric intake by 8.5–13.5%. Our study made no effort to distract participants and provided clear instructions in keeping with our assumption that consumers using portion control dishes intentionally would be trying to achieve smaller portion sizes. Our de-sign also incorporated portion size indicators, which may encourage smaller portions than observed with smaller plates alone.
One unexpected and potentially important finding was that participants consistently underserved vegetables. Al-though peas can spread fairly thinly on the plate, in the first study participants served 36% of the intended serv-ing size of vegetables on the portion control plate com-pared to 60% on the regular plate. Whereas a number of portion control dishes are commercially available, we are unaware of any having been empirically validated with
respect to the serving sizes that users actually achieve. Consumers overestimate the amount of vegetables that they serve themselves [29]. Exacerbating the under-serving of healthy foods like grains and vegetables could be an unintended consequence of portion control dishware, a hypothesis that deserves further study. Re-ducing vegetable consumption would be contrary to best practices for weight control, which emphasize in-creased fruit and vegetable consumption, in part as a strategy to reduce the energy density of food eaten [9]. Although none of the foods in Studies 1 and 2 were particularly energy dense, in Study 1 participants using the portion control plate served themselves 97 fewer kcal on average (405.8 kJ), but only 15 were from vege-tables (peas) whereas 37 were from chicken. It could be argued that reducing portion sizes of vegetables does not serve the public interest of encouraging consumers to meet the daily recommended allowance of fruits and vegetables.
Clinical and research implications
Our findings suggest that portion control dishware may be a useful tool for controlling portion sizes. Future re-search should examine whether portion control dishware can contribute to weight loss. We are aware of only two randomized clinical trials of portion control dishes for weight loss, both of which reported positive results [8, 17]. In contrast, there are studies documenting the success of achieving portion control by using pre-portioned meals and liquid meal replacements [30–32]. Portion control practices are uncommon, but are more likely among women and the health conscious [33]. Por-tion control dishware may also be particularly well suited to interventions with children, who self-select larger por-tions when using adult dishes [25, 34].
0 20 40 60 80 100 120
Protein Grains Vegetables
grams
Portion Control
Regular
Limitations
The sample was comprised entirely college students, and future studies should be conducted with other age ranges (e.g., children and older adults). The participants were not necessarily attempting to lose weight, so results may have differed for participants motivated to choose smaller portions for weight loss. The participants did not consume the food, although recent research suggests that people would typically consume 92% of food they portion onto dishware [35]. Although our design was in-spired by the Delboeuf illusion and Ebbinghaus illusion, we cannot assert that these well-known phenomena ac-count for our findings as we did not collect any data showing that these were the mechanisms for the ob-served effects, nor can we definitively attribute the effects to any design features given that the portion control and comparison plates were different sizes. Finally, we acknow-ledge that the instructions had an effect on portion size and that although they were consistent across plate condi-tions, this study does not answer the question of what would happen if no instructions were provided as would occur in a more naturalistic context (e.g., buffet).
Conclusion
Portion control strategies are commonly recommended [8] and were emphasized in the 2010 and 2015 USDA dietary guidelines [4, 9]. Unfortunately, many persons have difficulty learning the healthy portion sizes for dif-ferent foods and consistently consuming those amounts [10]. Accordingly, the need for tools to enhance portion control is clear and has inspired investigations of the in-fluence of serving dishes and plates design on portion size and food consumption. Portion control plates have the potential to reduce self-selected portion sizes, but may also result in smaller portions of vegetables than are recommended. Future research should include add-itional design work, validation of portion control dishes, studies in a broader range of ages, and clinical trials of portion control dishes for weight loss.
Additional file
Additional file 1: Table S1.Protein weight (g) by plate type, gender, and order for Study 1.Table S2. Grains weight (g) by plate type, gender, and order for Study 1.Table S3. Vegetables weight (g) by plate type, gender, and order for Study 1.Table S4. Protein weight (g) by plate type, gender, and order for Study 2.Table S5. Grains weight (g) by plate type, gender, and order for Study 2.Table S6. Vegetables weight (g) by plate type, gender, and order for Study 2. (DOCX 37 kb)
Acknowledgements
This research was supported by Kent State University’s Applied Psychology Center, Graduate Student Senate, and Judie Fall Lasser Graduate Psychology Research Award, and T32 5T32HL076134-10. These studies were inspired in part by the work of Dr. Brian Wansink as reported inMindless Eating[36].The authors wish to acknowledge our research assistants and participants for contributing to these studies.
Funding
This research was supported by Kent State University’s Applied Psychology Center, Graduate Student Senate, and Judie Fall Lasser Graduate Psychology Research Award, and T32 5T32HL076134–10. No funding source had any influence on the design, conduct, interpretation, or reporting of the study.
Availability of data and materials
The dataset analyzed for this study is available from the corresponding author on reasonable request (e.g., ethics approval).
Authors’contributions
JWH designed the portion control plate, conceptualized the study, analyzed the data, and wrote the manuscript, CMG helped conceptualize the study, supervised the conduct of the study, and contributed to the manuscript, CL helped supervise the conduct of the study and contributed to the manuscript. JLM helped conduct the study, analyzed the data, and contributed to the manuscript. MAWH helped conceptualize the study and contributed to the manuscript. AS consulted on methodology for laboratory eating behavior studies and contributed to the manuscript. JG designed the portion control plate, helped conceptualize the study, and contributed to the manuscript. All authors read and approved the final manuscript.
Ethics approval and consent to participate
All procedures were reviewed and approved by the Institutional Review Board of Kent State University. All participants provided written informed consent.
Consent for publication
No personally identifiable information is presented; not applicable.
Competing interests
Drs. Gunstad and Hughes hold Patent (Docket No.: KENT-AC-DES (KSU.401). PORTION CONTROL PLATE. Filed May, 2012. Drs. Hughes and Gunstad were not present during data collection and made all data available to Drs. Goldstein and Hawkins, who also take full responsibility for the accuracy of data analyses in this manuscript. The plate described in the Materials section is not commercially available at this time. The remaining authors declare that they have no competing interests.
Publisher’s Note
Springer Nature remains neutral with regard to jurisdictional claims in published maps and institutional affiliations.
Author details
1
Department of Psychological Sciences, Kent State University, P.O. Box 5190, Kent, Ohio 44242, USA.2Department of Psychiatry and Human Behavior,
Brown University, Providence, Rhode Island, USA.3Department of Psychology, University of Florida, Gainesville, Florida, USA.4Department of
Psychology, Oklahoma State University, Stillwater, Oklahoma, USA.
Received: 11 October 2016 Accepted: 18 July 2017
Reference
1. Must A, Spadano J, Coakley EH, et al. The disease burden associated with overweight and obesity. JAMA. 1999;282:1523–9.
2. Flegal KM, Carroll MD, Kit BK, et al. Prevalence of obesity and trends in the distribution of body mass index among US adults, 1999-2010. JAMA. 2012;307:491–7.
3. van Vliet-Ostaptchouk JV, Nuotio M-L, Slagter SN, et al. The prevalence of metabolic syndrome and metabolically healthy obesity in Europe:
a collaborative analysis of ten large cohort studies. BMC Endocr Disord. 2014;14:1. 4. Ng M, Fleming T, Robinson M, et al. Global, regional, and national prevalence
of overweight and obesity in children and adults during 1980–2013: a systematic analysis for the global burden of disease study 2013. Lancet. 2014;384:766–81.
5. Hollands GJ, Shemilt I, Marteau TM, Jebb SA, Lewis HB, Wei Y, Higgins J, Ogilvie D. Portion, package or tableware size for changing selection and consumption of food, alcohol and tobacco. Cochrane Database Syst Rev. 2015;9: CD011045. doi:10.1002/14651858.CD011045.pub2.
7. Young LR, Nestle M. The contribution of expanding portion sizes to the US obesity epidemic. American J Pub Health. 2002;92:246–9.
8. Kesman RL, Ebbert JO, Harris KI, et al. Portion control for the treatment of obesity in the primary care setting. BMC Res Notes. 2011;4:346. 9. Committee DGA. Scientific report of the 2015 dietary guidelines advisory
committee. Washington: USDA and US Department of Health and Human Services; 2015.
10. Chandon P, Wansink B. Is obesity caused by calorie underestimation? A psychophysical model of meal size estimation. J Marketing Res. 2007;44:84–99. 11. Van Ittersum K, Wansink B. Plate size and color suggestibility: the Delboeuf
Illusion’s bias on serving and eating behavior. J Con Res. 2012;39:215–28. 12. Wansink B, van Ittersum K. Portion size me: plate-size induced consumption
norms and win-win solutions for reducing food intake and waste. J Experiment Psychol: Appl. 2013;19:320.
13. Holden SS, Zlatevska N, Dubelaar C. Whether smaller plates reduce consumption depends on who’s serving and who’s looking: a meta-analysis. J Assoc Consum Res. 2016;1(1):134–46.
14. Libotte E, Siegrist M, Bucher T. The influence of plate size on meal composition. Literature review and experiment. Appetite. 2014;82:91–6. 15. Robinson E, Nolan S, Tudur-Smith C, et al. Will smaller plates lead to smaller
waists? A systematic review and meta-analysis of the effect that experimental manipulation of dishware size has on energy consumption. Obes Rev. 2014;15:812–21.
16. The Diet Plate G, England http://www.thedietplate.com. Accessed 24 July 2017. 17. Pedersen SD, Kang J, Kline GA. Portion control plate for weight loss in
obese patients with type 2 diabetes mellitus: a controlled clinical trial. Arch Inter Med. 2007;167:1277–83.
18. Gentaz E, Hatwell Y. Geometrical haptic illusions: the role of exploration in the Müller-Lyer, vertical-horizontal, and Delboeuf illusions. Psych Bull Rev. 2004;11:31–40.
19. Massaro DW, Anderson NH. Judgmental model of the Ebbinghaus illusion. J Experiment Psychol. 1971;89:147.
20. Amazon. www.amazon.com. Accessed 24 July 2017.
21. China C. http://www.cacchinausa.com/cac/. Accessed 24 July 2017. 22. MyPlate. http://www.choosemyplate.gov/. Accessed 24 July 2017. 23. DepartmentofAgriculture U (2011) ChooseMyPlate. Gov.
24. Meyer TJ, Miller ML, Metzger RL, et al. Development and validation of the penn state worry questionnaire. Behav Res Ther. 1990;28:487–95. 25. DiSantis KI, Birch LL, Davey A, et al. Plate size and children’s appetite:
effects of larger dishware on self-served portions and intake. Pediatrics. 2013;131:e1451–e8.
26. Van Kleef E, Shimizu M, Wansink B. Serving bowl selection biases the amount of food served. J Nutr Educ Behav. 2012;44:66–70.
27. Wansink B, Kim J. Bad popcorn in big buckets: portion size can influence intake as much as taste. J Nutr Educ Behav. 2005;37:242–5.
28. Penaforte F, Japur C, Diez-Garcia R, et al. Plate size does not affect perception of food portion size. J Hum Nutr Diet. 2014;27:214–9. 29. Nørnberg TR, Houlby L, Jørgensen LN, et al. Do we know how much we
put on the plate? Assessment of the accuracy of self-estimated versus weighed vegetables and whole grain portions using an intelligent buffet at the FoodScape lab. Appetite. 2014;81:162–7.
30. Hannum SM, Carson L, Evans EM, et al. Use of portion-controlled entrees enhances weight loss in women. Obes Res. 2004;12:538–46.
31. Heymsfield S, Van Mierlo C, Van der Knaap H, et al. Weight management using a meal replacement strategy: meta and pooling analysis from six studies. Int J Obes. 2003;27:537–49.
32. Heymsfield SB. Meal replacements and energy balance. Physiol Behav. 2010;100:90–4.
33. Spence M, Lähteenmäki L, Stefan V, et al. Quantifying consumer portion control practices. A cross-sectional study. Appetite. 2015;92:240–6. 34. Robinson TN, Matheson DM. Environmental strategies for portion control in
children. Appetite. 2015;88:33–8.
35. Wansink B, Johnson KA. The clean plate club: about 92% of self-served food is eaten. Int J Obes. 2015;39:371–4.
36. Wansink B. Mindless eating: why we eat more than we think. New York: Bantam Publishing; 2007.
• We accept pre-submission inquiries
• Our selector tool helps you to find the most relevant journal
• We provide round the clock customer support
• Convenient online submission
• Thorough peer review
• Inclusion in PubMed and all major indexing services
• Maximum visibility for your research
Submit your manuscript at www.biomedcentral.com/submit