* Corresponding author.
E-mail address: [email protected]
DOI: 10.9781/ijimai.2017.07.002
I. Introduction
T
echnology revolution within the last decades makes the use of smart phones, phablets, tablets, computers in every instance of our daily and business lives. Finance sector and banks are also highly affected from this revolution and they adapt their systems to these new trends. More retail customers use digital banking channels with different layers of digital security and approvals result in nearly human free operation. On the other hand, commercial customers’ behavior still tends to use bank branches for money transfer transactions due to the nature of their organizational structures.A customer could fax an instruction including money transfer transactions and authorized signature to the bank branch. This service is accepted as the customer to be situated in branch physically and promised to be commited in 90 minutes (SLA – Service Level Agreement). These instructions mostly consist of large count of transaction orders and also with money amounts much greater than the electronic transfer limits. Branch employees validate the signature on instruction, scan and then deliver it to the operation center. That’s the way how branch employees spend much more time for customer relationships.
Daily operation deals with this NP Type problem of planning the turnover and shifts according to banks standard operation procedures by forecasting the expected workload. Thus, proper workforce planning decreases the labor force costs whereas service quality and customer satisfaction increases. Call Centers and Operation Centers are the most
common fields of this kind of businesses [1].
Banks aim to reduce the operational workload of branches through operation centers. Expert employees are appointed in operation centers to serve faster, more accurate and high quality service. Operation center employees digitalize the hard copy money transfer instruction and commit the transaction. Delivering operational transactions centrally provides service quality enhancement, improves customer satisfaction and saves serious amount of labor force.
Currently, operation center managers usually predict the workload and assign the workforce manually depending on their previous experience of the team and operation leaders. Mostly, they reschedule and change their plans at the moment the workload density is observed. This type of delayed planning results in non-optimized working environment which should be avoided. Considering the hundreds of average employee numbers in operational and call centers this optimization cannot be ignored.
Workforce optimization problem in bank operation centers is pretty similar to Call Center studies. Transaction volumes of the both business fields have dramatically changed [2]. Related work by authors already mentions predictability of transaction counts [3]. Moreover, formulas for inbound transaction volume are generalized by extracting time based attributes of historical data in recent works [4][5]. Similarly, some other studies including smoothing methods would be adapted to the problem [6]. Also, these business fields have high turnover and shift rates of labour force [7]. Herein, skill based approaches exist to allocate optimized labour force [8][9].
This paper introduces an approach to plan workforce in bank operation centers based on forecasting workload with a machine learning algorithm and analyzes the workforce optimization on production data. Also, a generic workload forecasting system is
Keywords
Artificial Neural Networks, Forecasting, Machine Learning, Predictive Models, Time Series Analysis.
Abstract
Online Banking Systems evolved and improved in recent years with the use of mobile and online technologies, performing money transfer transactions on these channels can be done without delay and human interaction, however commercial customers still tend to transfer money on bank branches due to several concerns. Bank Operation Centers serve to reduce the operational workload of branches. Centralized management also offers personalized service by appointed expert employees in these centers. Inherently, workload volume of money transfer transactions changes dramatically in hours. Therefore, workforce should be planned instantly or early to save labor force and increase operational efficiency. This paper introduces a hybrid multi stage approach for workforce planning in bank operation centers by the application of supervised and unsupervised learning algorithms. Expected workload would be predicted as supervised learning whereas employees are clustered into different skill groups as unsupervised learning to match transactions and proper employees. Finally, workforce optimization is analyzed for proposed approach on production data.
Workforce Optimization for Bank Operation Centers:
A Machine Learning Approach
Sefik Ilkin Serengil
1*, Alper Ozpinar
21
Research and Development Center, SoftTech A.S., Istanbul (Turkey)
2
Mechatronics Engineering Department, Istanbul Ticaret Universitesi, Istanbul (Turkey)
developed to involve different transaction types or business fields. The worked on data obtained from Isbank’s operation center date between 2012, Jan 01 – Present. The historical data includes transaction date time and transaction volume information.
II. Background
Human based experience and intelligence can be replaced by artificial intelligence and expert systems in many areas with the improvements and findings in these areas within the last decades [10] [11]. A special area of artificial intelligence which is mostly based on statistics is the machine learning. This discipline is strong about modelling NP type problems.
In machine learning problems, a mathematical function is modeled by given historical data examples and the obtained learned function forecasts the outputs of future examples without known outputs. The function is derived from the affecting factors of the problem that would be predicted. Determining affecting factors specifies the complexity of function and this is the key factor of model success. If the function is not complex enough to cover the state space of the problem, there would be underfitting problem. This means that the function would not even successfully forecast for the given historical examples. Function should be re-modeled again as to become more complex for this case. In contrast, there would be overfitting problem if the function is too complex. This means that function would forecast successfully for given historical examples but could not predict successfully for unknown examples with large computational and time complexity.
For the case of machine learning adaptation and usage for the expert system of the bank operational centers, there are several factors affecting on transaction count that have already been discovered. Firstly, by the nature of business operations, day of week is one of the most important factors affecting transaction count as demonstrated (see Fig. 1). Transaction count peaks up on Friday and Monday due to the weekends. Moreover, if the public holidays shift the first or last work day of week, transaction counts of the following days are affected dramatically. That’s why; Boolean first or last work day parameter should be additionally included in input layer. Furthermore, half work days shift every year because of the hijri calendar. That’s why; Boolean half day parameter is added in input.
Secondly, Morning hours have low transaction volume whereas dinner hours bottom out. There is an obviously seen trend on evening hours where transaction count peaking up as illustrated (see Fig. 1). Furthermore, transaction counts show a change depending on month of year as shown in Fig. 2. Also, day of month causes to change in transaction count. Generally, customers tend to transfer money on beginning, ending and the middle of the month as shown in Fig. 2.
Fig. 1 Weekday and Work Hour Effect.
Fig. 2 Month of Year and Day of Month Effect.
Thirdly, yearly deviation is thought to be useful as input to catch the trend. Deviation is calculated by the difference between current and previous year’s average transaction count for 10 days period. Finally, transaction count of the previous hours should be included in the input to retrieve future values in time series problems. Thus, transaction counts of previous three hours (h-1, h-2, and h-3) are included into the network. Finally, the model is based on aiming to retrieve transaction count of hour h. Thus, the output of the network should be transaction count (h).
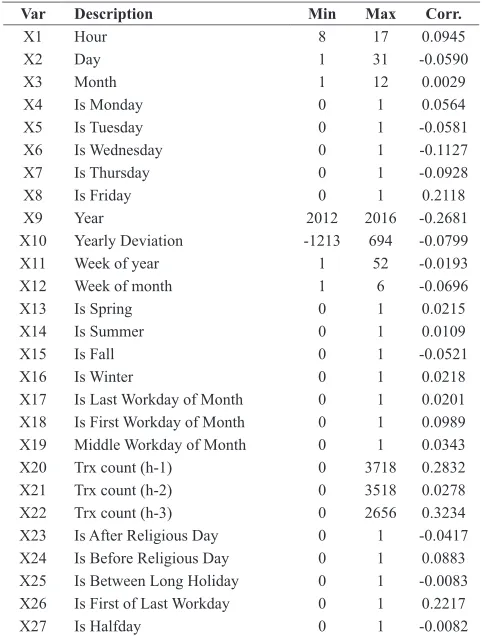
TABLE I.
Correlative Variables for Money Transfer Transactions
Var Description Min Max Corr.
X1 Hour 8 17 0.0945
X2 Day 1 31 -0.0590
X3 Month 1 12 0.0029
X4 Is Monday 0 1 0.0564
X5 Is Tuesday 0 1 -0.0581
X6 Is Wednesday 0 1 -0.1127
X7 Is Thursday 0 1 -0.0928
X8 Is Friday 0 1 0.2118
X9 Year 2012 2016 -0.2681
X10 Yearly Deviation -1213 694 -0.0799
X11 Week of year 1 52 -0.0193
X12 Week of month 1 6 -0.0696
X13 Is Spring 0 1 0.0215
X14 Is Summer 0 1 0.0109
X15 Is Fall 0 1 -0.0521
X16 Is Winter 0 1 0.0218
X17 Is Last Workday of Month 0 1 0.0201
X18 Is First Workday of Month 0 1 0.0989
X19 Middle Workday of Month 0 1 0.0343
X20 Trx count (h-1) 0 3718 0.2832
X21 Trx count (h-2) 0 3518 0.0278
X22 Trx count (h-3) 0 2656 0.3234
X23 Is After Religious Day 0 1 -0.0417
X24 Is Before Religious Day 0 1 0.0883
X25 Is Between Long Holiday 0 1 -0.0083
X26 Is First of Last Workday 0 1 0.2217
X27 Is Halfday 0 1 -0.0082
The variables in TABLE I are thought to affect money transfer transaction counts. Minimum, maximum and correlation coefficient values are computed for Electronic Fund Transfer (EFT) transactions. Correlation indicates the strength of relationship between two variables. It ranges from -1 to +1. Coefficient closes -1 or +1 for strongly related datasets. Sign of the coefficient states the direction of relation. Neutral means no relationship between datasets. None of the correlation coefficient of variable closes to ±1. This means there is no directly relation between these variables and transaction count.
III. Motivation
Fig. 3 Basic Neural Network Cell.
(1)
(2)
A complex neural network system consists of multiple neuron cells. It provides a satisfactory way to forecast and predict. Designing input - output parameters and modeling neural network are dramatically important to have successful results.
The challenge in this study is predicting transaction volumes. In other words, it is a regression problem. Neural networks can be applied on both regression and classification studies. On the other hand, linear regression can be applied for regression studies but this algorithm is not convenient for non-linear time series. What’s more, some statistical methods can be applied on non-linear time series such as exponential smoothing methods but these models are based on discovering trends and seasonal effects on data set. What if some activities might repeat irregularly (e.g. random day in a week) but these activities may have high effect on result such as sport activities or religious days. In this case, statistical approach might fail whereas neural networks can be successful if event days are defined in input parameters. That’s why, neural networks and exponential smoothing methods are applied on the problem in this study.
Network design plays a pivotal role to have successful results. Three layered network is modeled with node numbers 27, 18, 1. Firstly, nodes in input layer correspond to the variables illustrated in Table I. Secondly, the number of hidden neurons should be 2/3 the size of the input layer, plus the size of the output layer as Heaton declared [12]. That’s why, there are 18 nodes in hidden layer. Thirdly hidden nodes are connected with an output layer. Finally, output node calculates expected transaction count.
Additionally, sigmoid function is selected as activation function and back propagation algorithm and stockastic gradient descent is applied to implement learning. Furthermore, some configuration parameters of the network model is mentioned in the Table II. So, neural network models is built in 260 seconds for following parameters and historical data consisting of 7K instances. Network is built on a machine with following capabilities: Core i7 CPU, 16 GB RAM and 64 bit OS.
TABLE II.
Configuration Parameters of The Neural Network Model
Configuration Parameter Value
Learning rate 0.01
Momentum 0.1
Epoch 5000
IV. Forecasting Results
Neural network model is trained with 7151 instances date between [2013-01-14, 2016-08-22] whereas model is evaluated for 801 production instances on runtime date between [08-23, 2016-12-31]. In other words, the following results show how the built
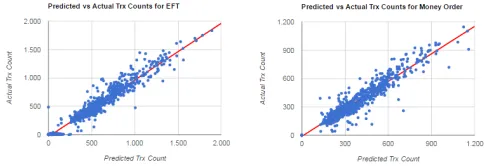
model works on production on a bank. Performance of the network is demonstrated in Table III. Moreover, prediction and actual values are demonstrated in Fig. 4 for a day and Fig. 5 for overall. Also, the same historical data set is modeled with triple, double and single exponential smoothing methods and the model success is compared. It seems the neural network model forecasts much more successful than the others. Mean Absolute Error and Correlation metrics are calculated to evaluate the performance of the system.
Suppose that p is the prediction set and a is the actual set. Performance of the system would be calculated by formulas (3) and (4).
(3)
(4)
Fig. 4 NN Prediction Result on a day (2015-12-04).
TABLE III
Performance of the Prediction Models
Trx Metric NN TES DES SES
EFT
MAE 71.05 283.69 290.09 294.14
MAE/Mean (%) 14.27 56.97 58.26 59.07
Correlation (%) 97.02 30.08 -1.16 12.43
Mean 497.91
Instances(hour) 801
Money Order
MAE 48.80 161.34 161.42 156.05
MAE/Mean (%) 13.71 48.01 48.04 46.44
Correlation (%) 95.70 18.46 4.48 26.80
Mean 336.00
Instances(hour) 801
To sum up, forecast and actual sets have 97.02% correlation for EFT and 95.70% correlation for Money Order transactions. Moreover, the neural network model would forecast with distance ±71.05 and ±48.80, and also MAE / Mean ratios are 14.27% for EFT and 13.71% for Money Order respectively on a dataset consisting of 801 instances. In contrast, triple, double and single exponential smoothing methods cannot get close to the neural networks results as seen in Table III.
Fig. 5 NN Results between [2016-08-23, 2016-12-31].
V. Unsupervised Learning
learning algorithms create a generalized function from historical data and this function predicts the class labels for unknown examples. In this case, predicted classes could be compared with actual classes and the success performance of the function could be calculated. In contrast, there are not class labels for dataset in unsupervised learning. In this case, dataset could be grouped into different clusters. Newly examples are assumed to be members of these created clusters. However, function performance could not be calculated for unsupervised learning problems. There are commonly known algorithms such as k-means or c-means to implement unsupervised learning.
Satisfactory results are retrieved with neural networks as shown is previous section. The requirement is matching expected work with the correct employees to optimize the problem.
Employees should be evaluated by their skills and the individual performance should be considered while distributing work to have more sensitive results. In this section, employee skills are examined by unit performing time of a work and the average count of completed works by itself on an hour period. Two different approaches are proposed for workforce planning. Firstly, aggressive mode is proposed to handle high transaction volumes to reduce the queue immediately. Secondly, moderate mode is proposed to encourage personal development. Applying aggressive or moderate modes should be decided by expected transaction volumes.
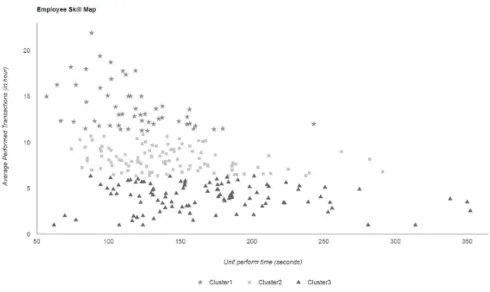
Fig. 6 is retrieved when the employee skills are analyzed between 06/27/14 - 08/27/14 for 265 employees. Every node represents an employee and every shape (star, square and triangle) stands for different skill groups. Unsupervised k-means algorithm is applied to cluster employees. Simply, employees are clustered into three different sets depending on their skills. Star shaped employees (Cluster 1) seem to be in the highest performance work group. They complete large number of work in a short time period.
In aggressive mode, distributing work should begin with employees in cluster 1; continue with square shaped employees (Cluster 2), triangle shaped employees (Cluster 3) respectively. Suppose that employee array is ordered by cluster priority, sorted with respect to the unit count column from greatest to smallest and also sorted with respect to the unit perform time column in seconds from smallest to greatest respectively. Proposed employee assignment process is illustrated in Fig. 7 as pseudo code. PN is expected transaction count in next hour; PQ is waiting transaction count on queue from previous hours. The algorithm basically proposes to start with reserving the most powerful employee and repeat it until expected work handled. If the expected work could not be handled with all employees, then exit iteration.
Fig. 6 Employee Skill Map.
int workforce = 0, i = 0, break = 0
while(workforce < (PN + PQ) AND break = 0) if(i < total_number_of_employees)
if(isAvailable(Employee[i]))
workforce += Employee[i].UnitCompletedWork Reserve(Employee[i])
end if i = i+1 end if else
break = 1 end else end while
Fig. 7 Pseudo code of Employee Assignment for Aggressive Mode.
TABLE IV. Workforce Clusters
Cluster Employees Avg Commited Trx
Cluster 1 (star) 53 15.00
Cluster 2 (square) 106 9.00
Cluster 3 (triangle) 106 5.00
Needed workforce should be computed by average completed work count of each employee instead of unit perform time. In this way, delays between works would not be ignored. This approach guarantees to reduce the queue immediately. However, talented employees would handle more transactions in this approach. Alternatively, fairer moderate mode is proposed for workforce planning.
In moderate mode, employees are group into different teams as demonstrated in Table IV. Cluster 1 consists of 53 employees, and Cluster 2 and Cluster 3 both consist of 106 employees. Each team would consist of a Cluster 1 member, two Cluster 2 members and Cluster 3 members. In this way, there would be 53 different and equal talented teams and each team consists of 5 members. Moreover, Cluster 1 employees complete almost 15 transactions per hour whereas Cluster 2 and Cluster 3 members complete 9 and 5 transactions respectively. In other words, each team could handle averagely 43 transactions per hour. Furthermore, SLA time is 90 minutes for money transfer transactions. In other words, 2/3 the size of expected work should be completed for each hour. Besides, assigned teams should be membered 2 / (3x43) the size of expected transaction count and each transaction should be assigned to a team randomly. A generalized algorithm for moderate type distribution is illustrated in Fig. 8. This approach is seemed to be fairer to aggressive mode and it also encourages the personal development. However, it does not guarantee to reduce the queue immediately. This approach should be applied on low transaction volume.
VI. Workforce Optimization
sub create_teams() //clustering employees into 3 classes
cluster1[int(num_of_employees/5)] cluster2[2*int(num_of_employees/5)] cluster3[2*int(num_of_employees/5)]
//employee array is sorted by their skills from greatest to smallest
for i=1 to num_of_employees if i <= cluster1.length
cluster1[i] = employee[i]
else if i <= (cluster1.length + cluster2.length) cluster2[i-cluster1.length] = employee[i] else
cluster3[i - cluster1.length - cluster2.length] = employee[i] end for
team[cluster1.length] //creating teams
for i=1 to cluster1.length
index1stMember = random (1, cluster1.lenght +1 - i) team[i].add(cluster1[index1stMember]);
cluster1.remove(index1stMember); for j=1 to 2
index2ndMember = random (1, cluster2.lenght +j - i) team[i].add(cluster2[index2ndMember]); cluster2.remove(index2ndMember); end for
for j=1 to 2
index3rdMember = random (1, cluster3.lenght +j - i) team[i].add(cluster3[index3rdMember]);
cluster3.remove(index3rdMember); end for
end for end sub
sub reserve_teams
threshold = 43 //a team could handle in a hour
reserved = (60/SLA) * expected_work / threshold reserved_team[reserved] //new reserved team array
for i = 1 to reserved
temp_team = random(1, team.length
reserved_team[i] = team[random (1, temp_team)] team.remove(temp_team)
end for end sub
sub assign_work
for i=1 to queuedWork.length
team[random (1, team.length)].assign(queuedWork[i]) end for
end sub
Fig. 8 Pseudo Code of Employee Reservation for Moderate Mode.
Fig. 9 describes the overall optimization on system for aggressive mode and for moderate mode. The blue lines state the moments proposed operator count less than the reserved operator count, and the red lines express the moments proposed operator count larger than reserved operator count. X-axis corresponds to the work hour instances, and Y-axis corresponds to the workforce optimization for work hour. Also, workforce optimization is calculated by formula (5).
(5)
Fig. 9 Workforce Optimization (x-axis: instance, y-axis: optimization percentage).
To sum up, planning workforce with less number of employees is possible to handle the more workload as shown in Table V.
TABLE V.
Workforce Optimization Results
Metric Aggressive Mode Moderate Mode
Reduced Employees 3422 4318
Instance (hour) 197 197
Total employees 265 265
Optimization
(Employee/hour) 17.37 21.91
Optimization (%) 6.55% 8.27%
SLA (minutes) 60 90
VII. System Architecture
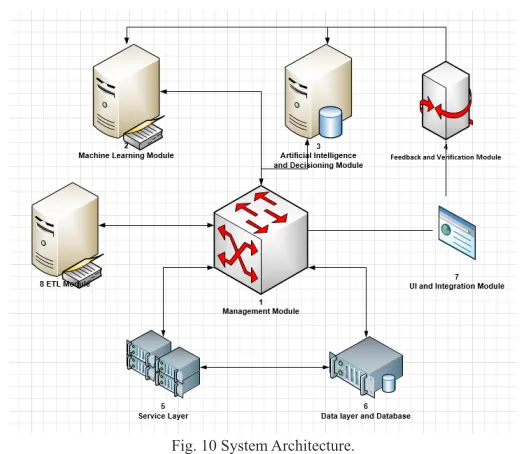
The proposed hybrid multilevel expert system is designed as illustrated in Fig. 10. Firstly, historical data should be regularly retrieved and stored. This operation is handled by ETL module. Secondly, machine learning algorithm is run by machine learning module. Training network and predicting is applied on this module. ETL module also provides to be run machine learning module with current data. Thirdly, AI module is responsible for reserving and assigning required workforce based on employee skills and expected workload calculated by ML module. Also, applying moderate or aggressive mode is decided on AI module, too. Then, feedback module validates how correct machine learning module predicts. Thus, network can be retrained if validation fails. After then, these operations are implemented on service oriented architecture and service layer communicates with data layer to collect and store data.
Fig. 10 System Architecture.
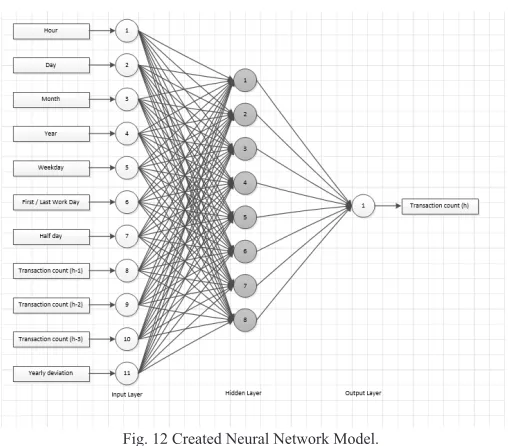
new business processes or transaction types would be modeled easily in the expert system. Common time based attributes (e.g. weekday, transaction hour) are defined strictly whereas custom exceptional days (e.g. holiday for USD region, religious day) could be defined and involved in neural network model as seen in Fig. 11. At this point, some parameters help to handle time series problems such as has previous hours as input whereas correlative depth parameter indicates how many previous hour would be included in network as input.
Fig. 11 Dynamic Network Definition.
Fig. 12 Created Neural Network Model.
Dynamically defined network parameters create a custom neural network model. Thus a generic solution would be provided as seen in Fig. 12. Finally, neural network learning is applied by the pseudo code as illustrated in Fig. 13.
For i=0 to trxs.length //e.g. trxs[0] = EFT, trxs[1] = Money Order For k=0 to trxs[i].retrieveHistoricalData.length
For j=0 to trxs[i].retrieveParams.length
//Retrieve selected parameters on dynamic network definition //Suppose that Hour, Day and Month Params are picked up. trxs[i].attributes[k][j]
=Extract(trxs[i].retrieveHistoricalData[k].getTrxDate() , trxs[i].retrieveParams[j])
End for
trxs[i].attributes[k][j+1]
= retrieveHistoricalData[k].getTrxCount() //append transaction count
End for
/*Then EFT’s attributes (trxs[0].attributes) are illustrated below 11, 30, 12, 1315
10, 30, 12, 968 9, 30,12, 593 */
applyNeuralNetworkLearning(trxs[i].attributes) End for
Sub Extract() ...
/* This method extracts custom parameter from transaction date. E.g. Extract(2016-12-30 11:00, Hour) returns 11, Extract(2016-12-30 11:00, Day) returns 30 and Extract(2016-12-30 11:00, Month) returns 12 */
End sub
Sub retrieveHistoricalData() ...
/* This method returns all historical data including transaction date and transaction count for a transaction type. Suppose that the following instances are historical data of EFT
2016-12-30 11:00, 1315 2016-12-30 10:00, 968 2016-12-30 09:00, 593 */ End sub
Fig. 13 Pseudo Code of Neural Network Training.
VIII. Conclusion
In this paper, a hybrid multi-level machine learning based expert system approach is introduced to plan workforce management for bank operation centers based on applying supervised and unsupervised machine learning algorithms for forecasting workload and clustering workforce. Chosen supervised machine learning algorithm, neural network, is compared with alternative exponential smoothing algorithms to evaluate how successful results are. Furthermore, workforce optimization is analyzed on production data. Satisfactory results are obtained for both workload forecasting and workforce optimization.
Although, this paper mainly focuses on forecasting transaction volumes of money transfer transactions, a generic architecture is developed to workload forecasting. Thus, newly transaction types or business fields should be easily involved in workload forecasting lifecycle. A similar approach is thought to be adopted in turnover and shift requiring work areas such as Call Centers.
Acknowledgments
Directorate of The Scientific and Technological Research Council of Turkey) in scope of Industrial Research and Development Projects Grant Program (1501) under the project number 3150070.
The authors would like to thank Isbank Enterprise Architecture Division and Banking Operations Division for their help and support.
References
[1] Z. Aksin, M. Armony and V. Mehrotra, «The modern call center: A multi‐ disciplinary perspective on operations management research,» Production and Operations Management, vol. 16, no. 6, pp. 665-688, 2007. [2] L. Brown, N. Gans, A. Mandelbaum, A. Sakov and H. Shen, «Statistical
analysis of a telephone call center: A queueing-science perspective,» Journal of the American statistical association, vol. 100, no. 469, pp. 36-50, 2005.
[3] S. I. Serengil and A. Ozpinar, «Planning Workforce Management for Bank Operation Centers with Neural Networks,» in Proceedings of 15th WSEAS International Conference on Artificial Intelligence, Knowledge Engineering and Databases, Venice, Italy, 2016.
[4] D. Barrow and N. Kourentzes, «The impact of special days in call arrivals forecasting: a neural network approach to modelling special days,» European Journal of Operational Research, 2016.
[5] F. M. Bianchi, S. Scardapane, A. Uncini and A. Rizzi, «Prediction of telephone calls load using Echo State Network with exogenous variables,» Neural Networks, vol. 71, pp. 204-213, 2015.
[6] C.-C. Lin, C.-L. Lin and J. Z. Shyu, «Hybrid multi-model forecasting system: A case study on display market,» Knowledge-Based Systems, vol. 71, pp. 279-289, 2014.
[7] T. L. Tuten and P. E. Neidermeyer, «Performance, satisfaction and turnover in call centers: The effects of stress and optimism,» Journal of Business Research, vol. 57, no. 1, pp. 26-34, 2004.
[8] B. Legros, O. Jouini and Y. Dallery, «A flexible architecture for call centers with skill-based routing,» International Journal of Production Economics, vol. 159, pp. 192-207, 2015.
[9] M. A. Valle, S. Varas and G. A. Ruz, «Job performance prediction in a call center using a naive Bayes classifier,» Expert Systems with Applications, vol. 39, no. 11, pp. 9939-9945, 2012.
[10] C. Pruenza, M. Teulón, L. Lechuga, J. Díaz and A. González, «Development of a Predictive Model for Induction,» International Journal of Interactive Multimedia and Artificial Intelligence, vol. In Press, 2017.
[11] S. Bhattacharya and S. Nath, «Intelligent e-Learning Systems: An Educational,» International Journal of Interactive Multimedia and Artificial Intelligence, vol. In Press, 2017.
[12] J. Heaton, Introduction to Neural Networks for Java, Heaton Research, 2000.
Sefik Ilkin Serengil
Sefik Ilkin Serengil received the MSc degree in computer engineering from Galatasaray University, Istanbul, Turkey, in 2011. He has been working as a Software Developer for SoftTech A.S. since 2010. His current research interests are Machine Learning and Cryptography.
Alper Ozpinar