Do Staphylococcus epidermidis genetic clusters predict isolation sources? 1
2
Isaiah Tolo1, Jonathan C. Thomas2, Rebecca S.B. Fischer3, Eric L. Brown3, Barry M.
3
Gray4, D. Ashley Robinson1#
4 5
1 Department of Microbiology and Immunology, University of Mississippi Medical
6
Center, Jackson, MS, USA 7
2 Department of Biology, University of Bolton, Bolton, UK
8
3 Center for Infectious Disease, University of Texas Health Science Center, Houston, TX,
9
USA 10
4 Department of Pediatrics, University of Illinois College of Medicine at Peoria, Peoria,
11
IL, USA 12
13
#Corresponding author. 14
Mailing address: University of Mississippi Medical Center, 2500 North State Street, 15
Jackson, MS, USA 39216 16
Email: [email protected]
17
Office phone: 601-984-1702 18
Lab phone: 601-984-1703 19
Fax: 601-984-1708 20
21
Running title: Predicting S. epidermidis isolation sources
22
JCM Accepted Manuscript Posted Online 13 April 2016 J. Clin. Microbiol. doi:10.1128/JCM.03345-15
Copyright © 2016, American Society for Microbiology. All Rights Reserved.
on October 26, 2016 by guest
http://jcm.asm.org/
ABSTRACT 23
Staphylococcus epidermidis is a ubiquitous colonizer of human skin and a common cause
24
of medical device-associated infections. The extent to which the population genetic 25
structure of S. epidermidis distinguishes commensal from pathogenic isolates is unclear.
26
Previously, Bayesian clustering of 437 multilocus sequence types (STs) in the 27
international database revealed a population structure of six genetic clusters (GCs) that 28
may reflect the species' ecology. Here, we first verified the presence of six GCs, 29
including two (GC3, GC5) with significant admixture, in an updated database of 578 STs. 30
Next, a single nucleotide polymorphism (SNP) assay was developed that accurately 31
assigned 545 of 578 (94%) STs to GCs. Finally, the hypothesis that GCs could 32
distinguish isolation sources was tested by SNP typing and GC assignment of 154 33
isolates from hospital patients with bacteremia, those with blood culture contaminants, 34
and from non-hospital carriage. GC5 was isolated almost exclusively from hospital 35
sources. GC1 and GC6 were isolated from all sources, but were overrepresented from 36
non-hospital and infection sources, respectively. GC2, GC3, and GC4 were relatively rare 37
in this collection. No association was detected between fdh-positive isolates (GC2, GC4)
38
and non-hospital source. Using a machine learning algorithm, GCs predicted hospital and 39
non-hospital sources with 80% accuracy and predicted infection and contaminant sources 40
with 45% accuracy, which was comparable to a combination of five genetic markers 41
(icaA, IS256, sesD/bhp, mecA, ACME). Thus, analysis of population structure with
42
subgenomic data shows the distinction of hospital and non-hospital sources and the near 43
inseparability of sources within a hospital. 44
on October 26, 2016 by guest
http://jcm.asm.org/
INTRODUCTION 45
Staphylococcus epidermidis is a commensal of human skin and a common contaminant of
46
clinical specimens, but it is also an important human pathogen (1, 2). Currently, the 47
coagulase-negative staphylococci (CoNS), of which S. epidermidis is the most commonly
48
isolated from humans, ranks as the number one cause of central line-associated 49
bloodstream infections, the second most common cause of surgical site infections, and 50
the third most common cause of all healthcare-associated infections reported to the 51
National Healthcare Safety Network from 2009-2010 (3, 4).Uncertainty in the clinical
52
interpretation of S. epidermidis blood cultures can delay or misguide diagnosis and
53
treatment, increasing both morbidity and treatment costs (5, 6). The ideal of 54
distinguishing "true" infection from specimen contamination has not yet been realized, 55
and even the strictest definitions of S. epidermidis sepsis have been fraught with
56
exceptions, false positives, and examples of polyclonal infection (7, 8). 57
58
The diagnosis of S. epidermidis infections could be aided by the identification of markers
59
that accurately distinguish between infection and contaminant or commensal sources. 60
Antimicrobial resistance and biofilm phenotypes as well as the genetic markers mecA,
61
icaA, and IS256 have repeatedly been shown to be more common in hospital isolates than
62
in non-hospital isolates, but these markers are not necessarily useful for distinguishing 63
infection isolates from co-resident hospital isolates that contaminate clinical specimens 64
(9-13). Such markers may promote a hospital lifestyle and thus provide increased 65
opportunities to cause infections. In contrast, the genetic markers fdh and ACME have
66
been reported to be more common in contaminant or commensal isolates, than in true 67
infection isolates (14-16). 68
69
The search for markers of pathogenicity has extended to studies of S. epidermidis
70
population genetic structure. Multilocus sequence typing (MLST) has identified clones 71
such as sequence type (ST) 2 that are common in hospitals (15, 17-24). However, a 72
robust classification of S. epidermidis STs into larger groups of related STs has been
73
lacking (25). Recently, we used Bayesian clustering of the MLST data in the international 74
database to identify a species-wide population structure of six genetic clusters (GCs) that 75
on October 26, 2016 by guest
http://jcm.asm.org/
may relate to bacterial lifestyle (26). Analysis of isolates from clinical specimens from a 76
New York hospital showed that GC5 was common and enriched for hospital-associated 77
markers such as antibiotic resistance, high biofilm production, icaA, IS256, and
78
sesD/bhp, suggesting a lifestyle adapted to the hospital environment (26). GC1 and GC6
79
were also commonly isolated from clinical specimens but were not associated with the 80
tested markers (except GC6 and sesF/aap), suggesting a more generalist lifestyle. GC2
81
was rare from clinical specimens and positive for the putative commensal marker fdh.
82
GC3 was also rare from clinical specimens, and it was identified as a cluster with 83
significant admixture of DNA from all other clusters (26). Results from a recent genomic 84
analysis of diverse S. epidermidis isolates were consistent with this MLST classification;
85
specifically, genomic group A included MLST groups GC5, GC1 and GC6, and was 86
separated from genomic group B that included MLST groups GC2 and GC4 (27). 87
Recombination was most extensive in genomic group C that included MLST group GC3 88
(27). 89
90
In this study, we verified that six GCs define the population genetic structure of S.
91
epidermidis, using a larger, updated MLST database. We developed a SNP assay for
92
accurately assigning isolates to GCs without the need for full MLST or genomic data. To 93
test the hypothesis that GCs could distinguish isolation sources, we applied this system to 94
three collections of S. epidermidis isolates representing "true" bacteremia, blood isolates
95
considered to be contaminants, and non-hospital carriage isolates. We further 96
characterized isolates for seven previously studied genetic markers and developed a 97
machine learning algorithm to predict isolation sources with these data. 98
99
on October 26, 2016 by guest
http://jcm.asm.org/
MATERIALS AND METHODS 100
Bacterial isolates. Isolates were collected at the OSF Saint Francis Medical Center in 101
Peoria, Illinois, with the approval of the Peoria Institutional Review Board. Blood 102
cultures were processed in the OSF System Laboratory using a Bactec blood culture 103
system (Becton Dickinson). Several typical colonies were picked for identification and 104
sensitivity, done in a Vitek automated system (bioMérieux). The subcultures were then 105
stored on slants. Isolates were recovered from slants in the Pediatric Research 106
Laboratory, University of Illinois College of Medicine at Peoria, on tryptone soya 5% 107
blood agar. Single representative colonies were picked by one physician-microbiologist 108
(BMG). The predominant strain was selected by colony morphology from each of one to 109
six separate blood cultures. Single colony picks were also made for presumed 110
contaminant strains. 111
112
The total of 154 isolates were derived from three sources: 113
i) There were 59 isolates from 32 adult patients with "true" bacteremia, as determined 114
from two positive blood cultures obtained within 24 hours, having similar colony 115
morphology, plus evidence of infection confirmed by chart review. Two exceptions were 116
a patient who had a single blood culture associated with an infected vascular graft and 117
another with an associated skin infection. The selection of patient strains was intended to 118
provide a set of isolates with high specificity for infection (7, 8). Seventeen of the 119
infected patients also had 21 isolates deemed to be contaminants from the same or 120
separate blood cultures as the predominant infecting strain. 121
ii) There were 55 isolates considered to be contaminants: the 21 contaminant isolates 122
from the infected patients just described, and 34 isolates from 26 patients who had only a 123
single positive blood culture and evidence against infection upon chart review. Results 124
from these two sets of contaminants were analyzed separately and together and were 125
combined for the final analyses described below. All bacteremia and contaminant blood 126
culture isolates were collected from March, 2013 through February, 2014; patients ranged 127
in age from 19 to >80 years, 51% were male. 128
iii) There were 40 isolates from 23 non-hospital subjects who were fathers visiting their 129
infants in the neonatal intensive care unit during August, 2009, through January, 2010; all 130
on October 26, 2016 by guest
http://jcm.asm.org/
but three fathers were cultured within one week of their infants’ admission, usually at 131
their first visit. Cultures of anterior nares were obtained with Dacron swabs; cultures of 132
both hands were obtained using a bag and buffer method. 133
134
Isolates were stored and shipped in a Dorset egg medium without antibiotics (28) to the 135
University of Mississippi Medical Center. Isolates were coded, and genetic 136
characterization was completed in a blinded fashion. Isolates were cultured overnight at 137
37oC on tryptone soya agar or blood agar, and cryopreserved at -80oC in a solution of
138
trypic soy broth with 15% glycerol. DNA was extracted using the DNeasy Blood and 139
Tissue kit (Qiagen), according to the manufacturer’s instructions and using a solution of 140
1.5% lysostaphin and lysozyme during the initial incubation steps. Species identification 141
of isolates was confirmed by sequencing both strands of a tuf gene fragment (29) and
142
detecting >99% nucleotide identity to a reference sequence from S. epidermidis strain
143
ATCC 12228. Characteristics of all study isolates are given in Data Set S1 in the 144
supplemental material. 145
146
Bayesian clustering of MLST data. The international multilocus sequence typing 147
(MLST) database for S. epidermidis (sepidermidis.mlst.net) consisted of 588 sequence
148
types (STs) when downloaded September 4, 2015. Ten STs with insertion-deletion 149
polymorphism in the tpiA gene fragment were excluded, leaving 578 STs for analysis.
150
STs were assigned to genetic clusters (GCs) using the Bayesian clustering program BAPS 151
v6 (30) with previously described methods (31). In brief, MLST loci were oriented and 152
trimmed to the +1 reading frame and clustered with the codon linkage model. Upper 153
bounds of 11 to 20 populations were considered, each evaluated five times. Admixture 154
analysis based on mixture clustering of individuals used 100 iterations, 50 reference 155
individuals per population, and 10 iterations per reference individual. 156
157
Identification of SNPs that distinguish genetic clusters. Seven single nucleotide 158
polymorphisms (SNPs), comprising one SNP from each of the seven MLST gene 159
fragments, were selected from the 578 STs to maximally differentiate GCs. SNP selection 160
on October 26, 2016 by guest
http://jcm.asm.org/
was guided by the GST statistic, which estimates the proportion of the between-GC 161
diversity out of the total diversity. GST was calculated using DnaSP v5.10 software (32).
162 163
Assignment of SNP types to genetic clusters. SNP types were assigned to GCs using an 164
approach inspired by earlier studies that used multilocus data for probabilistic assignment 165
of individuals to populations (33). First, a reference table was constructed by calculating 166
the frequency of each allele, for each of the seven SNPs, for each GC, using data from the 167
578 STs (Table S1 in the supplemental material). Next, a likelihood score for assigning 168
each SNP type to each GC was calculated as Πpi2, where pi is the frequency of SNP i's
169
allele in a given GC. Zero-frequency alleles were recorded as 1/(n+1), where n is the
170
number of STs in the GC; this treatment assumes that zero-frequency alleles are rare and 171
would be found with additional sampling. Finally, a given SNP type was assigned to the 172
GC with the highest likelihood score if the log of the ratio of the highest to next highest 173
likelihood score was >1.3, indicating >95% confidence in the assignment. 174
175
SNP assay. PCR amplification of the MLST loci used the standard primers and 176
thermocycler conditions described previously (34), with the exception that an annealing 177
temperature of 50oC was used for some amplifications of
gtr and pyrR loci. PCR products
178
were combined to a total volume of 10 μL for each of two subsequent, allele-specific 179
primer extension (ASPE) reactions containing PCR products from arcC, aroE, tpiA, and
180
yqiL (Reaction 1), and from gtr, mutS, and pyrR (Reaction 2). The two reactions were
181
purified of residual dNTPs by addition of 1 µL of 5 U of exonuclease-I (EXO) and 0.5 U 182
of shrimp alkaline phosphatase (SAP) (Invitrogen) and incubation at 37oC for 30 min and
183
80oC for 15 min.
184 185
Fourteen ASPE primers were designed to detect the alleles of the seven selected SNPs 186
(described in Results). Each of the two ASPE reactions contained 5 µL of the EXO-SAP 187
treated PCR products, 0.3 U of tsp DNA polymerase (Invitrogen), 25 nM of ASPE primer 188
mixture, 5 µM dATP, dTTP, dGTP and biotin-dCTP (Invitrogen), 20 mM Tris-HCl, 50 189
mM KCl, and 1.25 mM MgCl2. The ASPE thermocyler conditions were 1 cycle of 95oC
190
for 5 mins, then 30 cycles of 94oC for 30 s, 55oC for 30 s, and 72oC for 1 min with a final
191
on October 26, 2016 by guest
http://jcm.asm.org/
extension of 72oC for 3 min. The manufacturer's protocol (Luminex) was followed for 192
hybridization of ASPE products to xTAG microspheres and washing, except that 193
microspheres concentrations were increased to 125 per μL, followed by incubation in 50 194
μL 1X Tm hybridization buffer with 0.2% streptavidin R-phycoerythrin conjugate at 195
37oC for 15 min.
196 197
Samples were analyzed on a Luminex 200 (Millipore) using Luminex Xponent v3.1 198
software. Results were expressed as median fluorescence intensity (MFI) for each allele. 199
The MFI values were corrected for background by subtracting MFI from unreacted bead 200
controls from the test MFI. An allele was scored with a minimum threshold of >150 MFI 201
and a proportion of MFIcalled allele/(MFIwild type allele+MFImutant type allele) of >0.9.
202 203
Detection of various genetic markers. Isolates were screened by PCR for the presence 204
of seven genetic markers previously studied for their associations with GCs (26). These 205
included the putative hospital markers icaA, IS256, mecA, sesD/bhp, and sesF/aap, and
206
the putative commensal markers fdh and arginine catabolic mobile element (ACME).
207
PCR primer sequences for these markers were listed previously (26), and thermocycler 208
conditions were the same as those used for MLST (34). 209
210
Statistical analyses. Bivariate associations were measured with odds ratios and 95% 211
confidence intervals (CIs), using InStat v3.1 software (GraphPad). In cases where 2x2 212
contingency tables had zero-frequency cells, 0.5 was automatically added to each cell. 213
The diversity of SNP types within GCs was measured by Simpson’s index (35) using the 214
Comparing Partitions website, http://darwin.phyloviz.net/ComparingPartitions/, with
215
95% CIs calculated as described previously (36). 216
217
Machine learning algorithm for prediction of isolation sources. Support vector 218
machines (SVMs) are a type of supervised machine learning algorithm that can perform 219
classification (37). In essence, SVMs first transform the predictor data (in this study, 220
binary-coded GCs and genetic markers) into a higher dimensional space by use of a 221
kernel function, and then find a hyperplane that maximally separates the classes. Two-222
on October 26, 2016 by guest
http://jcm.asm.org/
class prediction was done to distinguish hospital from non-hospital sources and, 223
separately, infection from contaminant sources. SVMs were run with the e1071 v1.6-4 224
package of R v2.7.0 software (38). SVMs used a radial kernel and two parameters, C 225
(cost of errors) and γ (kernel-specific). Optimal values of C and γ were determined from a
226
grid of values, using 10-fold cross-validation with a random 70% of the sample. The 227
SVMs were trained with the same random 70% of the sample as used for cross-228
validation, and tested with the remaining 30% of the sample. This entire procedure was 229
repeated 10 times, where each replicate represented a random 70:30 partition of the 230
sample. Classification accuracy, sensitivity and specificity were averaged across the 10 231
replicates. SVMs were rerun using "clone-corrected" samples, which excluded duplicate 232
isolates of the same SNP type and source from the same patient. This clone-corrected 233
sample totaled 119 isolates: 39 from hospital infections, 47 contaminants of clinical 234
specimens, and 33 non-hospital carriage isolates. 235
on October 26, 2016 by guest
http://jcm.asm.org/
RESULTS 236
Verification of the population genetic structure of S. epidermidis. Bayesian clustering 237
of 578 STs in the international MLST database identified six GCs (Fig. 1). A total of 419 238
of 437 (96%) STs previously analyzed by Thomas et al. (26) were classified into the 239
same GCs with the updated database (Table S2 in the supplemental material). All of the 240
18 STs that were reclassified involved GC3 (16 changed to GC3, 2 changed from GC3). 241
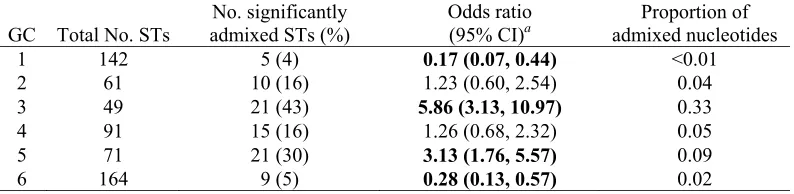
Both GC3 and GC5 were significantly enriched for admixed STs and had the highest 242
proportions of admixed nucleotides (Table 1). Both GC1 and GC6 were significantly 243
underrepresented for admixed STs and had the lowest proportions of admixed 244
nucleotides. Thus, the population structure of S. epidermidis, as inferred from Bayesian
245
clustering of the MLST database, was relatively consistent when the sample of 437 STs 246
was increased to 578 STs. 247
248
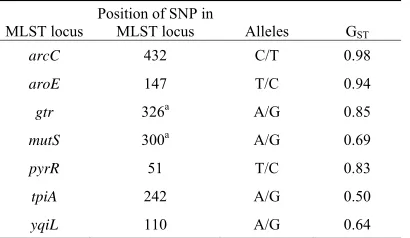
Development, validation, and application of a SNP typing assay to assign isolates to 249
GCs. One SNP from each of the seven MLST loci was selected to maximally
250
differentiate GCs, as guided by the GST statistic (Table 2). These seven SNPs produced
251
54 SNP types among the 578 STs (Table S2 in the supplemental material). The accuracy 252
of assigning these SNP types to the same GCs as found with full MLST data was 253
determined in silico using the approach described in the Methods. The SNP types for 545
254
of 578 (94%) STs were correctly assigned to GCs with confidence. Of the remaining 33 255
STs, the SNP types for six STs were incorrectly assigned to GCs with confidence, and the 256
SNP types for 27 STs were unassigned because the threshold for confidence was not met 257
(Table S2 in the supplemental material). SNP type 3 (CTAATAA) was represented by 258
143 STs including three of the six STs (ST145, ST161, ST164) that would be incorrectly 259
assigned to GCs with confidence. However, the presence of the arcC8 allele can be used
260
to identify SNP type 3 isolates that are of these problematic STs. 261
262
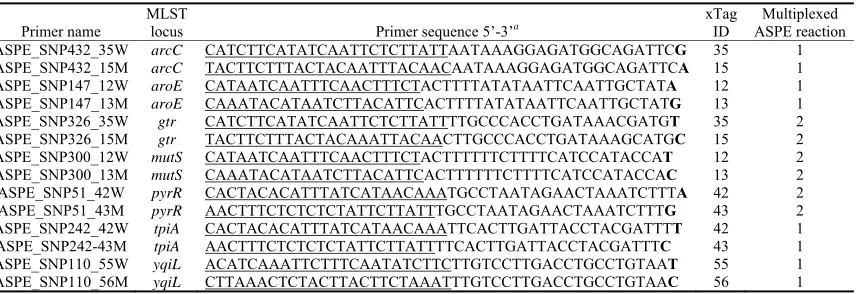
Allele-specific primer extension primers were designed to detect the alleles of the seven 263
SNPs (Table 3) with Luminex technology. This SNP assay was technically validated 264
using 30 strains of known, diverse STs. Each of these strains' alleles matched the 265
expected result with a mean fluorescence intensity >150 and allele proportion >0.90 266
on October 26, 2016 by guest
http://jcm.asm.org/
(Table S3 in the supplemental material). Application of the SNP typing assay to our study 267
sample of 154 isolates resulted in 14 SNP types that were each confidently assigned to a 268
GC (Table 4). SNP type 3 was the most frequent SNP type with 62 isolates; sequencing 269
of the arcC gene fragment from these isolates showed that none had the arcC8 allele and
270
thus did not belong to the problematic STs. Although GC2, GC3, and GC4 were 271
relatively rare in this sample, they tended to be more diverse in SNP type than GC1, 272
GC5, and GC6, but this result was not statistically significant (Table 4). 273
274
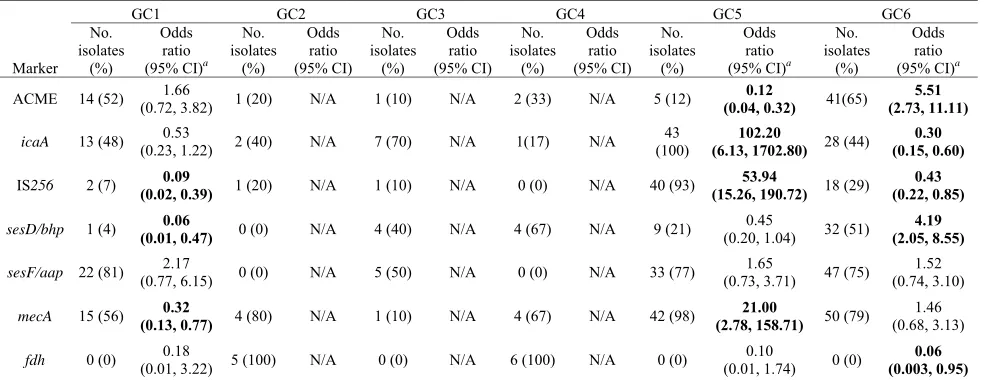
Associations between GCs, genetic markers, and isolation sources. PCR was used to 275
detect seven genetic markers that had been studied previously for their associations with 276
GCs (26). GC5 was positively associated with icaA, IS256, and mecA (Table 5). GC6 was
277
positively associated with ACME and sesD/bhp. The fdh gene was detected exclusively
278
within GC2 and GC4 (Table 5). 279
280
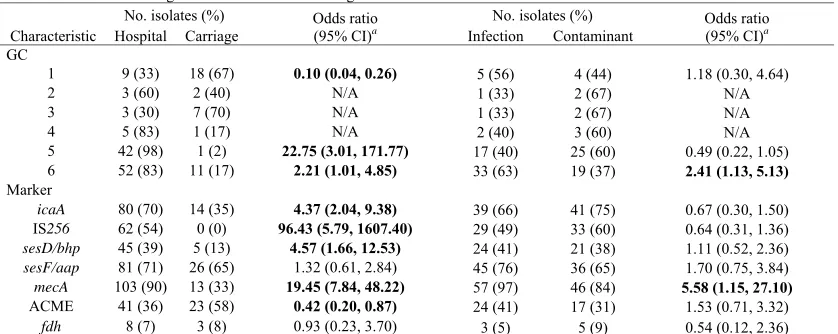
While there is a large literature on the associations between some genetic markers and 281
isolation sources, the associations between GCs and isolation sources have not been 282
measured previously. Results in Table 6 contrast hospital with non-hospital sources, and 283
further subdivide hospital source to contrast infection with contaminant sources. GC5, 284
GC6, icaA, IS256, sesD/bhp, and mecA were associated with hospital source (Table 6).
285
GC1 and ACME were associated with non-hospital source. There was no evidence of an 286
association between GC2, GC4, and fdh with non-hospital source (Table 6). In contrast,
287
GC6 and mecA were associated with an infection source, and no characteristic was
288
associated with contaminant source. 289
290
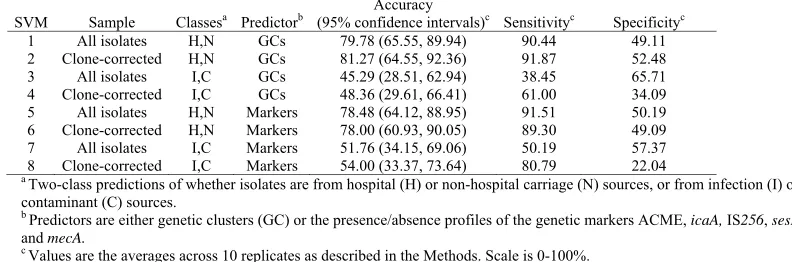
Prediction of isolation sources with GCs and genetic markers. Support vector 291
machines (SVMs) were used to predict isolation sources with all six GCs and the five 292
genetic markers that were associated with isolation sources in bivariate analyses. 293
Performance measures were averaged over 10 replicates of cross-validating parameters, 294
training, and testing of SVMs with random 70:30 partitions of the sample as described in 295
the Methods. GCs predicted hospital and non-hospital sources with an accuracy of 80%, 296
and the prediction of a hospital source when the isolate was from the hospital was much 297
on October 26, 2016 by guest
http://jcm.asm.org/
better (90% sensitivity) than the prediction of a non-hospital source when the isolate was 298
from non-hospital carriage (49% specificity) (Table 7). Genetic markers predicted 299
hospital and non-hospital sources with an accuracy of 78%, which was indistinguishable 300
from the GCs' accuracy when considering the broad confidence intervals. As with the 301
GCs' accuracy, the markers' accuracy was mostly due to the ability to distinguish the 302
hospital source (92% sensitivity, 50% specificity). In contrast, neither GCs nor markers 303
performed well in predicting infection and contaminant sources; accuracy was <53% for 304
both predictors (Table 7). Clone-corrected samples had similar accuracy with broader 305
confidence intervals in comparison to the samples that included all isolates, but they had 306
larger differences in sensitivity and specificity when predicting infection versus 307
contaminant sources (Table 7). As noted previously, only two characteristics were 308
associated with infection source (GC6 and mecA; Table 6) and no characteristic was
309
associated with contaminant source. The SVMs performed poorly under these conditions 310
and sometimes appear to have overfit the training data (i.e. the SVMs picked the 311
predominant class from the training set). 312
313
Post-hoc analysis of isolation sources. Although isolation sources were not defined 314
using genetic information, it may be instructive to re-evaluate sources in light of this 315
added information. In particular, we expect multiple infection isolates from the same 316
patient to often be indistinguishable genetically, allowing for some intra-host evolution of 317
the bacteria. For 20 of 24 (83%) patients with multiple infection isolates, all infection 318
isolates from a given patient matched by GC, and for 13 of 24 (54%) patients all infection 319
isolates from a given patient matched by the five genetic markers. Note, however, that the 320
markers include several mobile genetic elements and are not intended for strain 321
identification. On the other hand, among the 17 patients that were deemed to have both 322
infection and contaminant isolates, we expect the isolates from these different sources to 323
often differ genetically. All contaminant isolates were different from all infection isolates 324
from a given patient in only 4 of 17 (24%) patients when considering GCs and 7 of 17 325
(41%) patients when considering markers. 326
327
on October 26, 2016 by guest
http://jcm.asm.org/
These results suggest that our sampling procedures adequately captured true infection 328
isolates, but they also suggest that distinguishing contaminants from infection isolates 329
from the same patient, based on colony morphology as is common practice in some 330
hospital labs, may not be ideal. To determine the impact of some potentially misclassified 331
contaminant isolates on our analysis, we re-ran the SVMs after removing all 21 332
contaminant isolates from infected patients, leaving the 34 unambiguous contaminant 333
isolates from patients with single blood cultures and evidence against infection upon 334
chart review. While the ability to distinguish hospital from non-hospital sources was very 335
similar to the previous analysis (77% and 78% accuracy by GCs and markers, 336
respectively), there was a 12-16% increase in accuracy in distinguishing infection from 337
contaminant sources in comparison to the previous analysis (61% and 64% accuracy by 338
GCs and markers, respectively). 339
on October 26, 2016 by guest
http://jcm.asm.org/
DISCUSSION 340
In pioneering work on the population genetic structure of S. epidermidis, MLST data
341
were analyzed using the eBURST algorithm and most STs were classified into one clonal 342
complex (22). Subsequent studies reported some instabilities in this classification scheme 343
as the MLST database grew from 74 STs to 211 STs (25). With other species of 344
recombining bacteria, Bayesian clustering tools that model genetic admixture have 345
helped to define population structure (39, 40). Recently, we used a Bayesian clustering 346
approach with S. epidermidis MLST data, including all 437 STs in the international
347
database, and identified six genetic clusters (GCs) (26). Here, we confirmed the presence 348
of these six GCs in an updated database of 578 STs. A total of 96% of previously studied 349
STs were classified into the same GCs with the enlarged database, and all differently 350
classified STs involved the recombinant GC3. 351
352
In a clinical setting, MLST data may not be practical to collect and analyze, but it is not a 353
stretch to consider SNP typing and analysis using various multiplex platforms already 354
operational in many laboratories (41). Diverse sets of SNPs have been used in several 355
studies for typing staphylococci (42-44). Here, we used the GST statistic to select those
356
SNPs from MLST data that best distinguish the six GCs. The seven selected SNPs 357
correctly and confidently assigned 94% of the 578 STs to their GC, which indicates that 358
small sets of SNPs can provide a reliable foundation for a rapid assay of S. epidermidis
359
genetic background. 360
361
Previous work indicated that S. epidermidis GCs may reflect the species' ecology to some
362
extent (26). Specifically, associations were found between GCs and genetic markers of 363
isolation sources from clinical specimens from New York, but that study did not attempt 364
to distinguish infection from contaminant isolates and it did not include non-hospital 365
carriage isolates (26). Here, study of isolates from both clinical and non-clinical samples 366
from Illinois replicated several of the previously observed GC-marker associations and 367
allowed associations between GCs and isolation sources to be measured for the first time. 368
GC5 was confirmed to be associated with icaA, IS256, and mecA and all but one isolate
369
was from a hospital source, supporting the notion that this cluster is a hospital specialist. 370
on October 26, 2016 by guest
http://jcm.asm.org/
On the other hand, GC1 and GC6 did not have consistent associations with genetic 371
markers across studies, and they differed from each other in their associations to isolation 372
sources. Study of isolates from other geographic areas are needed to assess whether GC1 373
and GC6 exhibit a wide variation in their marker profiles and isolation sources as might 374
be expected of generalists. 375
376
Hospital-associated populations have been identified in other bacterial species that are 377
opportunistic pathogens. Willems et al. (40) identified three hospital-associated
378
populations of Enterococcus faecium using Bayesian clustering of MLST data, which
379
subdivided the CC17 group previously defined by eBURST analysis of MLST data. Each 380
of the three populations were significantly underrepresented for admixed STs (40); 381
however, subsequent analysis of genome sequences from representatives of these 382
populations identified an important role for recombination in generating their diversity 383
(45). By comparison, the MLST data for S. epidermidis suggest relatively more
384
recombination in hospital-associated GC5 and less recombination in hospital-associated 385
GC6, whereas a subsequent genomic analysis that places GC5 and GC6 together in a 386
group with GC1 shows recombination in all three of these backgrounds (27). These 387
results indicate that hospital-associated populations of S. epidermidis may not be isolated
388
from recombination with non-hospital populations as has been proposed for E. faecium.
389 390
GC3 was confirmed to be a highly recombinant genetic cluster of S. epidermidis. The
391
previous analysis of the MLST database of 437 STs (26), as well as the current analysis 392
of the larger database of 578 STs, both show that GC3 has a higher proportion of 393
admixed STs and a higher proportion of admixed nucleotides relative to other GCs. These 394
results are consistent with the genomic analysis of Meric et al. (27) that showed GC3 395
isolates to be the most recombinant. The genetic and/or ecological basis for GC3's 396
recombinant character and its role in the diversification of S. epidermidis populations
397
requires further study. 398
399
GC2 and GC4 were the sole backgrounds for the fdh gene, and all isolates belonging to
400
these two GCs were positive for fdh. This gene was proposed by Conlan et al. (14) as a
401
on October 26, 2016 by guest
http://jcm.asm.org/
marker for commensal isolates. Here, the GC2 and GC4 isolates were relatively rare 402
overall, but they were not overrepresented by non-hospital carriage isolates. Our data 403
suggest that fdh is a marker of these particular GCs rather than a marker of a commensal
404
lifestyle. Despite their rarity in the sample, GC2, GC3, and GC4 tended to be more 405
diverse in SNP types than GC1, GC5, and GC6. Of note, SNP types extracted from draft 406
genome sequences of S. epidermidis from wild mouse species (46) as well as from an
407
unusual enterotoxin-producing human clinical isolate (47) can be reliably classified into 408
GC4 (I. E. Tolo and D. A. Robinson, unpublished data). Together, these observations 409
may indicate that some of these rare GCs represent a large, scantly sampled population 410
with an ecological niche that is broader than the skin of healthy humans. 411
412
The goal of this study was to test the hypothesis that GCs could distinguish isolation 413
sources. Using a supervised machine learning algorithm, no significant differences were 414
observed in the accuracy of predicting isolation sources with either GCs or a set of five 415
genetic markers that might more directly relate to pathogenicity. While both GCs and 416
markers predicted hospital and non-hospital sources with about 80% accuracy, they 417
predicted infection and contaminant sources within the hospital only about half the time. 418
These results indicate that hospital and non-hospital sources are better distinguished than 419
are different populations within hospitals. Infection isolates might be selected at random 420
from a population that has evolved fitness for hospital settings. 421
422
Our study has some limitations. One potential source of error, evaluated in the post-hoc 423
analysis of sources, comes from the selection of contaminant isolates from infected 424
patients using colony morphology as the discriminator. Even though this reflects a "real 425
world" approach to identifying contaminants in some hospital labs, these potential 426
misclassifications of source make the infection and contaminant sources appear to be 427
more similar to each other. Here, isolate selection attempted to minimize false positives 428
with respect to infection, and very few of the multiple infection isolates may have been 429
inadvertent contaminants. Thus, while blood culturing and sepsis diagnosis remains a 430
complex process, involving blood sampling techniques, laboratory procedures, and 431
on October 26, 2016 by guest
http://jcm.asm.org/
clinical assessments (8, 48), SNP-based characterization of two or more isolates from the 432
same patient may aid in diagnosing "true" infection in some individual patients. 433
434
The relatively small sample sizes of the different sources is another limitation of our 435
study that resulted in broad confidence intervals for accuracy and some overfitting of the 436
training data when analyzing subsets of the sample. Sharma et al. (23) used SVMs 437
directly with S. epidermidis MLST data and reported a slightly lower prediction accuracy
438
(73%) that was partially attributed to small sample size of 100 isolates and high diversity 439
of STs. Here, with a sample size of 154 isolates, clustering of isolates into GCs, and 440
performing two-class prediction with cross-validated SVM parameter values, it was 441
possible to achieve a slightly higher, but still generalizable, prediction accuracy. 442
However, we anticipate that the greatest gains in predicting the sources of S. epidermidis
443
isolates solely from bacterial characteristics will come from studying well-sampled 444
genome sequences for informative polymorphisms, which might be exploited for 445
diagnostic assays using an approach similar to that outlined in this study. 446
on October 26, 2016 by guest
http://jcm.asm.org/
FUNDING INFORMATION 447
This work was supported in part by grant GM080602 from the National Institutes of 448
Health (to D.A.R.). 449
on October 26, 2016 by guest
http://jcm.asm.org/
REFERENCES 450
1. Grice EA, Kong HH, Conlan S, Deming CB, Davis J, Young AC, NISC 451
Comparative Sequencing Program, Bouffard GG, Blakesley RW, Murray PR, 452
Green ED, Turner ML, Serge JA. 2009. Topographical and temporal diversity of the 453
human skin microbiome. Science. 324(5931):1190-1192. doi:10.1126/science.1171700.
454 455
2. Rupp ME. 2014.In Fey PD (ed), Staphylococcus epidermidis methods and protocols.
456
Springer, New York NY {Clinical characteristics of infections in humans due to 457
Staphylococcus epidermidis}
458 459
3. Rogers KL, Fey PD, Rupp ME.2009. In Crossley KB (ed), The staphylococci in
460
human disease, 2nd ed. Blackwell Publishing, Oxford {Epidemiology of infections due to
461
coagulase-negative staphylococci} 462
463
4. Sievert DM, Ricks P, Edwards JR, Schneider A, Patel J, Srinivasan A, Kallen A, 464
Limbago B, Fridkin S, National Healthcare Safety Network (NHSN) Team and 465
Participating NHSN Facilities. 2013. Antimicrobial-resistant pathogens associated with 466
healthcare-associated infections: Summary of data reported to the National Healthcare 467
Safety Network at the Centers for Disease Control and Prevention, 2009-2010. Infect 468
Control Hosp Epidemiol. 34(1):1–14. doi:10.1086/668770.
469 470
5. Blot SI, Depuydt P, Annemans L, Benoit D, Hoste E, De Waele JJ, Decruyanaere 471
J, Vogelaers D, Colardyn F, Vandewoude KH. 2005. Clinical and economic outcomes 472
in critically ill patients with nosocomial catheter-related bloodstream infections. Clin 473
Infect Dis. 41 (11):1591-1598. doi:10.1086/497833.
474 475
6. Rello J, Ochagavia A, Sabanes E, Roque M, Mariscal D, Reynaga E, Valles J. 476
2000. Evaluation of outcome of intravenous catheter-related infections in critically ill 477
patients. Amer J Respir Crit Care Med. 162 (3 Pt 1):1027-1030. doi:
478
10.1164/ajrccm.162.3.9911093. 479
480
on October 26, 2016 by guest
http://jcm.asm.org/
7. Sharma M, Riederer K, Johnson LB, Khatib R. 2001. Molecular analysis of 481
coagulase-negative Staphylococcus isolates from blood cultures: prevalence of genotypic
482
variation and polyclonal bacteremia. Clin Infect Dis. 33 (8):1317-1323.
483
doi:10.1086/322673. 484
485
8. Beekmann SE, Diekema DJ, Doern GV. 2005. Determining the clinical significance 486
of coagulase-negative staphylococci isolated from blood cultures. Infect Control Hosp 487
Epidemiol. 26(6):559-566.
488 489
9. Frebourg NB, Lefebvre S, Baert S, Lemeland JF. 2000. PCR-based assay for 490
discrimination between invasive and contaminating Staphylococcus epidermidis strains. J
491
Clin Microbiol 38(2): 877-880.
492 493
10. Kozitskaya S, Cho SH, Dietrich K, Marre R, Naber K, Ziebuhr W. 2004. The 494
bacterial insertion sequence element IS256 occurs preferentially in nosocomial
495
Staphylococcus epidermidis isolates: association with biofilm formation and resistance to
496
aminoglycosides. Infect Immun. 72(2):1210-1215.
497 498
11. Mekni MA, Bouchami O, Achour W, Ben Hassen A. 2012. Strong biofilm 499
production but not adhesion virulence factors can discriminate between invasive and 500
commensal Staphylococcus epidermidis strains. APMIS. 120(8):605-611. doi:
501
10.1111/j.1600-0463.2012.02877. 502
503
12. Rhode H, Kalitzky M, Kröger N, Scherpe S, Horstkotte MA, Knobloch JK, 504
Zander AR, Mack D. 2004. Detection of virulence–associated genes not useful for 505
discriminating between invasive and commensal Staphylococcus epidermidis strains from
506
a bone marrow transplant unit. J Clin Microbiol. 42(12):5614-5619.
507 508
13. Vandecasteele SJ, Peetermans WE, R Merckx R, Rijnders BJ, Van Eldere J. 509
2003. Reliability of the ica, aap and atlE genes in the discrimination between invasive,
510
on October 26, 2016 by guest
http://jcm.asm.org/
colonizing and contaminant Staphylococcus epidermidis isolates in the diagnosis of
511
catheter-related infections. Clin Microbiol Infect. 9(2):114-119.
512 513 514
14. Conlan S, Mijares LA, NISC Comparative Sequencing Program, Becker J, 515
Blakesley RW, Bouffard GG, Brooks S, Coleman H, Gupta J, Gurson N, Park M, 516
Schmidt B, Thomas PJ, Otto M, Kong HK, Murray PR, Segre JA. 2012. 517
Staphylococcus epidermidis pan-genome sequencing analysis reveals diversity of skin
518
commensal and hospital infection-associated isolates. Genome Biol.13(7):R64.
519
doi:10.1186/gb-2012-13-7-r64. 520
521
15. Du X, Zhu Y, Song Y, Li T, Lou T, Sun G, Yang C, Cao C, Lu Y, Li M. 2013. 522
Molecular analysis of Staphylococcus epidermidis strains isolated from community and
523
hospital environments in China. PLoS One 8(5):e62742. doi:
524
10.1371/journal.pone.0062742. 525
526
16. Granslo HN, Klingenberg C, Fredheim EG, Rønnestad A, Mollnes TE, Flægstad 527
T. 2010. Arginine catabolic mobile element is associated with low antibiotic resistance
528
and low pathogenicity in Staphylococcus epidermidis from neonates. Pediatr Res.
529
68(3):237-241. doi:10.1203/00006450-201011001-00463.
530 531
17. Cherifi S, Byl B, Deplano A, Nonhoff C, Denis O, Hallin M. 2013. Comparative 532
epidemiology of Staphylococcus epidermidis isolates from patients with catheter-related
533
bacteremia and from healthy volunteers. J Clin Microbiol. 51(5):1541-1547.
534
doi:10.1128/JCM.03378-12.
535 536
18. Kozitskaya S, Olson ME, Fey PD, Witte W, Ohlsen K, Ziebuhr W. 2005. Clonal 537
analysis of Staphylococcus epidermidis isolates carrying or lacking biofilm-mediating
538
genes by multilocus sequence typing. J Clin Microbiol. 43(9):4751-4757.
539
doi:10.1128/JCM.43.9.4751-4757.2005. 540
541
on October 26, 2016 by guest
http://jcm.asm.org/
19. Li M, Wang X, Gao Q, Lu Y. 2009. Molecular characterization of Staphylococcus
542
epidermidis strains isolated from a teaching hospital in Shanghai, China. J Med
543
Microbiol. 58(Pt 4):456-461. doi: 10.1099/jmm.0.007567-0.
544 545
20. Iorio NL, Caboclo RF, Azevedo MB, Barcellos AG, Neves FP, Domingues RM, 546
dos Santos KR. 2012. Characteristics related to antimicrobial resistance and biofilm 547
formation of widespread methicillin-resistant Staphylococcus epidermidis ST2 and ST23
548
lineages in Rio de Janeiro hospitals, Brazil. Diagn Microbiol Infect Dis. 72(1):32-40. doi:
549
10.1016/j.diagmicrobio.2011.09.017. 550
551
21. Mendes RE, Deshpande LM, Costello AJ, Farrell DJ. 2012. Molecular 552
epidemiology of Staphylococcus epidermidis clinical isolates from U.S. hospitals.
553
Antimicrob Agents Chemother. 56(9):4656-4661. doi: 10.1128/AAC.00279-12.
554 555
22. Miragaia M, Thomas JC, Couto I, Enright MC, de Lencastre H. 2007. Inferring a 556
population structure for Staphylococcus epidermidis from multilocus sequence typing
557
data. J Bacteriol. 189(6):2540-2552. doi:10.1128/JB.01484-06.
558 559
23. Sharma P, Satorius AE, Raff MR, Rivera A, Newton DW, Younger JG. 2014. 560
Multilocus sequence typing for interpreting blood isolates of Staphylococcus epidermidis.
561
Interdiscip Perspect Infect Dis. 2014:787458. doi:10.1155/2014/787458.
562 563
24. Widerstöm M, McCullough CA, Coombs GW, Monsen T, Christiansen KJ. 564
2012. A multidrug-resistant Staphylococcus epidermidis clone (ST2) is an ongoing cause
565
of hospital-acquired infection in a Western Australian hospital. J Clin Microbiol. 566
50(6):2147-2151 dio:10.1128/JCM.06456-11.
567 568
25. Smyth DS, Robinson DA. 2010. In Robinson DA, Falush D, Feil EJ (ed), Bacterial
569
population genetics in infectious disease. John Wiley & Sons, Hoboken NJ. {Population 570
genetics of Staphylococcus}
571 572
on October 26, 2016 by guest
http://jcm.asm.org/
26. Thomas JC, Zhang L, Robinson DA. 2014. Differing lifestyles of Staphylococcus
573
epidermidis as revealed through Bayesian clustering of multilocus sequence types. Infect
574
Genet Evol. 22:257-264. doi:10.1016/j.meegid.2013.06.020.
575 576
27. Méric G, Miragaia M, de Been M, Yahara K, Pascoe B, Mageiros L, Mikhail J, 577
Harris LG, Wilkinson TS, Rolo J, Lamble S, Bray JE, Jolley KA, Hanage WP, 578
Bowden R, Maiden MCJ, Mack D, de Lencastre H, Feil EJ, Corander J, Sheppard 579
SK. 2015. Ecological overlap and horizontal gene transfer in Staphylococcus aureus and
580
Staphylococcus epidermidis. Genome Biol Evol. doi: 10.1093/gbe/evv066.
581 582
28. Gray BM. 2002. Egg-based media for delayed processing of nasopharyngeal swabs 583
in colonization studies of Streptococcus pneumoniae. Eur J Clin Microbiol Infect Dis.
584
21(9):666-670.
585 586
29. Heikens E, Fleer A, Paauw A, Florijn A, Fluit AC. 2005. Comparison of genotypic 587
and phenotypic methods for species-level identification of clinical isolates of coagulase-588
negative staphylococci. J Clin Microbiol. 43(5):2286-2290.
doi:10.1128/JCM.43.5.2286-589
2290.2005. 590
591
30. Corander J, Marttinen P, Sirén J, Tang J. 2008. Enhanced Bayesian modelling in 592
BAPS software for learning genetic structures of populations. BMC Bioinformatics. 593
9:539. doi:10.1186/1471-2105-9-539.
594 595
31. Thomas JC, Robinson DA. 2014. In Fey PD (ed), Staphylococcus epidermidis
596
methods and protocols. Springer, New York NY. {Multilocus sequence typing of 597
Staphylococcus epidermidis}
598 599
32. Librado P, Rozas J. 2009. DnaSP v5: a software for comprehensive analysis of 600
DNA polymorphism data. Bioinform. 25(11):1451-1452.
601
doi:10.1093/bioinformatics/btp187. 602
603
on October 26, 2016 by guest
http://jcm.asm.org/
33. Paetkau D, Calvert W, Stirling I, Strobeck C. 1995. Microsatellite analysis of 604
population structure in Canadian polar bears. Mol Ecol. 4(3):347-354.
605 606
34. Thomas JC, Vargas MR, Miragaia M, Peacock SJ, Archer GL, Enright MC. 607
2007. Improved multilocus sequence typing scheme for Staphylococcus epidermidis. J
608
Clin Microbiol. 45(2):616-619
609 610
35. Simpson E. 1949. Measurement of diversity. Nature, 163:688. 611
612
36. Grundmann H, Hori S, Tanner G. 2001. Determining confidence intervals when 613
measuring genetic diversity and the discriminatory abilities of typing methods for 614
microorganisms. J Clin Microbiol. 39(11):4190-4192.
615 616
37. Noble WS. 2006. What is a support vector machine? Nature Biotechnology. 24 :1565-617
1567. doi:10.1038/nbt1206-1565 618
619
38. Meyer D, Dimitriadou E, Hornik K, Weingessel A, Leisch F. 2014. e1071: Misc 620
functions of the Department of Statistics, TU Wien. R package version 1.6-4. 621
https://cran.r-project.org/package=e1071 622
623
39. Falush D, Stephens M, Pritchard JK. 2003. Inference of population structure using 624
multilocus genotype data: linked loci and correlated allele frequencies. Genetics 625
164(4):1567-15687.
626 627
40. Willems RJ, Top J, van Schaik W, Leavis H, Bonten M, Sirén J, Hanage WP, 628
Corander J. 2012. Restricted gene flow among hospital subpopulations of Enterococcus
629
faecium. MBio. 3(4):e00151-12. doi: 10.1128/mBio.00151-12.
630 631
41. Liesenfeld O, Lehman L, Hunfeld KP, Kost G. 2014. Molecular diagnosis of 632
sepsis: new aspects and recent developments. Eur J Micobiol Immunol. 4(1):1-25.
633
doi:10.1556/EuJMI.4.2014.1.1. 634
on October 26, 2016 by guest
http://jcm.asm.org/
635
42. Robertson GA, Thiruvenkataswamy V, Shilling H, Price EP, Huygens F, 636
Henskens FA, Giffard PM. 2004. Identification and interrogation of highly informative 637
single nucleotide polymorphism sets defined by bacterial multilocus sequence typing 638
databases. J Med Microbiol. 53(Pt 1):35-45.
639 640
43. Stephens AJ, Huygens F, Inman-Bamber J, Price EP, Nimmo GR, Schooneveldt 641
J, Munckhof W, Giffard PM. 2006. Methicillin-resistant Staphylococcus aureus
642
genotyping using a small set of polymorphisms. J Med Microbiol. 55(Pt1):43-51.
643 644
44. Holmes A, McAllister G, McAdam PR, Hsien Choi S, Girvan K, Robb A, 645
Edwards G, Templeton K, Fitzgerald JR. 2014. Genome-wide single nucleotide 646
polymorphism-based assay for high-resolution epidemiological analysis of the 647
methicillin-resistant Staphylococcus aureus hospital clone EMRSA-15. Clin Microbiol
648
Infect. 20(2):0124-0131. doi:10.1111/1469-0691.12328.
649 650
45. de Been M, van Schaik W, Cheng L, Corander J, Willems RJ. 2013. Recent 651
recombination events in the core genome are associated with adaptive evolution in 652
Enterococcus faecium. Genome Biol Evol. 5(8):1524-1535. doi:10.1093/gbe/evt111.
653 654
46. Wang J, Kuenzel S, Baines JF. 2014. Draft genome sequences of 11 Staphylococcus
655
epidermidis strains isolated from wild mouse species. Genome Announc. 2(1):e01148-13.
656
doi:10.1128/genomeA.01148-13. 657
658
47. Madhusoodanan J, Seo KS, Remortel B, Park JY, Hwang SY, Fox LK, Park 659
YH, Deobald CF, Wang D, Liu S, Daugherty SC, Gill AL, Bohach GA, Gill SR. 660
2011. An enterotoxin-bearing pathogenicity island in Staphylococcus epidermidis. J
661
Bacteriol. 193(8):1854-1862. doi:10.1128/JB.00162-10.
662 663
48. Weinstein MP. 2003. Blood culture contamination: persisting problems and partial 664
progress. J Clin Microbiol. 41(6):2275-2278. doi:10.1128/JCM.41.6.2275-2278.203.
665
on October 26, 2016 by guest
http://jcm.asm.org/
FIGURE LEGENDS 667
Figure 1 Assignment of 578 sequence types (STs) in the multilocus sequence typing 668
(MLST) database to six genetic clusters (GCs). The X axis corresponds to all 578 STs in
669
the MLST database, color coded by GC as follows: GC1 (red), GC2 (green), GC3 (blue), 670
GC4 (orange), GC5 (pink), GC6 (teal). The Y axis indicates the percentage of ancestry
671
contributed to the ST by each GC. 672
on October 26, 2016 by guest
http://jcm.asm.org/
on October 26, 2016 by guest
http://jcm.asm.org/
Table 1 Summary of BAPS admixture analysis of 578 S. epidermidis sequence types
GC Total No. STs admixed STs (%) No. significantly Odds ratio (95% CI)a admixed nucleotides Proportion of
1 142 5 (4) 0.17 (0.07, 0.44) <0.01
2 61 10 (16) 1.23 (0.60, 2.54) 0.04
3 49 21 (43) 5.86 (3.13, 10.97) 0.33
4 91 15 (16) 1.26 (0.68, 2.32) 0.05
5 71 21 (30) 3.13 (1.76, 5.57) 0.09
6 164 9 (5) 0.28 (0.13, 0.57) 0.02
a Statistically significant values are highlighted in boldface.
on October 26, 2016 by guest
http://jcm.asm.org/
Table 2 Single nucleotide polymorphisms used to assign S. epidermidis isolates to genetic clusters
MLST locus Position of SNP in MLST locus Alleles GST
arcC 432 C/T 0.98
aroE 147 T/C 0.94
gtr 326a A/G 0.85
mutS 300a A/G 0.69
pyrR 51 T/C 0.83
tpiA 242 A/G 0.50
yqiL 110 A/G 0.64
a Indicates that the locus has been reverse complemented from that in the
S. epidermidis MLST database.
on October 26, 2016 by guest
http://jcm.asm.org/
Table 3 Allele-specific primer extension (ASPE) primers
Primer name MLST locus Primer sequence 5’-3’a xTag ID ASPE reaction Multiplexed ASPE_SNP432_35W arcC CATCTTCATATCAATTCTCTTATTAATAAAGGAGATGGCAGATTCG 35 1
ASPE_SNP432_15M arcC TACTTCTTTACTACAATTTACAACAATAAAGGAGATGGCAGATTCA 15 1 ASPE_SNP147_12W aroE CATAATCAATTTCAACTTTCTACTTTTATATAATTCAATTGCTATA 12 1
ASPE_SNP147_13M aroE CAAATACATAATCTTACATTCACTTTTATATAATTCAATTGCTATG 13 1
ASPE_SNP326_35W gtr CATCTTCATATCAATTCTCTTATTTTGCCCACCTGATAAACGATGT 35 2 ASPE_SNP326_15M gtr TACTTCTTTACTACAAATTACAACTTGCCCACCTGATAAAGCATGC 15 2
ASPE_SNP300_12W mutS CATAATCAATTTCAACTTTCTACTTTTTTCTTTTCATCCATACCAT 12 2 ASPE_SNP300_13M mutS CAAATACATAATCTTACATTCACTTTTTTCTTTTCATCCATACCAC 13 2 ASPE_SNP51_42W pyrR CACTACACATTTATCATAACAAATGCCTAATAGAACTAAATCTTTA 42 2
ASPE_SNP51_43M pyrR AACTTTCTCTCTCTATTCTTATTTGCCTAATAGAACTAAATCTTTG 43 2 ASPE_SNP242_42W tpiA CACTACACATTTATCATAACAAATTCACTTGATTACCTACGATTTT 42 1
ASPE_SNP242-43M tpiA AACTTTCTCTCTCTATTCTTATTTTCACTTGATTACCTACGATTTC 43 1 ASPE_SNP110_55W yqiL ACATCAAATTCTTTCAATATCTTCTTGTCCTTGACCTGCCTGTAAT 55 1 ASPE_SNP110_56M yqiL CTTAAACTCTACTTACTTCTAAATTTGTCCTTGACCTGCCTGTAAC 56 1
a Sequences complimentary to the xTags and target alleles are underlined and in boldface, respectively.
on October 26, 2016 by guest
http://jcm.asm.org/
Table 4 Diversity of the six S. epidermidis genetic clusters in the Illinois population
GC No. isolates
Simpson’s index of diversity (95% CI)
SNP type
(No. isolates) Alleles at 7 MLST loci
1 27 0.15 (0.00-0.32) 1 (25) CTGATAA
9 (1) CTGGTAA
17 (1) CTGATGA
2 5 0.40 (0.00-0.83) 10 (1) TTAGCAG
5 (4) TTAGCGG
3 10 0.36 (0.05-0.66) 7 (8) CTAACGA
4 (2) CTAACAA
4 6 0.33 (0.00-0.74) 6 (5) TCAGCGG
29 (1) TCAACGA
5 43 0.18 (0.03-0.33) 2 (39) TTGATAA
8 (3) TTGACAA
16 (1) TTAATAA
6 63 0.03 (0.00-0.09) 3 (62) CTAATAA
35 (1) CTAGTAA
on October 26, 2016 by guest
http://jcm.asm.org/
Table 5 Associations of genetic clusters with selected genetic markers
Marker
GC1 GC2 GC3 GC4 GC5 GC6
No. isolates
(%)
Odds ratio (95% CI)a
No. isolates
(%)
Odds ratio (95% CI)
No. isolates
(%)
Odds ratio (95% CI)
No. isolates
(%)
Odds ratio (95% CI)
No. isolates
(%)
Odds ratio (95% CI)a
No. isolates
(%)
Odds ratio (95% CI)a
ACME 14 (52) (0.72, 3.82) 1.66 1 (20) N/A 1 (10) N/A 2 (33) N/A 5 (12) (0.04, 0.32) 0.12 41(65) (2.73, 11.11)5.51
icaA 13 (48) (0.23, 1.22) 0.53 2 (40) N/A 7 (70) N/A 1(17) N/A (100) 43 (6.13, 1702.80)102.20 28 (44) (0.15, 0.60)0.30
IS256 2 (7) (0.02, 0.39)0.09 1 (20) N/A 1 (10) N/A 0 (0) N/A 40 (93) (15.26, 190.72)53.94 18 (29) (0.22, 0.85)0.43
sesD/bhp 1 (4) (0.01, 0.47)0.06 0 (0) N/A 4 (40) N/A 4 (67) N/A 9 (21) (0.20, 1.04) 0.45 32 (51) (2.05, 8.55)4.19
sesF/aap 22 (81) (0.77, 6.15) 2.17 0 (0) N/A 5 (50) N/A 0 (0) N/A 33 (77) (0.73, 3.71) 1.65 47 (75) (0.74, 3.10) 1.52
mecA 15 (56) (0.13, 0.77)0.32 4 (80) N/A 1 (10) N/A 4 (67) N/A 42 (98) (2.78, 158.71)21.00 50 (79) (0.68, 3.13) 1.46
fdh 0 (0) (0.01, 3.22) 0.18 5 (100) N/A 0 (0) N/A 6 (100) N/A 0 (0) (0.01, 1.74) 0.10 0 (0) (0.003, 0.95)0.06
a Statistically significant values are highlighted in boldface. N/A indicates that an odds ratio was not applicable due to small sample size.
on October 26, 2016 by guest
http://jcm.asm.org/
Table 6 Associations of genetic clusters and selected genetic markers with isolation sources No. isolates (%) Odds ratio
(95% CI)a
No. isolates (%) Odds ratio (95% CI)a
Characteristic Hospital Carriage Infection Contaminant GC
1 9 (33) 18 (67) 0.10 (0.04, 0.26) 5 (56) 4 (44) 1.18 (0.30, 4.64)
2 3 (60) 2 (40) N/A 1 (33) 2 (67) N/A
3 3 (30) 7 (70) N/A 1 (33) 2 (67) N/A
4 5 (83) 1 (17) N/A 2 (40) 3 (60) N/A
5 42 (98) 1 (2) 22.75 (3.01, 171.77) 17 (40) 25 (60) 0.49 (0.22, 1.05) 6 52 (83) 11 (17) 2.21 (1.01, 4.85) 33 (63) 19 (37) 2.41 (1.13, 5.13)
Marker
icaA 80 (70) 14 (35) 4.37 (2.04, 9.38) 39 (66) 41 (75) 0.67 (0.30, 1.50)
IS256 62 (54) 0 (0) 96.43 (5.79, 1607.40) 29 (49) 33 (60) 0.64 (0.31, 1.36)
sesD/bhp 45 (39) 5 (13) 4.57 (1.66, 12.53) 24 (41) 21 (38) 1.11 (0.52, 2.36)
sesF/aap 81 (71) 26 (65) 1.32 (0.61, 2.84) 45 (76) 36 (65) 1.70 (0.75, 3.84)
mecA 103 (90) 13 (33) 19.45 (7.84, 48.22) 57 (97) 46 (84) 5.58 (1.15, 27.10)
ACME 41 (36) 23 (58) 0.42 (0.20, 0.87) 24 (41) 17 (31) 1.53 (0.71, 3.32) fdh 8 (7) 3 (8) 0.93 (0.23, 3.70) 3 (5) 5 (9) 0.54 (0.12, 2.36)
a Statistically significant values are highlighted in boldface. N/A indicates that an odds ratio was not applicable due to small sample
size.
on October 26, 2016 by guest
http://jcm.asm.org/
Table 7 Performance of genetic clusters and selected genetic markers in predicting isolation source with SVMs
SVM Sample Classesa Predictorb (95% confidence intervals)Accuracy c Sensitivityc Specificityc
1 All isolates H,N GCs 79.78 (65.55, 89.94) 90.44 49.11
2 Clone-corrected H,N GCs 81.27 (64.55, 92.36) 91.87 52.48
3 All isolates I,C GCs 45.29 (28.51, 62.94) 38.45 65.71
4 Clone-corrected I,C GCs 48.36 (29.61, 66.41) 61.00 34.09
5 All isolates H,N Markers 78.48 (64.12, 88.95) 91.51 50.19
6 Clone-corrected H,N Markers 78.00 (60.93, 90.05) 89.30 49.09
7 All isolates I,C Markers 51.76 (34.15, 69.06) 50.19 57.37
8 Clone-corrected I,C Markers 54.00 (33.37, 73.64) 80.79 22.04
a Two-class predictions of whether isolates are from hospital (H) or non-hospital carriage (N) sources, or from infection (I) or
contaminant (C) sources.
b Predictors are either genetic clusters (GC) or the presence/absence profiles of the genetic markers ACME,
icaA, IS256, sesD/bhp,
and mecA.
c Values are the averages across 10 replicates as described in the Methods. Scale is 0-100%.
on October 26, 2016 by guest
http://jcm.asm.org/