© Author(s) 2009. This work is distributed under the Creative Commons Attribution 3.0 License.
Geophysicae
Azimuthal expansion of the dipolarization at geosynchronous orbits
associated with substorms
C. J. Watson and P. T. Jayachandran
Physics Dept., University of New Brunswick, P.O. Box 4400, 8 Bailey Drive, Fredericton, New Brunswick, E3B 5A3, Canada Received: 29 September 2008 – Revised: 16 February 2009 – Accepted: 16 February 2009 – Published: 5 March 2009
Abstract. Dipolarization, one of the main indicators of sub-storm expansion onset, represents topological changes in the magnetotail. It is believed that dipolarization is initiated at a longitudinally confined region in the tail, followed by the azimuthal expansion. There are very limited studies in the literature regarding the azimuthal propagation of the dipolar-ization front in the magnetotail. In this study we have used ten years of GOES data and POLAR and IMAGE data to study the characteristics of the propagation of the dipolar-ization fronts at the geosynchronous orbit. We have iden-tified a number of dipolarization events in the GOES mag-netic field data and substorm onsets from POLAR UVI and IMAGE-FUV measurements. Using the delay of dipolariza-tion signatures at the two GOES satellites and onset times from POLAR and IMAGE measurements we have estimated the propagation speed of the dipolarization fronts. The cal-culated speeds vary between 10 km/s and 420 km/s and show a power law distribution.
Keywords. Magnetospheric physics (Auroral phenomena; Magnetosphere-ionosphere interactions; Magnetospheric configuration and dynamics)
1 Introduction
Dipolarization in the near Earth magnetotail has become rec-ognized as a signature of magnetospheric substorms (Bele-haki et al., 1998; Frank et al., 2000; Liou et al., 2002; Jay-achandran et al., 2007) and its study can be critical in un-derstanding substorm dynamics and the mechanism behind substorm onset. Dipolarization is a topological change of the inner magnetosphere from a stretched (tail-like) config-uration to a relaxed (dipole-like) magnetic field
configura-Correspondence to: C. J. Watson
tion. Liou et al. (2001) have shown that there exists a tem-poral delay between auroral onset and magnetic field dipo-larization at GOES, representing the latitudinal and longitu-dinal propagation of the auroral bulge. Also shown is a close mapping between the ionospheric auroral bulge and dipolar-ization in the magnetotail. Dipolardipolar-ization coinciding with substorm onset occurs initially in a narrow, localized tail re-gion in the 6–10RE range. This synchronal occurrence is
often explained by diversion of the cross tail current into the auroral ionosphere when energy buildup in the magne-totail reaches a critical level (McPherron et al., 1973; Lui, 1991). This current diversion forms the well known substorm current wedge, which flows through the westward electrojet in the ionosphere. Auroral arc expansion is associated with electrojet current expansion as well as expansion of the dis-rupted cross tail current in the neutral plasma sheet. Initial localized dipolarization due to initial current disruption is followed by an azimuthal (Kokubun and McPherron, 1981; Liou et al., 2002) and radial (Ohtani, 2001) propagation in the magnetotail associated with a poleward and equatorward expansion of the auroral arcs (Lopez and Lui, 1990).
6.0 6.5 7.0 7.5 8.0 8.5 9.0 Time (UT)
38.6 40.4 42.3 44.1
GOES
8
Inclination
(deg)
52.6 56.8 61.0 65.2
GOES
10
Inclination
(deg)
06:00 LT 12:00 LT
18:00 LT
00:00 LT o GOES 8 GOES 10 o
*
substorm
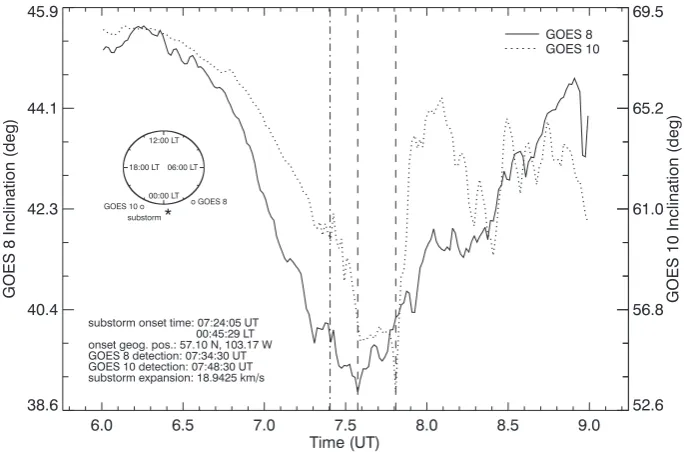
[image:2.595.126.469.61.287.2]substorm onset time: 07:24:05 UT 00:45:29 LT onset geog. pos.: 57.10 N, 103.17 W GOES 8 detection: 07:34:30 UT GOES 10 detection: 07:48:30 UT substorm expansion: 18.9425 km/s
Fig. 1. Temporal variation in magnetic inclination calculated from GOES 8 and GOES 10 magnetometer data on 31 August 2000. Substorm onset is indicated by the vertical dash-dot line and GOES detection of dipolarization fronts by dashed lines at the local inclination minimum for each satellite. Also plotted is a local time dial showing local time of substorm onset relative to each satellite.
et al., 2004) (May 2000–December 2005 onsets) data. Onset latitude, longitude and time were used in conjunction with GOES data to monitor the evolution of dipolarization at the geosynchronous orbit associated with substorm events.
2 Data, method of analysis and results
We have used GOES magnetic field data to identify mag-netic field dipolarization in the magnetotail associated with substorms. GOES data is time-averaged in 1 min bins tagged at 30 s passed the minute. Magnetic inclination was calcu-lated at GOES east (75◦ west) and west (135◦ west) from magnetometer measurements, as in Eq. (1).
I =tan−1q Bz
B2 x+By2
(1)
We have calculated inclination to avoid use of multiple pa-rameters such as three magnetic field components. We have used substorm onsets identified by Liou et al. (2001) and Frey et al. (2004) from POLAR UVI and IMAGE satellite data. From these databases we have chosen isolated sub-storm onset times, latitudes and longitudes. An example of the temporal variation of magnetic field inclination around a substorm onset time is shown in Fig. 1. This substorm event of 31 August 2000 occurred with onset at 07:24:05 UT, in-dicated by a vertical dash-dot line in the figure. Dipolariza-tion at each GOES followed this onset and is indicated by vertical dashed lines. Initial drop in inclination at each satel-lite suggests stretching of the magnetotail associated with the
substorm growth phase. This is followed by an increase in inclination representing dipolarization onset at 07:34:30 UT for GOES 8 and 07:48:30 UT for GOES 10. Geographic lo-cal time of substorm onset relative to GOES lolo-cal times is also indicated in the Fig. 1 insert. Onset occurs near local midnight at 00:15:48 LT, between GOES 8 (02:24:05 LT) and GOES 10 (22:25:05 LT). Temporal delay between onset time and when dipolarization signatures reach GOES satellites in-dicates a propagation of the dipolarization fronts. The dif-ference in delay time of dipolarization (GOES West minus GOES East) is shown in Fig. 2, with 1 h time averages of these delays indicated by large, diamond symbols. This dis-tribution is similar to that shown by Nagai (1991). By ignor-ing radial propagation effects and assumignor-ing equal east and west azimuthal propagations (see discussion), the azimuthal expansion speed of the dipolarization fronts can be calcu-lated from the temporal delay between onset and dipolariza-tion identificadipolariza-tion times.
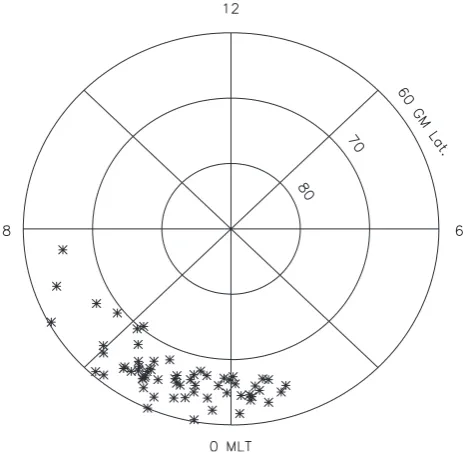
We have limited our study to onsets occurring between 00:00–11:00 UT and 60◦–70◦N geomagnetic latitudes to limit radial propagation of dipolarization fronts. The cho-sen time interval singles out onsets occurring at longitudes between GOES satellites. By limiting our onset times and latitudes as mentioned above we have identified 127 isolated substorm events for analysis. Figure 3 indicates latitude and local time distribution of onsets used in the study.
0 2 4 6 8 10 UT
-40 -20 0 20 40
GOES
W
est
-GOES
East
[image:3.595.313.545.62.290.2](minutes)
Fig. 2. Delay in local dipolarization onset between GOES East (GOES 8 or 12) and GOES west (GOES 9 or 10) for substorm on-set times. The large diamond shapes indicate 1 h averages of these delays.
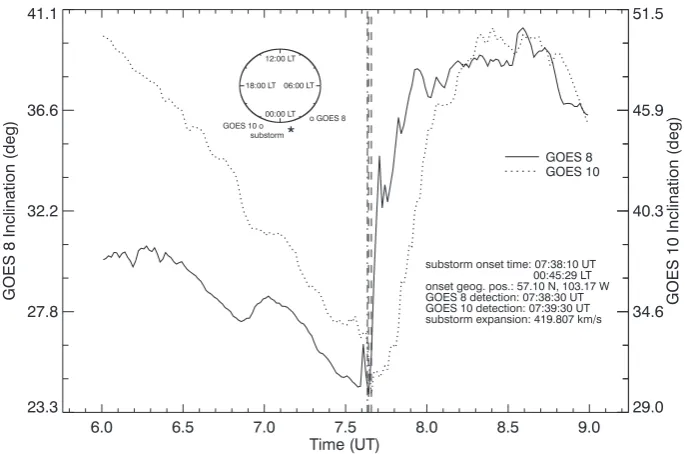
variation in inclination on 20 February 2001 with substorm onset at 10:19:32 UT, followed by dipolarization at GOES 10 at 10:32:30 and GOES 8 at 10:44:30, giving an expansion speed of 19.5 km/s. This speed was quite typical for this study and represents the range in which most speeds oc-curred. Figure 5 shows magnetic inclination for a 18 July 2001 substorm. We found temporal delays of 1 and 2 min between onset and dipolarizations for GOES 8 and 10 for this event, giving an expansion speed of 223.3 km/s. This event type was rare as few speeds fell above 100 km/s. The highest calculated speed was 419.8 km/s for the event repre-sented in Fig. 6. Delay time was 20 s for GOES 8 and 80 s for GOES 10 (20 s delay is estimated from the 1 min aver-age GOES data, therefore the delay is ambiguous by 1 min). A histogram showing the distribution of calculated speeds is shown in Fig. 7. A large number of propagations occur in the 20 to 60 km/s range with the number of events dropping as speed increases indicating a power law probability distribu-tion.
3 Discussion
[image:3.595.48.288.63.232.2]We have used GOES magnetic field measurements along with POLAR UVI and IMAGE-FUV data to estimate the azimuthal expansion speed of dipolarization fronts at the geosynchronous orbits. Estimated speeds varied be-tween∼10 km/s (lowest) and∼420 km/s (highest) with most speeds in the 20–60 km/s range. This result confirms earlier studies that dipolarization initially occurs in a narrowly con-fined longitudinal region (Kokubun and McPherron, 1981; Liou et al., 2002). Propagation speeds are similar to those reported by Liou et al. (2002). The results presented in this paper related to the expansion speed may be ambiguous for
Fig. 3. Geomagnetic latitudes and magnetic local times of some substorm onsets used in this study.
9.0 9.5 10.0 10.5 11.0 11.5 12.0 Time (UT)
56.4 57.8 59.1 60.4
GOES
8
Inclination
(deg)
47.9 56.4 64.8 73.3
GOES
10
Inclination
(deg)
06:00 LT 12:00 LT
18:00 LT
00:00 LT o GOES 8
o GOES 10*
substorm
[image:4.595.125.469.61.287.2]substorm onset time: 10:19:32 UT 03:02:42 LT onset geog. pos.: 57.42 N, 109.21 W GOES 8 detection: 10:44:30 UT GOES 10 detection: 10:32:30 UT substorm expansion: 19.4966 km/s
Fig. 4. Magnetic inclination calculated from GOES data showing dipolarization signatures of a substorm event on 20 February 2001.
4.0 4.5 5.0 5.5 6.0 6.5 7.0
Time (UT) 22.7
25.6 28.6 31.5 34.4
GOES
8
Inclination
(deg)
51 55 59 64 68
GOES
10
Inclination
(deg)
GOES 8 GOES 10
06:00 LT 12:00 LT 18:00 LT
00:00 LT o GOES 8 GOES 10 o
*
substorm
substorm onset time: 05:48:26 UT 21:54:00 LT onset geog. pos.: 62.99 N, 118.61 W GOES 8 detection: 05:49:30 UT GOES 10 detection: 05:50:30 UT substorm expansion: 223.310 km/s
Fig. 5. Magnetic inclination calculated from GOES data showing dipolarization signatures of a substorm event on 18 July 2001.
It is interesting to note that previous studies (e.g. Lui et al., 2000) of some parameters associated with substorms have re-vealed similar distributions to the one shown in Fig. 7. To determine the power law coefficient of the propagation speed distribution, a log-log plot of this distribution was produced (Fig. 8) with a best-fit line over selected data. We find the propagation speed follows a power law with index−1.256. This finding is consistent with Lui et al. (2000), who reported power law distributions in auroral blob size and intensity
[image:4.595.127.468.325.555.2]6.0 6.5 7.0 7.5 8.0 8.5 9.0 Time (UT)
23.3 27.8 32.2 36.6 41.1
GOES
8
Inclination
(deg)
29.0 34.6 40.3 45.9 51.5
GOES
10
Inclination
(deg)
GOES 8 GOES 10 06:00 LT
12:00 LT
18:00 LT
00:00 LT o GOES 8 GOES 10 o
* substorm
[image:5.595.126.469.60.287.2]substorm onset time: 07:38:10 UT 00:45:29 LT onset geog. pos.: 57.10 N, 103.17 W GOES 8 detection: 07:38:30 UT GOES 10 detection: 07:39:30 UT substorm expansion: 419.807 km/s
Fig. 6. Magnetic inclination calculated from GOES data showing dipolarization signatures of a substorm event on 8 May 2001.
0 60 120 180 240 300 360 420 speed (km/s)
0 3 6 9 12 15 18
number
of
[image:5.595.50.284.332.505.2]events
Fig. 7. Distribution of azimuthal expansion speeds of dipolarization fronts.
prevent it from exceeding that critical state. The parameters of the event are dependent on the internal state of the system and independent of external variables. In the case of sub-storms it is proposed that energy build up in the magnetotail reaches a critical state triggering an “avalanche” or release of energy via cross tail current diversion. The amount of en-ergy release follows a power law probability distribution and determines the magnitude of the substorm event.
Power Law Fit of Selected Data
2.5 3.0 3.5 4.0 4.5
log(speed) 0
1 2 3 4
Power Law Fit with Full Data Overplot
2.0 3.0 4.0 5.0
log(speed) 0
1 2 3 4
power law coefficient = -1.256
log
(number
of
events)
log
(number
of
events)
Fig. 8. Log-log plot of the speed distribution in Fig. 7. Distribution follows a power law with an index of−1.256.
4 Conclusions
[image:5.595.308.545.333.514.2]synchronous orbits. Propagation speeds follow a power law with an index of−1.256. This is similar to previous find-ings in which power law distributions for auroral size and intensity are reported. Findings support the “sandpile” or “avalanche” model for substorm dynamics, in which event parameters are governed by self-organized criticality. Acknowledgements. This research at UNB was supported by the
Natural Science and Engineering Research Council (NSERC) of Canada.
Topical Editor R. Nakamura thanks two anonymous referees for their help in evaluating this paper.
References
Bak, P., Tang, C., and Wiesenfeld, K.: Self-organized criticality: An explanation of 1/f noise, Phys. Rev. Lett., 59, 381–384, 1987. Belehaki, A., Tsagouri, I., and Mavromichalaki, H.: Study of the longitudinal expansion velocity of the substorm current wedge, Ann. Geophys., 16, 1423–1433, 1998,
http://www.ann-geophys.net/16/1423/1998/.
Cheng, C. Z.: Physics of substorm growth phase, onset and dipolar-ization, Space Sci. Rev., 113, 207–270, 2004.
Frank, L. A., Paterson, W. R., Sigwarth, J. B., and Kokubun, S.: Observations of magnetic field dipolarization during auroral sub-storm onset, J. Geophys. Res., 105, 15897–15912, 2000. Frey, H. U., Mende, S. B., Angelopoulus, V., and Donovan, E. F.:
Substorm onset observations by IMAGE-FUV, J. Geophys. Res., 109, 10304.1–10304.6, 2004.
Res., 112, 10216.1–10216.5, 2007.
Kokubun, S. and McPherron, R. L.: Substorm signatures at syn-chronous altitude, J. Geophys. Res., 86, 11265–11277, 1981. Liou, K., Meng, C. I., Lui, A. T. Y., Newell, P. T., and Wing, S.:
Magnetic dipolarization with substorm expansion onset, J. Geo-phys. Res., 107, 1131, doi:10.1029/2001JA000179, 2002. Liou, K., Newell, P. T., Sibeck, D. G., Meng, C. I., Brittnacher, M.,
and Parks, G.: Observation of IMF and seasonal effects in the location of auroral substorm onset, J. Geophys. Res., 106, 5799– 5810, 2001.
Lopez, R. E. and Lui, A. T. Y.: A multisatellite case study of the expansion of a substorm current wedge in the near-earth magne-totail, J. Geophys. Res., 95, 8009–8017, 1990.
Lui, A. T. Y., Chapman, S. C., Liou, K., Newell, P. T., Meng, C. I., Brittnacher, M., and Parks, G.K.: Is the dynamic magnetosphere an avalanching system?, Geophys. Res. Lett., 27, 911–914, 2000. Lui, A. T. Y.: A synthesis of magnetospheric substorm models, J.
Geophys. Res., 96, 1849–1856, 1991.
McPherron, R. L., Russell, C. T., and Aubry, M. P.: Satellite studies of magnetospheric substorms on August 15, 1968, Phenomeno-logical model for substorms, J. Geophys. Res., 78, 3131–3149, 1973.
Nagai, T.: An empirical model of substorm-related magnetic field variations at synchronous orbit, Geophys. Monogr. Ser., 64, 91– 95, 1991.