O R I G I N A L A R T I C L E
Open Access
Increase in brain activation due to
sub-tasks during driving: fMRI study using new
MR-compatible driving simulator
Mi-Hyun Choi
1, Hyung-Sik Kim
1, Hee-Jeong Yoon
1, Jung-Chul Lee
1, Ji-Hye Baek
1, Jin-Seung Choi
1, Gye-Rae Tack
1,
Byung-Chan Min
2, Dae-Woon Lim
3and Soon-Cheol Chung
1*Abstract
Background:Several studies have used functional magnetic resonance imaging (fMRI) to show that neural activity is associated with driving. fMRI studies have also elucidated the brain responses associated with driving while performing sub-tasks. It is important to note that these studies used computer mouses, trackballs, or joysticks to simulate driving and, thus, were not comparable to real driving situations. In order to overcome these limitations, we used a driving wheel and pedal equipped with an MR-compatible driving simulator (80 km/h). The subjects drove while performing sub-tasks, and we attempted to observe differences in neuronal activation.
Methods:The experiments consisted of three blocks and each block consisted of both a control phase (1 min) and
a driving phase (2 min). During the control phase, the drivers were instructed to look at the stop screen and to not perform driving tasks. During the driving phase, the drivers either drove (driving only condition) or drove while performing an additional sub-task (driving with sub-task condition) at 80 km/h.
Results:Compared to when the drivers were focused only on driving, when the drivers drove while performing a
sub-task, the number of activation voxels greatly decreased in the parietal area, which is responsible for spatial perception. Task-performing areas, such as the inferior frontal gyrus and the superior temporal gyrus, showed increased activation. Performing a sub-task simultaneously while driving had affected the driver’s driving. The cingulate gyrus and the sub-lobar region (lentiform nucleus, caudate, insula, and thalamus), which are responsible for error monitoring and control of unnecessary movements (e.g., wheel and pedal movements), showed increased activation during driving with sub-task condition compared to driving only condition.
Conclusions:Unlike simple driving simulators (joysticks, computer mouses, or trackballs) used in previous research, the addition of a driving wheel and pedals (accelerator and brake) to the driving simulator used in this study closely represents real driving. Thus, the number of processed movements was increased, which led to an increased number of unnecessary movements that needed to be controlled. This in turn increased activation in the
corresponding brain regions.
Keywords:MR-compatible driving simulator, Sub-task (additional task), Driving, Sub-lobar, fMRI
* Correspondence:[email protected]
1Department of Biomedical Engineering, Research Institute of Biomedical
Engineering, College of Biomedical & Health Science, Konkuk University, Chungju, South Korea
Full list of author information is available at the end of the article
Background
Driving is a complex multitasking activity that in-volves perception, attention, decision-making, sensory, motor, and higher-level cognitive components [1, 2]. Recent studies on complex multitasking (driving)-re-lated neural correlates have used functional magnetic resonance imaging (fMRI) to study its neurophysio-logical aspects [3–17]. In previous studies, driving was simulated by using a joystick, computer mouse, or a trackball. They revealed the activation of the fol-lowing regions: the parietal lobe and precuneus region (spatial perception), the precentral gyrus and frontal eye field regions (motor response, arm and eye move-ment) [5, 12], the supplementary motor area (SMA) and cerebellum region (motor control and action planning) [3, 6, 12, 14–16], and the cingulate gyrus region (attention and error monitoring) [3, 5, 12, 14].
Recently, the increase in electronic device use has re-sulted in the performance of frequent sub-tasks during driving. Sub-tasks can be defined as radio tuning, dialing a cell phone, eating, or carrying on a conversation. These sub-tasks are reported to decrease driving per-formance (brake response time, tracking perper-formance, speed control, car following, and lane keeping) measured using physiological assessments [1, 2, 7, 11, 15]. Safe driving requires the ability to concentrate, to divide one’s attention between multiple sensory events across visual and auditory modalities, and to make fast cognitive deci-sions in a complex and rapidly changing environment. Neuroimaging studies of neurophysiological variables have also elucidated the neural substrates involved dur-ing drivdur-ing while performdur-ing sub-tasks such as conversa-tion, auditory language comprehension, and visual event detection [5, 8, 9, 11, 14, 15, 17].
Several studies have been carried out to observe the changes in brain activation related to visual cognition [3–6], spatial attention or vigilance [3, 5], and motor function [14] while driving and performing sub-tasks simultaneously. It is reported that when performing driving and sub-tasks simultaneously, the activation of the parietal and occipital areas related to driving is re-duced [8, 9, 11, 15]. It is also reported that when per-forming driving and sub-tasks simultaneously, the activation of the precentral gyrus, the frontal and par-ietal lobes, and cingulate gyrus areas related to attention, stimulus processing, motor responses, and decision-making is increased [5, 8, 9, 11, 14, 15, 17]. When per-forming driving and sub-tasks simultaneously, motor areas have decreased activation while the activation of areas related to sub-tasks, such as motor control and at-tention areas, is increased [8, 9, 11, 15].
However, the above studies were not realistic because the subjects performed the driving task using a joystick, computer mouses, or trackball with one hand in the
simulated driving conditions (e.g., video game and driv-ing simulator). In fact, drivdriv-ing is performed usdriv-ing a wheel (handle) and pedals. Therefore, it is difficult to de-termine the regions of the brain that are activated during the various cognitive activities required in actual driving using the systems used in previous studies. For this rea-son, some previous studies have attempted to simulate driving in a real driving environment by using a wheel and pedals. When using a computer mouse or a track-ball to simulate driving and the sub-tasks simultan-eously, fine control is actually worse than when a wheel and pedal is used in actual driving. For example, one can more accurately maintain a lane when controlling a wheel with both hands than when using a computer mouse or a trackball. In addition, one can more accur-ately control speed using the brake and one can more accurately control acceleration using the right foot than when using a computer mouse and a trackball. We, therefore, performed simulated driving in our study using a wheel and pedals to more accurately simulate driving control and the brain activation patterns present in an actual driving environment.
In order to overcome the limitations of previous stud-ies, we used an MR-compatible driving simulator with a driving wheel and pedals in order to observe the effects of sub-tasks on driving. Our objective was to observe differences in activated brain regions using neurophysio-logical assessments during driving alone and when sub-tasks were performed during driving. Our working hypotheses were as follows. First, it is expected that the activation of the parietal area, which is the spatial perception-related area, will decrease and that the acti-vation of areas related to sub-task performance will in-crease when performing driving and the sub-task simultaneously compared to driving only. Second, when performing driving and the sub-tasks simultaneously, the sub-tasks will affect driving. Therefore, the activation of areas related to behavior and motions used to control driving are expected to increase. Third, as previous stud-ies simulated driving by using one hand (computer mouse, trackball, etc.), while this study used a wheel controlled with both hands and pedals controlled with the right foot, an additional area related to these actions is expected to be activated.
Methods
Subjects
Fifteen men with a driving experience of 2.5 ± 1.6 years and without any psychiatric illness or nerve/brain-re-lated conditions were selected. Their average age was 26.0 ± 1.4 years. All subjects were right-handed as evalu-ated using the revised Edinburgh test [18]. Any subjects who might have had claustrophobia, pacemakers, or metal embedded in their bodies, which would have af-fected MR imaging, were excluded from the selection process. Prior to the experiment, all participants were prohibited from smoking, drinking alcohol/coffee, or any external activity that could impair their driving. The ex-periment was then explained to them. The subjects were required to practice in the simulation environment with the simulator until they could drive normally without crashing. The protocol for the research project was ap-proved by the Institutional Review Committee of Konkuk University, where the work was undertaken. Our research protocol also conforms to the provisions of the Declaration of Helsinki (KU-IRB-11-46-A-1).
MR-compatible driving simulator
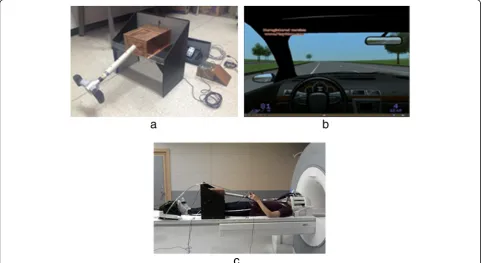
The research team developed an MR-compatible driving simulator with a driving wheel and pedals, as seen in Fig. 1a. The simple driving environment was produced using software provided by Lightrock Entertainment, and was made up of mostly straight roadways with very few elements that could distract the driver (Fig. 1b). The
subjects used both hands to operate the wheel and their right foot to control the accelerator and the brake. They drove at a constant 80 km/h without changing road lanes. Generally, in Korea, the speed limits on the roads are in accordance with Article 19 of “Road Traffic Act enforcement regulations” (speed of cars, etc.) and the highest speed limit on general roads with two or more one-way lanes (all roads other than highways and motor-ways) is less than 80 km/h. In consideration of safety and accessibility when preparing the test video, this study used general roads of two or more one-way lanes as the video, which was presented at a simulated speed of 80 km/h, which is the regulated speed limit on gen-eral roads. The visual information for driving was dis-played on a visual system attached to the subjects’head coil. Fig. 1c shows the preparation before the beginning of the experiment.
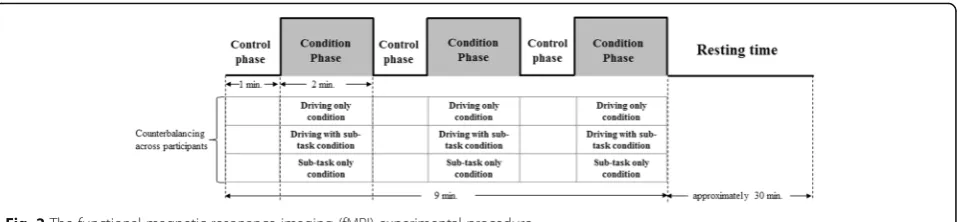
Experimental design
The experiment was performed using three conditions. Each condition consisted of three same blocks and every block has a control phase (1 min) and a condition phase (2 min). The first condition is when only driving is per-formed. In this condition, one block consists of a control phase (1 min) and a driving only condition (2 min) (Fig. 2a). The second condition is when driving and a sub-task are performed simultaneously. In this condi-tion, one block consists of a control phase (1 min) and a
driving with sub-task condition (2 min) (Fig. 2a). The third condition is when only a sub-task is performed. In this condition, one block consists of a control phase (1 min) and a sub-task only condition (2 min) (Fig. 2b). Commonly, during the control phase, the drivers were instructed to simply look at the screen, which showed a parked, non-moving state. During the driving only con-dition, the subjects were asked to only drive at 80 km/h. During the driving with sub-task condition, the drivers were asked to drive at 80 km/h while performing a sub-task. Finally, all subjects were asked to only perform a sub-task under identical conditions during the sub-task only condition. Each subject participated in the above three conditions (driving only, driving with sub-task, and sub-task only conditions). Once the first experiment was concluded, the subjects were all provided with plenty of resting time (approximately 30 min) and were then sent to the next experiment. The condition order was counterbalanced across participants. The speed of the vehicle was displayed on the lower left-hand corner of each subject’s screen in order to help them maintain a speed of 80 km/h.
The sub-task consisted of performing an addition. The addition task consisted of problems using double-digit numbers with sums of less than 100 and required carry-over calculations. Each block consisted of 10 problems. Thus, there were a total of 30 problems in the addition task. The experimenters used the audio system attached to the MR system to vocally present the task and the subjects confirmed the answers using their voices. The subjects were encouraged to concentrate on both driving and the addition tasks.
Image acquisition
Images were scanned using a 3T MRI system (Magne-tom TrioTim, Siemens Medical Systems, Erlangen, Germany) with a standard 32-channel head coil. Single-shot echo planar fMRI scans were acquired in 29 continuous slices parallel to the anterior commissure-posterior commissure line. The parameters for fMRI were as follows: repetition time (TR)/echo time (TE) = 3000/30 ms, field of view (FOV) = 200 mm, flip angle = 90°, matrix = 128 × 128, slice thickness = 5 mm, and
voxel size = 1.6 × 1.6 × 5.0 mm. Anatomical images were obtained using a T1-weighted three-dimensional magnetization-prepared rapid gradient-echo sequence with TR/TE = 1900/2.48 ms, FOV = 200 mm, flip angle = 9°, matrix = 256 × 256, slice thickness = 1 mm, and voxel size = 0.8 × 0.8 × 1.0 mm.
Image analysis
The fMRI data were analyzed using SPM 8 software (Wellcome Department of Cognitive Neurology, London, UK). All functional images were aligned with the anatomic images of the study using affine transform-ation routines built into the SPM 8 program. The rea-ligned scans were co-registered to the participant’s anatomic images obtained within each session. The ana-tomical images were then segmented into white matter, gray matter, and cerebrospinal fluid. The mean echo pla-nar image (EPI) of each subject was directly warped into the standard EPI template (Montreal Neurologic Insti-tute) during a normalization step. The size of one di-vided voxel in normalizing process is 1.6 × 1.6 × 3 mm. The time-series data were motion-corrected by Sinc interpolation and filtered using a 240-s high-pass filter to remove artifacts because of cardiorespiratory and other cyclical influences. The functional images were then smoothed using a 8-mm full-width-half-maximum isotropic Gaussian kernel prior to statistical analyses. The statistical analysis was conducted using SPM 8 both individually (first level) and as a group (second level) using the general linear model and the theory of Gaussian random fields. Statistical parametric maps were computed usingt-statistics. Individual subjects were ana-lyzed at a significance threshold of p< 0.05, which was corrected using the topological peak-false discovery rate (FDR).
The active regions of the brain during driving only condition and driving with sub-task condition were ex-tracted and compared to those of the control phase using the subtraction method ([driving only or driving with sub-task condition]—control). The double subtrac-tion method was used to observe any regions exhibiting special activity during either driving condition (driving
only—driving with task and driving with sub-task—driving only conditions).
We also extracted the numbers of activation area vox-els during driving only condition and driving with sub-task condition using the subtraction method for each subject. We then performed a paired t-test (PASW Sta-tistics 18) to compare the numbers of activation area voxels by condition.
Results Accuracy rate
When only the addition task was performed (sub-task only condition), the accuracy rate of the subjects was 84.8 ± 10.9%. The accuracy rate was 78.5 ± 11.7% when the addition task was combined with driving (driving with sub-task condition) (Table 1). No differences of note were observed using a paired t-test (PASW Statis-tics 18) (p= 0.196).
Brain activation regions determined using the subtraction method
During driving only condition, the frontal region (infer-ior frontal gyrus (IFG), middle frontal gyrus (MFG), su-perior frontal gyrus (SFG), and precentral gyrus), parietal region (superior parietal lobe (SPL), inferior par-ietal lobe (IPL), postcentral gyrus, and precuneus), tem-poral region (superior temtem-poral gyrus (STG) and middle temporal gyrus (MTG)), occipital region (inferior occipi-tal gyrus (IOG), superior occipioccipi-tal gyrus (SOG), middle occipital gyrus (MOG), and lingual gyrus), limbic region (cingulate gyrus), sub-lobar region (insula and lentiform
nucleus), and the cerebellum (uvular, declive, and cere-bellar tonsil) all exhibit activation (Table 2 and Fig. 3a).
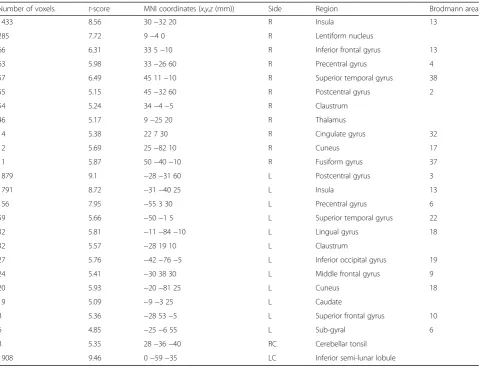
During driving with sub-task condition, the frontal re-gion (IFG, MFG, SFG, precentral gyrus, and sub-gyral), parietal region (postcentral gyrus), temporal region (STG and fusiform gyrus), occipital region (IOG and lin-gual gyrus), limbic region (cingulate gyrus), sub-lobar re-gion (lentiform nucleus, insula, claustrum, thalamus, cuneus, and caudate), and the cerebellum (cerebellar tonsil and inferior semi-lunar lobule) were shown to have activation (Table 3 and Fig. 3b).
In order to compare the numbers of activation area voxels for each condition calculated using the above sub-traction method, we performed a paired t-test by extracting the areas activated in common.
The number of activation voxels was significantly re-duced in areas such as the MFG (p= 0.046) and the pre-central gyrus (p= 0.033) during driving with sub-task condition when compared to the driving only condition. On the other hand, when driving and performing the sub-tasks simultaneously, the number of activation voxels was significantly increased in the postcentral gyrus (p= 0.031) and the insula (p= 0.011) when compared to driving only condition. Other commonly activated areas were IFG, SFG, STG, IOG, cingulate gyrus, lentiform nucleus, and the cerebellar tonsil. There were no significant differences between the two conditions in these areas.
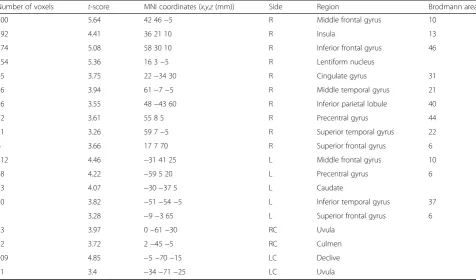
During sub-task only condition, the frontal region (IFG, MFG, SFG, and precentral gyrus), parietal region (IPL), temporal region (inferior temporal gyrus (ITG), MTG, STG, and caudate), limbic region (cingulate gyrus), sub-lobar region (lentiform nucleus and insula), and the cerebellum (uvula, culmen, and declive) showed signs of activation (Table 4 and Fig. 3c).
Brain activation regions determined using the double subtraction method
The double subtraction method was used to observe the regions of the brain that exhibited special activation when the subject was only driving (driving only condi-tion) or driving while performing a sub-task (driving with sub-task condition).
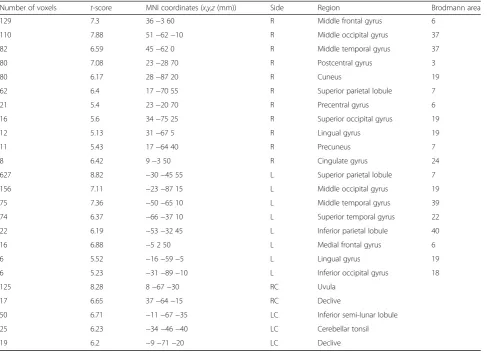
The brain regions activated during driving only condi-tion were subtracted from the regions that were acti-vated during driving with sub-task condition. These results are presented in Table 5 and Fig. 4a. The results show that brain activation is increased in the frontal re-gion (MFG, medial frontal gyrus (MeFG), and precentral gyrus), parietal region (SPL, IPL, postcentral gyrus, and precuneus), temporal region (MTG and STG), occipital region (IOG, SOG, MOG, lingual gyrus, and cuneus), limbic region (cingulate gyrus), and the cerebellum (uvula, declive, inferior semi-lunar lobule, and cerebellar tonsil). In particular, we observed a large increase in the Table 1Mean ± S.D. of the accuracy rate [%] results by every
subject
Subject Driving with sub-task condition Sub-task only condition
#1 62.67 77.00
#2 84.67 74.28
#3 76.33 91.33
#4 88.00 90.67
#5 87.33 93.33
#6 89.00 94.45
#7 93.33 91.87
#8 70.00 58.23
#9 58.67 95.23
#10 63.88 90.52
#11 72.28 89.24
#12 85.74 94.11
#13 89.67 70.00
#14 64.56 73.25
#15 91.67 88.67
superior parietal lobule. Large increases were also seen in the middle frontal gyrus, the middle occipital gyrus, and the uvula of the cerebellum. These regions corres-pond to those that have reduced or no activation when driving is performed along with secondary activities.
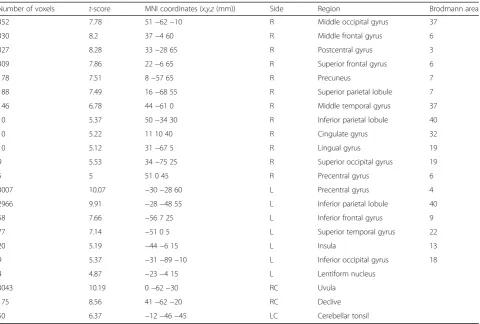
To determine the activated brain regions during driv-ing with sub-task condition, the regional activation dur-ing drivdur-ing with sub-task condition is subtracted from the activation during driving only condition. These re-sults are summarized in Table 6 and Fig. 4b. The rere-sults Table 2The MNI coordinates,t-scores, and number of voxels in the activated areas by the subtraction
Number of voxels t-score MNI coordinates (x,y,z(mm)) Side Region Brodmann area
352 7.78 51−62−10 R Middle occipital gyrus 37
330 8.2 37−4 60 R Middle frontal gyrus 6
327 8.28 33−28 65 R Postcentral gyrus 3
309 7.86 22−6 65 R Superior frontal gyrus 6
178 7.51 8−57 65 R Precuneus 7
188 7.49 16−68 55 R Superior parietal lobule 7
146 6.78 44−61 0 R Middle temporal gyrus 37
10 5.37 50−34 30 R Inferior parietal lobule 40
10 5.22 11 10 40 R Cingulate gyrus 32
10 5.12 31−67 5 R Lingual gyrus 19
9 5.53 34−75 25 R Superior occipital gyrus 19
5 5 51 0 45 R Precentral gyrus 6
3007 10.07 −30−28 60 L Precentral gyrus 4
2966 9.91 −28−48 55 L Inferior parietal lobule 40
58 7.66 −56 7 25 L Inferior frontal gyrus 9
77 7.14 −51 0 5 L Superior temporal gyrus 22
20 5.19 −44−6 15 L Insula 13
9 5.37 −31−89−10 L Inferior occipital gyrus 18
4 4.87 −23−4 15 L Lentiform nucleus
3043 10.19 0−62−30 RC Uvula
175 8.56 41−62−20 RC Declive
50 6.37 −12−46−45 LC Cerebellar tonsil
Method (driving only condition—control) (correctedp <0.05)
Rright cerebrum,Lleft cerebrum,RCright cerebellum,LCleft cerebellum
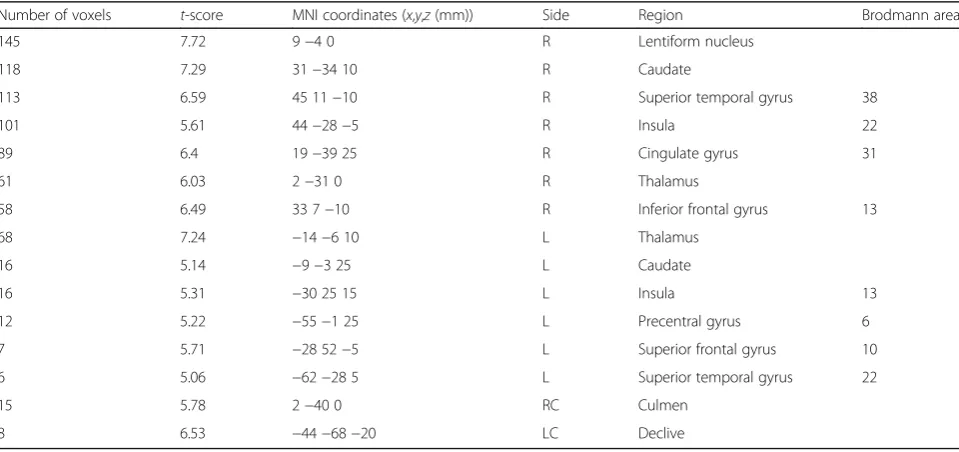
indicate an increased activation in the frontal region (IFG, SFG, and precentral gyrus), temporal region (STG), limbic region (cingulate gyrus), sub-lobar region (lentiform nucleus, caudate, insula, and thalamus), and the cerebellum (culmen and declive). In particular, there are large activation increases in the superior temporal gyrus, the cingulate gyrus, the sub-lobar area, which in-cludes the lentiform nucleus, caudate, insula, and thalamus.
Discussion
Here we analyzed the effects of conducting a sub-task (addition task) during driving on brain activation using fMRI.
Notable differences were not observed in the accuracy rates sub-task only condition vs. driving with sub-task condition. It was expected that all of the experiment par-ticipants would show a higher task performance ability in the sub-task only condition rather than the driving with sub-task condition. Of the total of 15 participants,
however, three showed opposite results. Before the ex-periment, all of the participants were requested to con-centrate on the experiment (driving, task performance, etc.). But the three participants are deemed to have low concentration during their task performance in the sub-task only condition to show such a low accuracy. Add-itional study will be necessary in this regard.
Brain activation during driving situations has con-sistently been the subject of ongoing research [3–17]. Just et al. [9] used a computer mouse and trackball to simulate driving and reported that the parietal cor-tex, occipital corcor-tex, motor corcor-tex, and the cerebel-lum exhibit activation during this task. Uchiyama et al. [15] used a joystick to control the vehicles and ob-served the IFG, MFG, SFG, IPL, SPL, MTG, basal ganglia, primary sensorimotor cortex (S1), and SMA. Hsieh et al. [7] noted that while a driving scene is simply being observed, the MFG, IFG, STG, orbito-frontal cortex, occipital lobe, fusiform gyrus, cingulate gyrus, SMA, and the basal ganglia show activation. Table 3The MNI coordinates,t-scores, and number of voxels in the activated areas by the subtraction method (driving with
sub-task condition—control) (correctedp <0.05)
Number of voxels t-score MNI coordinates (x,y,z(mm)) Side Region Brodmann area
1433 8.56 30−32 20 R Insula 13
285 7.72 9−4 0 R Lentiform nucleus
66 6.31 33 5−10 R Inferior frontal gyrus 13
63 5.98 33−26 60 R Precentral gyrus 4
57 6.49 45 11−10 R Superior temporal gyrus 38
55 5.15 45−32 60 R Postcentral gyrus 2
54 5.24 34−4−5 R Claustrum
46 5.17 9−25 20 R Thalamus
14 5.38 22 7 30 R Cingulate gyrus 32
12 5.69 25−82 10 R Cuneus 17
11 5.87 50−40−10 R Fusiform gyrus 37
1879 9.1 −28−31 60 L Postcentral gyrus 3
1791 8.72 −31−40 25 L Insula 13
156 7.95 −55 3 30 L Precentral gyrus 6
59 5.66 −50−1 5 L Superior temporal gyrus 22
32 5.81 −11−84−10 L Lingual gyrus 18
32 5.57 −28 19 10 L Claustrum
27 5.76 −42−76−5 L Inferior occipital gyrus 19
24 5.41 −30 38 30 L Middle frontal gyrus 9
20 5.93 −20−81 25 L Cuneus 18
19 5.09 −9−3 25 L Caudate
8 5.36 −28 53−5 L Superior frontal gyrus 10
6 4.85 −25−6 55 L Sub-gyral 6
8 5.35 28−36−40 RC Cerebellar tonsil
1908 9.46 0−59−35 LC Inferior semi-lunar lobule
The results that we obtained during driving only con-dition show similar areas of activation (motor cortex, IPL, SPL, fusiform gyrus, and cerebellum; Table 2) to those observed in previous research. Previous studies [7, 9, 15] simulated driving using a computer mouse or trackballs. In these studies, one hand was used in the simulator environment. However, in this study, the subjects controlled a driving wheel using both hands in a real driving environment and controlled pedals using the ankle of the right lower limb. Be-cause of the movement of both the hands and the right foot, the left precentral gyrus (primary motor cortex, M1) appeared to have the voxels with the highest activation. We also observed activation of the motor control-related right premotor cortex, which is used in adjusting precise movements [5, 13]. Since tactile sensory feedback is also generated through the wheel and the pedals, the right postcentral gyrus (S1) was activated [15, 19]. The activation of the somatosen-sory association cortex in the left IPL (BA 40) at the supramarginal gyrus [19] was especially great. In addition, we observed activations of the right precuneus area, which is related to visuomotor coordination [5, 12], and the right fusiform gyrus (BA 37), which is related to high-level vis-ual cognition [7]. We also observed a larger number of ac-tivation voxels in the uvula of cerebellum, which is an area related to motor control and action planning [3, 4, 15].
When driving and a secondary task (auditory language comprehension task) were performed simultaneously, similar areas (motor cortex and the parietal and occipital lobes) were activated. This is similar to what is observed when only driving is performed. However, the numbers of activation voxels and activity intensity was decreased in these areas while the temporal and inferior frontal re-gions related to the sub-task had increases in activation [9]. Uchiyama et al. [15] observed the activation of simi-lar areas (motor cortex and parietal and occipital lobes) when driving was performed along with an auditory task. However, they also reported activation of the STG and the primary auditory cortex. We observed that similar regions (motor cortex, SPG, IPG, and MOG) were acti-vated to those actiacti-vated when the subjects only drove (Table 3). However, the numbers of activation voxels of these regions were decreased and the IFG and STG, which are related to the addition task showed activation. The IFG was noted as an area significantly associated with the performance of additional tasks in previous re-search [20, 21]. Here, the same areas were activated dur-ing drivdur-ing with sub-task condition and sub-task only condition (Tables 3 and 4). The additional activation of the STG is thought to occur because the experiment used in the study required the subjects to listen to and then respond to the additional task (Tables 3 and 4). Un-like in previous studies [9, 15], we observed that the Table 4The MNI coordinates,t-scores, and number of voxels in the activated areas by the subtraction method (sub-task only
condition—control) (correctedp <0.05)
Number of voxels t-score MNI coordinates (x,y,z(mm)) Side Region Brodmann area
200 5.64 42 46−5 R Middle frontal gyrus 10
192 4.41 36 21 10 R Insula 13
174 5.08 58 30 10 R Inferior frontal gyrus 46
154 5.36 16 3−5 R Lentiform nucleus
45 3.75 22−34 30 R Cingulate gyrus 31
26 3.94 61−7−5 R Middle temporal gyrus 21
26 3.55 48−43 60 R Inferior parietal lobule 40
12 3.61 55 8 5 R Precentral gyrus 44
11 3.26 59 7−5 R Superior temporal gyrus 22
6 3.66 17 7 70 R Superior frontal gyrus 6
112 4.46 −31 41 25 L Middle frontal gyrus 10
48 4.22 −59 5 20 L Precentral gyrus 6
23 4.07 −30−37 5 L Caudate
20 3.82 −51−54−5 L Inferior temporal gyrus 37
7 3.28 −9−3 65 L Superior frontal gyrus 6
23 3.97 0−61−30 RC Uvula
12 3.72 2−45−5 RC Culmen
109 4.85 −5−70−15 LC Declive
11 3.4 −34−71−25 LC Uvula
number of activation voxels in the postcentral gyrus (S1) and the insular cortex appeared high in driving with sub-task condition. Unlike previous studies, where a joystick, computer mouse, or trackball was used with one hand, our study required the subjects to adjust a driving wheel with both hands and pedals with the right foot. The grip force of both hands required to hold the driving wheel to concentrate (lane keeping) on driving increased when driving with sub-task con-dition compared to driving only condition. In addition, the right foot touched the pedal more fre-quently to keep the speed at 80 km/h. Thus, the left postcentral gyrus area, which is the somatosensory area [19, 22], is expected to be activated significantly. In addition, when driving is performed simultaneously with a sub-task, hand movements were used to finely control the wheel in order to maintain the lane. These movements and those of the right ankle use for controlling the pedal to keep the speed at 80 km/h were more frequent. Thus, activation of the insula, which is re-lated to perception, motor control, self-awareness, and
cognitive function [23], was shown to be significantly in-creased in both hemispheres.
Just et al. [9] used the double subtraction method to analyze differences in brain activation while driving and driving while performing a secondary task (an auditory language comprehension task). When drivers were fo-cused only on driving, compared to when they drove while performing an auditory distraction task of lan-guage comprehension, the supramarginal gyrus, SPL, IPL, and SOG showed increased activation. In particular, activation voxels of the SPL had the largest increase. Based on our results, when drivers were focused only on driving compared to when they drove while performing a task, the SPL and IPL areas, which are related to spatial perception [24], showed increased activation, similar to observations in previous studies. The visuo-motor coordination-related left SPL [5, 12] showed the largest increase.
When drivers were focused only on driving compared to when they drove while performing a task, activation is thought to have increased in the above areas because the Table 5The MNI coordinates,t-scores, and number of voxels in the activated areas by the double subtraction method (driving only
condition—driving with sub-task condition) (correctedp <0.05)
Number of voxels t-score MNI coordinates (x,y,z(mm)) Side Region Brodmann area
129 7.3 36−3 60 R Middle frontal gyrus 6
110 7.88 51−62−10 R Middle occipital gyrus 37
82 6.59 45−62 0 R Middle temporal gyrus 37
80 7.08 23−28 70 R Postcentral gyrus 3
80 6.17 28−87 20 R Cuneus 19
62 6.4 17−70 55 R Superior parietal lobule 7
21 5.4 23−20 70 R Precentral gyrus 6
16 5.6 34−75 25 R Superior occipital gyrus 19
12 5.13 31−67 5 R Lingual gyrus 19
11 5.43 17−64 40 R Precuneus 7
8 6.42 9−3 50 R Cingulate gyrus 24
627 8.82 −30−45 55 L Superior parietal lobule 7
156 7.11 −23−87 15 L Middle occipital gyrus 19
75 7.36 −50−65 10 L Middle temporal gyrus 39
74 6.37 −66−37 10 L Superior temporal gyrus 22
22 6.19 −53−32 45 L Inferior parietal lobule 40
16 6.88 −5 2 50 L Medial frontal gyrus 6
6 5.52 −16−59−5 L Lingual gyrus 19
6 5.23 −31−89−10 L Inferior occipital gyrus 18
125 8.28 8−67−30 RC Uvula
17 6.65 37−64−15 RC Declive
50 6.71 −11−67−35 LC Inferior semi-lunar lobule
25 6.23 −34−46−40 LC Cerebellar tonsil
19 6.2 −9−71−20 LC Declive
subjects were focused only on driving while controlling the wheel with both hands and controlling the pedals with their right foot. The parietal area is in charge of not only spatial processing but also visual spatial attention [24]. Thus, it has been determined that secondary activ-ities negatively affect functions related to driving. Unlike previous studies [9], our study indicates that when
drivers are focused driving only condition compared to driving with sub-task condition, the right MFG, which is the premotor cortex area related to spatial attention, move-ment planning, and execution [5, 13], the visual-related right and left MOG [3], and the action planning and motor control-related uvula of the cerebellum [3, 4, 15] show remarkably increased activation (Table 5). The negative
Fig. 4Brain activation areas foradriving only condition—driving with sub-task condition andbdriving with sub-task condition—driving only condition (correctedp< 0.05)
Table 6The MNI coordinates,t-scores, and number of voxels in the activated areas by the double subtraction method (driving with
sub-task condition—driving only condition) (correctedp <0.05)
Number of voxels t-score MNI coordinates (x,y,z(mm)) Side Region Brodmann area
145 7.72 9−4 0 R Lentiform nucleus
118 7.29 31−34 10 R Caudate
113 6.59 45 11−10 R Superior temporal gyrus 38
101 5.61 44−28−5 R Insula 22
89 6.4 19−39 25 R Cingulate gyrus 31
61 6.03 2−31 0 R Thalamus
58 6.49 33 7−10 R Inferior frontal gyrus 13
68 7.24 −14−6 10 L Thalamus
16 5.14 −9−3 25 L Caudate
16 5.31 −30 25 15 L Insula 13
12 5.22 −55−1 25 L Precentral gyrus 6
7 5.71 −28 52−5 L Superior frontal gyrus 10
6 5.06 −62−28 5 L Superior temporal gyrus 22
15 5.78 2−40 0 RC Culmen
8 6.53 −44−68−20 LC Declive
effects on these areas are thought to occur because per-forming sub-tasks interferes with information processing during driving.
Compared to cases where only driving was performed, driving while performing additional tasks was shown to decrease brain activation in some regions, whereas other regions related to activity completion were additionally activated [7, 9, 15]. We observed that driving with sub-task condition was performed compared to driving only condition, the SPL, MFG, MOG, and cerebellar regions related to driving had less activation (Table 5). In con-trast, there was increased activation in the IFG and the STG, which affect secondary task completion (Tables 3, 4, and 6). The cingulate gyrus region and the sub-lobar region (lentiform nucleus, caudate, insula, and thalamus) in particular showed evidence of increased activation (Table 6). These results can be attributed to the fact that when driving is paired with a secondary task, driving performance is affected. Moreover, the in-crease in desire to control inin-creases the activation of the cingulate gyrus and sub-lobar regions, as they control error monitoring and unnecessary movement control, respectively [5, 13, 23, 25]. In addition, during driving with sub-task condition, we observed activation of the right temporal gyrus (BA 38) region, which is related to highly processed perceptual inputs to visceral re-sponses, for complex cognitive processing [7, 15].
Limitation
Although not performed in this study, it is necessary to analyze the relationship between actual driving perform-ance and brain activity by additionally extracting the ac-tivation patterns for a variety of driving performance conditions (maintaining driving speed, responding to un-certainties during driving, lane keeping, etc.) when driv-ing and the sub-task are performed simultaneously. We would then carry out a study on how the sub-task affects actual driving performance.
Conclusions
In conclusion, when driving and a sub-task were per-formed together (driving with sub-task condition— driv-ing only condition), the regions associated with drivdriv-ing show less activation, as observed in previous studies. In particular, the spatial perception regions have the largest decreases among all the regions assessed. Unlike in pre-vious research [7, 9, 15], our double subtraction results (driving with sub-task condition—driving only condi-tion) indicate a clear increase in activation in the cingu-late gyrus and the sub-lobar region. Unlike the simple driving simulators used in previous research, which used joysticks, computer mouses, or trackballs for simulation, the addition of a driving wheel and pedals (accelerator and brake) to the driving simulator used in this study
closely represents real driving. Thus, the number of processed movements increases, leading to an increased number of unnecessary movements that need to be con-trolled. This in turn increases the activation of the corre-sponding brain regions.
There are numerous research studies investigating brain activation changes using simple driving simulators equipped with joysticks, computer mouses, or trackballs. However, research studies similar to ours, which em-ploys a simulator that closely reflects reality, have been sparse in comparison. Further research on the effects of sub-tasks on brain activation of drivers of varied driving skills is required. This paper is expected to contribute basic data toward studying the effects of sub-tasks dur-ing drivdur-ing.
Acknowledgements
This research was supported by the Pioneer Research Center Program through the National Research Foundation of Korea funded by the Ministry of Science, ICT & Future Planning (2011-0027920).
Authors’contributions
CMH, YHJ, and CSC conceived and designed the experiments. CMH, LJC, BJH, and CJS performed the experiments. CMH and BJH analyzed the data. KHS and LDW contributed reagents/materials/analysis tools. CMH, TGR, MBC, and CSC wrote the paper. CMH and CSC drafted the article or revised it critically for important intellectual content. All authors read and approved the final manuscript.
Competing interests
The authors declare that they have no competing interests.
Author details 1
Department of Biomedical Engineering, Research Institute of Biomedical Engineering, College of Biomedical & Health Science, Konkuk University, Chungju, South Korea.2Department of Industrial and Management Engineering, Hanbat National University, Daejeon, South Korea.3Department
of Information & Communication Engineering, Dongguk University, Seoul, South Korea.
Received: 30 November 2015 Accepted: 18 January 2017
References
1. Groeger JA. Understanding driving: applying cognitive psychology to a complex everyday task. New York: Psychology Press; 2000.
2. Michon JA. Explanatory pitfalls and rule-based driver models. Accid Anal Prev. 1989;21:341–53.
3. Calhoun VD, Pekar JJ, McGinty VB, Adali T, Watson TD, Pearlson GD. Different activation dynamics in multiple neural systems during simulated driving. Hum Brain Mapp. 2002;16:158–67.
4. Campagne A, Pebayle T, Muzet A. Correlation between driving errors and vigilance level: influence of the driver’s age. Physiol Behav. 2004;80:515–24. 5. Graydon FX, Young R, Benton MD, Genik II RJ, Posse S, Hsieh L, Green C.
Visual event detection during simulated driving: identifying the neural correlates with functional neuroimaging. Transport Res Part F: Traffic Psychol Behav. 2004;7:271–86.
6. Horikawa E, Okamura N, Tashiro M, Sakurada Y, Maruyama M, Arai H, Yamaguchi K, Sasaki H, Yanai K, Itoh M. The neural correlates of driving performance identified using positron emission tomography. Brain Cogn. 2005;58:166–71.
8. Just MA, Carpenter PA, Keller TA, Emery L, Zajac H, Thulborn KR.
Interdependence of nonoverlapping cortical systems in dual cognitive tasks. Neuro Image. 2001;14:417–26.
9. Just MA, Keller TA, Cynkar J. A decrease in brain activation associated with driving when listening to someone speak. Brain Res. 2008;1205:70–80. 10. Mader M, Bresges A, Topal R, Busse A, Forsting M, Gizewski ER. Simulated
car driving in fMRI-cerebral activation patterns driving an unfamiliar and a familiar route. Neurosci Lett. 2009;464:222–7.
11. Newman SD, Keller TA, Just MA. Volitional control of attention and brain activation in dual task performance. Hum Brain Mapp. 2007;28:109–17. 12. Spiers HJ, Maguire EA. Neural substrates of driving behaviour. NeuroImage.
2007;36:245-55.
13. Tomasi D, Ernst T, Caparelli EC, Chang L. Practice-induced changes of brain function during visual attention: a parametric fMRI study at 4 Tesla. Neuro Image. 2004;23:1414–21.
14. Uchiyama Y, Ebe K, Kozato A, Okada T, Sadato N. The neural substrates of driving at a safe distance: a functional MRI study. Neurosci Lett. 2003;352: 199–202.
15. Uchiyama Y, Toyoda H, Sakai H, Shin D, Ebe K, Sadato N. Suppression of brain activity related to a car-following task with an auditory task: an fMRI study. Transport Res Part F: Traffic Psychol Behav. 2012;15:25–37. 16. Walter H, Vetter SC, Grothe J, Wunderlich AP, Hahn S, Spitzer M. The neural
correlates of driving. NeuroReport. 2001;12:1763–7.
17. Young RA, Hsieh L, Graydon FX, Genik II RJ, Benton MD, Green CC, Bowyer SM, Moran JE, Tepley N. Mind-on-the-Drive: real-time functional neuroimaging of cognitive brain mechanisms underlying driver performance and distraction. Human factors in driving, telematics and seating comfort. Warrendale: Society of Automotive Engineering; 2005. p. SP-1934.
18. Oldfield RC. The assessment and analysis of handedness: the Edinburgh inventory. Neuropsychologia. 1971;9:97–113.
19. Ehrsson HH, Fagergren E, Forssberg H. Differential fronto-parietal activation depending on force used in a precision grip task: an fMRI study. J Neurophysiol. 2001;85:2613–23.
20. Fehr T, Code C, Herrmann M. Auditory task presentation reveals predominantly right hemispheric fMRI activation patterns during mental calculation. Neurosci Lett. 2008;431:39–44.
21. Kawashima R, Taira M, Okita K, Inoue K, Tajima N, Yoshida H, Sasaki T, Sugiura M, Watanabe J, Fukuda H. A functional MRI study of simple arithmetic–a comparison between children and adults. Cogn Brain Res. 2004;18:227–33.
22. Ehrsson HH, Fagergren A, Jonsson T, Westling G, Johansson RS, Forssberg H. Cortical activity in precision-versus power- grip tasks: an fMRI study. J Neurophysiol. 2000;83:528–36.
23. Flynn FG, Benson DF, Ardila A. Anatomy of the insula: functional and clinical correlates. Aphasiology. 1999;13:55–78.
24. Rushworth MFS, Paus T, Sipila PK. Attention systems and the organization of the human parietal cortex. J Neurosci. 2001;21:5262–71.
25. Menon V, Adleman NE, White CD, Glover GH, Reiss AL. Error-related brain activation during a Go/NoGo response inhibition task. Hum Brain Mapp. 2001;12:131–43.
• We accept pre-submission inquiries
• Our selector tool helps you to find the most relevant journal • We provide round the clock customer support
• Convenient online submission • Thorough peer review
• Inclusion in PubMed and all major indexing services • Maximum visibility for your research
Submit your manuscript at www.biomedcentral.com/submit
![Table 1 Mean ± S.D. of the accuracy rate [%] results by everysubject](https://thumb-us.123doks.com/thumbv2/123dok_us/9044577.1897113/5.595.57.291.493.731/table-mean-s-d-accuracy-rate-results-everysubject.webp)