R E S E A R C H A R T I C L E
Open Access
An approach to select linear regression
model in bioanalytical method validation
Sandeep S. Sonawane
*, Santosh S. Chhajed, Sana S. Attar and Sanjay J. Kshirsagar
Abstract
Background:The accuracy of any bioanalytical method depends on the selection of an appropriate calibration model. The most commonly used calibration model is the unweighted linear regression, where the response (y-axis) is plotted against the corresponding concentration (x-axis). The degree of association between these two variables is expressed in terms of correlation coefficient (r2). However, the satisfactoryr2alone is not adequate to accept the calibration model. The wide calibration curve range used in the bioanalytical methods is susceptible to the heteroscedasticity of the calibration curve data. The use of weighted linear regression with an appropriate weighting factor reduces the heteroscedasticity and improves the accuracy over the selected concentration range.
Methods:The present work describes a rapid and simple RP-HPLC method for the estimation of chlorthalidone in spiked human plasma. The calibration curve standards were studied in the concentration range of 100–3200 ng/mL. The chromatography was performed on a C18 column (250 × 4.6 mm, 5μm) in an isocratic mode at a flow rate of 1 mL/min using methanol:water (60:40%,v/v) as a mobile phase. The detection was carried out at 276 nm. Both the unweighted regression model and weighted regression models with different weighting factors (1/x, 1/√x, and 1/x2) were evaluated for heteroscedasticity. The statistical approach for the selection of a suitable regression model with appropriate weighting factors was discussed and the developed bioanalytical method was further validated, as per US-FDA guidelines.
Results:In calibration curve experiments, although the acceptable r2 of 0.998 was obtained, the % residual plot showed that the data were susceptible to heteroscedasticity. When the weighted linear regression was applied to the same calibration curve data set, no significant difference between % relative residual (% RR) was observed. Furthermore, when % relative error (% RE) was calculated for different weighting factors, it was
observed that the regression model with 1/x weighting factor gave a minimum % RE. The calibration curve
was found to be linear in the range of 100 to 3200 ng/mL. The validation experiments proved good accuracy, and intra- and inter-day variability and acceptable recovery. Stability studies proved that the drug was stable under tested stability cycles.
Conclusions:From the statistical reports obtained from the present work, it was observed that the calibration curve in bioanalytical experiments was susceptible to heteroscedasticity using the unweighted linear regression model. Hence, to obtain homoscedasticity in the calibration curve experiments, there is a need for a weighted linear regression model. The appropriate regression model was further selected by evaluating the % RE for different weighting factors.
Keywords: Bioanalytical method validation, Linear regression model, Homoscedasticity, Weighting factor, HPLC, Chlorthalidone
* Correspondence:[email protected]
MET’s Institute of Pharmacy, MET League of Colleges, Bhujbal Knowledge City, Adgaon, Nashik, Maharashtra 422 003, India
pendent variable). The relationship is established asy = bx
+ afor the obtained calibration curve, wherebis the slope and a is the intercept. This simple method is called the method of least squares and is the most commonly used regression model (Kimanani1998).
The concentrations used to generate a calibration curve are the calibration curve standards with known concentrations. The degree of association betweenyand
x variables is expressed in terms of correlation coeffi-cient (r2) and is considered acceptable for anr2greater than 0.99. The unknown samples are typically evaluated using the regression results obtained from the calibra-tion curve. However, the correlacalibra-tion coefficient value is not always sufficient to accept the linear regression model. Usually, in bioanalytical experiments, when drug concentrations are evaluated in a wide concentration range, the heteroscedasticity of the data is expected, where the variance increases with rising concentrations. Therefore, despite the acceptable correlation coefficient, the use of unweighted linear regression for the calibra-tion curve experiment with heteroscedasticity will gener-ate inaccurgener-ate analytical results, especially at a lower concentration range (Boulanger et al.2003).
To handle this situation, two approaches were used; the use of weighted linear regression and the use of
polynomial equations (Nakov et al. 2014, Korany et al.
2013). The latter is only applied in the case of non-linear or curved data sets, where the quadratic regressiony=a + bx + cx2is the most preferable. However, higher order polynomial equations greater than quadratic are gener-ally not preferred (Singtoroj et al. 2006). The data set generated in the bioanalytical method is linear and,
weighted linear regression. The choice of weighting fac-tor in the weighted linear regression evaluated in the pre-validation stage is based on evaluating the % relative error (% RE) and the calibration model on the test of ho-moscedasticity (Almeida et al.2002).
The % RE is calculated for each calibration standard as follows:
%RE¼CðfoundÞ−C nomð ÞÞ
C nomð Þ 100
where C (found) is the back-calculated concentration andC(nom) is the nominal concentration of the calibra-tion standard. The most suitable weighting factor is the one that gives the minimum total % RE.
The test of homoscedasticity was performed by plot-ting % relative residual (% RR) vs. concentration and by applying theFtest as follows:
F expð Þ ¼s22 s12
whereF(exp) is the experimentalFvalue expressed as a ratio of variance obtained at the lowest concentration level (s12) and at the highest concentration level (s22) of the working range. TheF (exp) is compared with the F (tab), which is obtained from theF-table at a confidence level of 99% forf1=f2= (n–1) degrees of freedom. The test of homoscedasticity is accepted forF(exp) <F(tab). In this case, the variance is constant over the entire cali-bration range and the residual will fall randomly around thex-axis.
The objective of this work was to discuss a statistical approach for the selection of linear regression model during bioanalytical method development. The proposed approach was based on the study of heteroscedasticity for the calibration data by using the unweighted regres-sion model and to suggest the need for a weighted
re-gression model to reduce heteroscedasticity. The
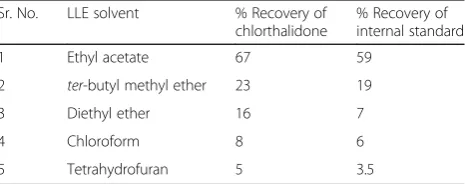
proposed work also elaborates the selection of weighting factor in weighted linear regression, the choice of optimum regression model using total % RE, and a test of homoscedasticity for the given calibration data set. Chlorthalidone was used as a model drug in this study. Table 1% Recovery of chlorthalidone and internal standard in
different LLE solvents
Sr. No. LLE solvent % Recovery of chlorthalidone
% Recovery of internal standard
1 Ethyl acetate 67 59
2 ter-butyl methyl ether 23 19
3 Diethyl ether 16 7
4 Chloroform 8 6
The drug was extracted from spiked human plasma using a liquid-liquid extraction technique and estimated using the RP-HPLC method.
Chemically, chlorthalidone is 2-chloro-5-(2,3-dihydro-1-hydroxy-3-oxo-1H-isoindol-1-yl) benzene sulfonamide (O’Neil et al. 2006), a diuretic agent used in the treat-ment of hypertension and renal disorders. Several ana-lytical methods have been described for the estimation of chlorthalidone in biological fluids (Dadgar and Kelly
1988) and chlorthalidone in combination with other an-tihypertensive agents (Giachetti et al.1997; Khuroo et al.
2008; El-Gindy et al. 2008; Gonzalez et al. 2010;
Elgawish et al. 2011; Mhaske et al. 2012; Belal et al.
2012; Ramakrishna et al. 2015; Shah et al.2016; Patel et al.2017; Aruna et al.2017).
Experimental
Materials and methods
The working standards of chlorthalidone and guaifenesin (used as an internal measure) were obtained as a gift sam-ple from Glenmark Pharmaceuticals Ltd., Nashik. Human plasma samples were procured as a gift sample from
NDMVP’s Dr. Vasantrao Pawar Medical College, Hospital
and Research Centre, Nashik and pooled plasma was pre-pared by thoroughly mixing plasma from six different sources. HPLC grade methanol was purchased from s d fine-chem Ltd., Mumbai. Double-distilled water used was prepared freshly using the All Glass Double Distillation Assembly, purchased from Borosil India Pvt. Ltd., Mum-bai and filtered through a Durapore membrane filter
(0.45μm × 47 mm), purchased from Axiva Scichem
Bio-tech, New Delhi.
The HPLC system consisted of two pumps PU-2080
plus (JASCO Corporation, Japan) fitted with a 100 μL
Rheodyne Loop injector (7725i) and LC-Net II/ADC
sys-tem control. Detection was carried out on a UV-2075 detector (JASCO Corporation, Japan) and the data ac-quisition was performed using BORWIN chromatog-raphy software (Version1.50).
All chromatographic separations were carried out on a Phenomenex Kinetex C18 column (250 ×
4.6 mm, 5 μm) using a mobile phase consisting of
methanol:water (60:40%, v/v) in an isocratic mode at
a flow rate of 1 mL/min. All eluents were detected at 276 nm.
Preparation of standard stock solution and working standard solutions
The standard stock solution of 1000μg/mL of
chlortha-lidone and guaifenesin (internal standard) was prepared by dissolving 10 mg of chlorthalidone and guaifenesin in separate 10 mL volumetric flasks using methanol.
Furthermore, the above-prepared standard stock solu-tion of chlorthalidone was appropriately diluted with a methanol to get working standard solutions of concen-trations of 1, 2, 4, 8, 16, and 32 μg/mL. Likewise, the standard stock solution of the internal standard was ap-propriately diluted with methanol to obtain a working standard solution of 20μg/mL.
Fig. 1Calibration curve and residual plot of chlorthalidone, make the correction of x-axis title of linearity Conc (ug/mL) (symbolic microgram per mL)
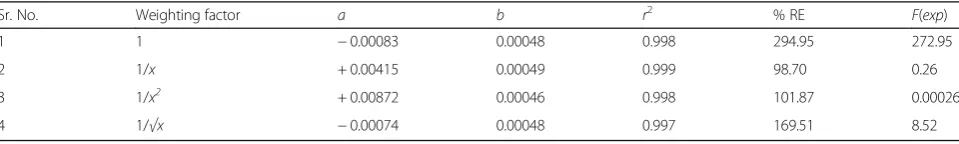
Table 3Regression parameters for unweighted and weighted regression with different weighting factors
Sr. No. Weighting factor a b r2 % RE F(exp)
1 1 −0.00083 0.00048 0.998 294.95 272.95
2 1/x + 0.00415 0.00049 0.999 98.70 0.26
3 1/x2 + 0.00872 0.00046 0.998 101.87 0.00026
4 1/√x −0.00074 0.00048 0.997 169.51 8.52
Aliquots of 1 mL of pooled blank plasma were taken in stoppered glass tubes of 20 mL capacity. To these tubes,
125μL of working standard solutions was added
appro-priately to get a six-point calibration curve (CC) of stan-dards of chlorthalidone with concentrations of 0.1, 0.2, 0.4, 0.8, 1.6, and 3.2μg/mL, respectively. In each calibra-tion curve standard solucalibra-tion, 125μL of 20μg/mL work-ing standard solution of internal standard was added and vortex-mixed for 5 min.
Similarly, the quality control (QC) samples were pre-pared, which consist of a lower limit of quantitation (LLOQ), lower quality control concentration (LQC), middle quality control concentration (MQC), and higher quality control sample (HQC). All QC samples were an-alyzed in five replicates for each QC level.
Liquid-liquid extraction experiments
An aliquot of 1 mL of blank human plasma was re-moved in a 20 mL stoppered glass tube and spiked with 125 μL of 100μg/mL methanolic solution of
chlorthali-done and 125 μL of 20 μg/mL methanolic solution
in-ternal standard. This mixture was vortex-mixed for 5 min. Furthermore, 5 mL aliquots of liquid-liquid ex-traction (LLE) solvent were added to each stoppered
In calibration runs, all CC standards were analyzed in six replicates using an optimized LLE experiment and chromatographic conditions.
At the end of calibration runs, the chromatograms of CC standards were processed to obtain the peak areas for chlorthalidone and the internal standard. For each CC standard, the area ratio of chlorthalidone to internal standard was calculated and the six-point calibration curve was constructed from the peak area ratio vs. re-spective concentration of CC standard.
The CC standard data were studied using unweighted linear regression and weighted linear regression with a weighting factor of 1/x, 1/√x, and1/x2. The data analysis was carried out using Microsoft ® Excel ® 2016 MSO (64-bit).
Validation
The developed method was validated as per the Guid-ance for Industry: Bioanalytical Method Validation (FDA and Food and Drug Administration, May 2018). Selectiv-ity was studied at the lower limit of quantification (LLOQ) of 100 ng/mL by comparing blank responses of plasma from six different sources with peak areas
afforded by the LLOQ samples. Accuracy was estimated as the mean % RE while the precision was measured in terms of % relative standard deviation (% RSD). The re-covery of the extraction procedure was calculated by comparing the peak areas of the processed QC samples to those of corresponding standard dilutions. The stabil-ity of chlorthalidone in human plasma samples was
eval-uated under various conditions viz. three freeze–thaw
cycles, stability at −20 °C for 30 days, and stability at room temperature. The amount of drug in the stability samples was determined and the % nominal and % RSD in each case was calculated.
Results and discussion
Selection of optimum chromatographic conditions Different mobile phases were attempted to find an ad-equate retention and resolution of chlorthalidone from plasma interferents and from the internal standard. Ac-ceptable system suitability with respect to the tailing, number of theoretical plates, and resolution was
ob-tained on a C18 column (250 × 4.6 mm, 5 μm) when a
mobile phase consisting of methanol:water (60:40, %v/v) was used at a flow rate of 1 mL/min. Chlorthalidone was eluted at 6.825 min which was adequately resolved from the guaifenesin (internal standard) (RT= 7.875 min) and
from the plasma interferents. All eluents were detected at a wavelength of 276 nm.
Selection of calibration curve standard and QC sample concentrations
The calibration curve (CC) standard range and the con-centrations of QC samples (LLOQ, LQC, MQC, and HQC) were selected as per the Guidance for Industry: Bioanalytical Method Validation (FDA and Food and
Drug Administration 2018). The CC standards were
chosen to determine the calibration curve range and were prepared by spiking the pooled blank plasma with increasing concentrations of drugs. Generally, the
cali-bration curve range should cover 10% of the Cmax to
twice theCmaxof the drug. Considering the 25 mg tablet
of chlorthalidone with a Cmax of 1.5 μg/mL (Hygriton
Chlorthalidone 25 mg tablets, n.d.), the CC standard
range was selected to be 0.1μg/mL to 32μg/mL. The LLOQ is the lower amount of an analyte in a sample that can be quantitatively determined with suit-able precision and accuracy. The concentration of LLOQ should be 10% of the Cmax of the drug and is the first
level of the CC standard. Hence, for the present work, 100 ng/mL was selected.
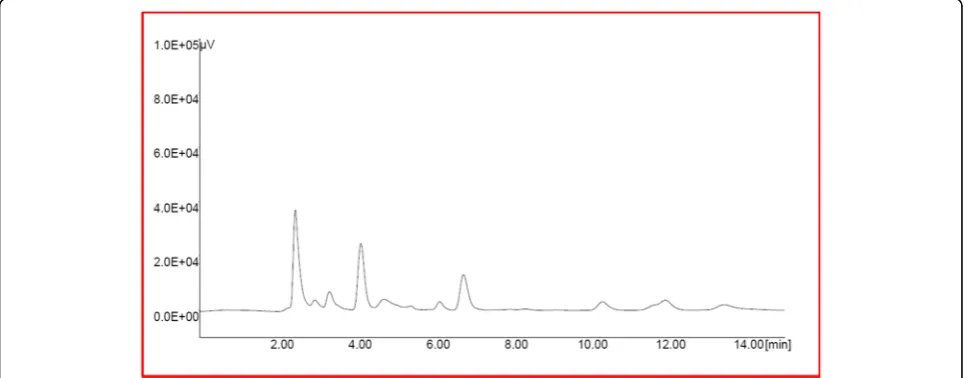
The QC samples were prepared at three levels by spik-ing the drug in plasma to get the LQC (three times of Fig. 3Representative chromatogram of MCQ sample of chlorthalidone (RT= 6.825 min) and internal standard (RT= 7.785 min)
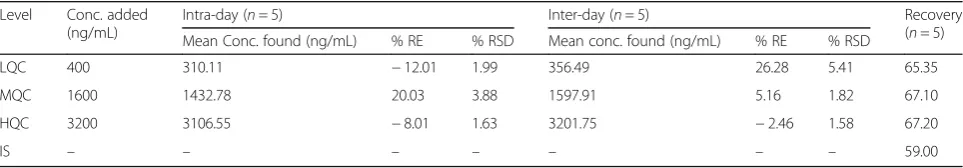
Table 5Results of accuracy and precision studies
Level Conc. added (ng/mL)
Intra-day (n= 5) Inter-day (n= 5) Recovery
(n= 5) Mean Conc. found (ng/mL) % RE % RSD Mean conc. found (ng/mL) % RE % RSD
LQC 400 310.11 −12.01 1.99 356.49 26.28 5.41 65.35
MQC 1600 1432.78 20.03 3.88 1597.91 5.16 1.82 67.10
HQC 3200 3106.55 −8.01 1.63 3201.75 −2.46 1.58 67.20
Optimization of liquid-liquid extraction experiments The LLE solvents investigated were ethyl acetate,ter -bu-tyl methyl ether, diethyl ether, chloroform, and tetra-hydrofuran. Good recovery was obtained in ethyl acetate and thus selected for use as an extraction solvent in LLE. The % recovery for chlorthalidone and the internal standard in different organic solvents is shown in Table1.
Calibration curve study and selection of optimal regression model
When the data obtained from the CC standards (Table2)
were subjected to unweighted linear regression, it was found that the % RR for the lowest concentration was 31.20%, compared with 0.18% of the highest concentra-tion (Fig.1). The % RR was calculated as:
%RR¼YðfoundÞ−Y nomð ÞÞ
Y nomð Þ 100
This proved that inaccurate results may be generated when unweighted linear regression is used, even with an
acceptable r2. Also, when the CC standard data of
un-weighted regression were subjected to the test of homo-scedasticity, the F (exp) value found 272.95 which was significantly higher than F (tab) = 5.05 (F5, 5). This
re-vealed that the variance was not evenly distributed over the CC standard range and resulted in heteroscedasti-city. Therefore, from the % RR and from the test of ho-moscedasticity, it can be reasoned that there is a need to apply a weighted regression model for the given calibra-tion data set.
The weighted regression models with a weighting fac-tor of 1/x, 1/√x, and 1/x2 were further constructed on the same calibration data set.
Furthermore, for the selection of the optimal cali-bration model, the weighted linear calicali-bration model
with the minimum % RE and F (exp) was selected.
The regression parameters for unweighted and
weighted regressions with % RE and F value are
pre-sented in Table 3.
was decided to adopt a calibration model of weighted linear regression with a weighting factor of 1/x in the calibration range of 100 ng/mL to 3200 ng/mL.
Validation
From Table 4, it was observed that the peak areas for
LLOQ samples were five times higher than blank re-sponses from the plasma. Thus, it was concluded that the method was selective at an LLOQ of 100 ng/mL.
The chromatogram of blank plasma extract is shown in Fig. 2, which revealed the lack of significant interfer-ence at the retention times of chlorthalidone and the in-ternal standard. The representative chromatogram of MQC sample is presented in Fig.3.
The results of accuracy, precision, and the extraction
recovery are shown in Table 5. It was found that the
intra-day and inter-day % RE was between ± 15% and the % RSD was less than 15%. Hence, this proved the ac-ceptable recovery of chlorthalidone and of the internal standard.
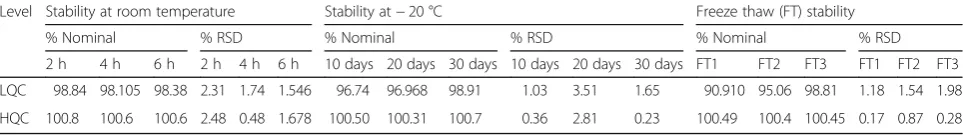
The results of stability studies are shown in Table 6, which showed that the % nominal concentration was be-tween 90 and 98.84% with a % RSD less than 15%. This concluded that the drug remained stable after stability cycles.
Conclusions
In the present work a simple, rapid and accurate RP-HPLC method was described for the estimation of chlorthalidone in spiked human plasma using liquid-li-quid extraction. Also, it was demonstrated that in the
calibration curve experiments using bioanalytical
Abbreviations
% RE:% Relative error; % RR: % Relative residual; % RSD: % Relative standard deviation; CC: Calibration curve; HQC: Higher quality control concentration; LLE: Liquid-liquid; LLOQ: Lower limit of quantitation; LQC: Lower quality control concentration; MQC: Middle quality control concentration; PP: Protein precipitation; QC: Quality control; SPE: Solid-phase extraction
Acknowledgements
Authors are thankful to the Management and Trustees of Mumbai Educational Trust’s Bhujbal Knowledge City, Nashik, for providing necessary chemicals and analytical facilities, Glenmark Pharmaceuticals Ltd., Nashik for providing gift samples of drug and internal standard, to NDMVP’s Dr. Vasantrao Pawar Medical College, Hospital and Research Centre, Nashik, for providing human plasma samples.
Funding
The research work mentioned in this paper is not funded by any funding agency and is financed by institute.
Availability of data and materials
Please contact author for data requests.
Authors’contributions
SS designed the experiments, performed data analysis, and drafted the manuscript. SA performed the experiments and assisted with data analysis. SCS performed the literature survey and assisted in designing the protocol of experiments. SK provided the guidance in designing and drafting the manuscript. All authors of this work read and approved the final manuscript.
Competing interests
The authors declare that they have no competing interests.
Publisher’s Note
Springer Nature remains neutral with regard to jurisdictional claims in published maps and institutional affiliations.
Received: 4 September 2018 Accepted: 26 November 2018
References
Almeida AM, Castel-Branco MM, Falcão AC. Linear regression for calibration lines revisited: weighting schemes for bioanalytical methods. J Chromatogr B Analyt Technol Biomed Life Sci. 2002;774:215–22.
Aruna G, Bharathi K, Prasad K. Development and validation of bioanalytical method for simultaneous estimation of cilnidipine and nebivolol in human plasma. Int J Pharm Pharm Sci. 2017;9(10):253–9.
Belal F, El-Brashy AM, El-Enany N, Tolba MM. Simultaneous determination of celiprolol HCl and chlorthalidone in tablets and biological fluids using high-performance liquid chromatography. Acta Chromatograph. 2012; 24(2):185–206.
Boulanger B, Chiap P, Dewe W, Crommen J, Hubert P. An analysis of the SFSTP guide on validation of chromatographic bioanalytical methods: progresses and limitations. J Pharm Biomed Anal. 2003;32:753–65.
Dadgar D, Kelly MT. Determination of chlorthalidone in human plasma by reversed-phase micellar liquid chromatography. Analyst. 1988;113(8):1223–7. Elgawish MS, Mostafa SM, Elshanawane AA. Simple and rapid HPLC method for
simultaneous determination of atenolol and chlorthalidone in spiked human plasma. Saudi Pharm J. 2011;19:43–9.
El-Gindy A, Sallam S, Abdel-Salam RA. HPLC method for the simultaneous determination of atenolol and chlorthalidone in human breast milk. J Sep Sci. 2008;31:677–82.
Food and Drug Administration (2018) Bioanalytical method validation: guidance for industry, U.S. Department of Health and Human Serviceshttps://www.fda. gov/downloads/drugs/guidances/ucm070107.Pdf. Accessed 15 June 2018. Giachetti C, Tenconi A, Canali S, Zanolo G. Simultaneous determination of
atenolol and chlorthalidone in plasma by high-performance liquid chromatography application to pharmacokinetic studies in man. J Chromatogr B Biomed Sci Appl. 1997;698:187–94.
Gonzalez O, Iriarte G, Rico E, Ferreirós N, Maguregui MI, Alonso RM, Jiménez RM. LC–MS/MS method for the determination of several drugs used in combined
cardiovascular therapy in human plasma. J Chromatogr B Analyt Technol Biomed Life Sci. 2010;878:2685–92.
Hygriton Chlorthalidone 25 mg tablets. (n.d.) http://www.medsafe.govt.nz/profs/ Datasheet/h/Hygrotontab.pdf. Accessed 31 Mar 2018.
Khuroo A, Mishra S, Singh O, Saxena S, Monif T. Simultaneous determination of atenolol and chlorthalidone by LC–MS–MS in human plasma.
Chromatographia. 2008;68:721.
Kimanani EK. Bioanalytical calibration curves: proposal for statistical criteria. J Pharm Biomed Anal. 1998;16:1117–24.
Korany MA, Maher HM, Galal SM, Ragab MA. Comparative study of some robust statistical methods: weighted, parametric, and nonparametric linear regression of HPLC convoluted peak responses using internal standard method in drug bioavailability studies. Anal Bioanal Chem. 2013;405(14): 4835–48.
Mhaske RA, Garole DJ, Mhaske AA, Sahasrabudhe S. RP-HPLC method for simultaneous determination of amlodipine besylate, valsartan, telmisartan, hydrochlorothiazide and chlorthalidone: application to commercially available drug products. Int J Pharmaceut Sci. 2012;3(1):141–9. Nagaraja NV, Paliwal JK, Gupta RC. Choosing the calibration model in assay
validation. J Pharm Biomed Anal. 1999;20:433–8.
Nakov N, Tonic-Ribarska J, Dimitrovska A, Petkovska R. Statistical approach for selection of regression model during validation of bioanalytical method. Maced. pharm. bull. 2014;60(1):19–25.
O’Neil JM, Heckelmen PF, Koch CB, Roman KJ, Kenny CM, D’Arecca MR. The Merck index, an encyclopedia of chemicals, drugs and biologicals, 14th ed. Merck & co, Inc. NJ, USA: Whitehouse station; 2006. p. 2193.
Patel B, Jangid AG, Suhagia BN, Desai N. The simultaneous UPLC–MS/MS determination of emerging drug combination; candesartan and chlorthalidone in human plasma and its application. Biomed Chromatogr. 2017;31(9):e3946.
Ramakrishna R, Kumar Puttrevu S, Bhateria M, Bala V, Sharma VL, Bhatta RS. Simultaneous determination of azilsartan and chlorthalidone in rat and human plasma by liquid chromatography-electrospray tandem mass spectrometry. J Chromatogr B. 2015;990:185–97.
Shah JV, Patel DP, Shah PA, Sanyal M, Shrivastav PS. Simultaneous quantification of atenolol and chlorthalidone in human plasma by ultra-performance liquid chromatography–tandem mass spectrometry. Biomed Chromatogr. 2016; 30(2):208–16.