R E S E A R C H A R T I C L E
Open Access
Unveiling the compatibility of eugenol
with formulation excipients by systematic
drug-excipient compatibility studies
Kannissery Pramod
1,5, Chettiyam Veettil Suneesh
2, Salim Shanavas
3, Shahid Hussain Ansari
4and Javed Ali
1*Abstract
Background:The drug-excipient compatibility studies were carried out with the possible excipients viz. Tween 80, Carbopol 940, chitosan, sodium alginate, and polycaprolactone (PCL) for their possible use in the formulation of eugenol loaded nanoemulsion gels and nanoparticles.
Methods:The eugenol-excipient compatibility studies were carried out by visual observations, differential scanning calorimetry (DSC), infrared spectroscopy (FTIR), and high-performance thin-layer chromatography (HPTLC).
Results:No notable change was observed in the samples on visual observation. From the results of the DSC studies, to a much extent, it was assumed that eugenol was not subjected to any interaction with the selected excipients for the proposed nanoemulsion gel and nanoparticles. But in some cases viz. polycaprolactone and Carbopol, though not to a significant level, slight deviation of the nature and position of the endothermic peaks of eugenol were observed. The results of the IR spectroscopy confirmed the compatibility of eugenol with Tween 80, Carbopol 940, chitosan, sodium alginate, and polycaprolactone. The retention factor of the HPTLC densitogram peaks for all the physical mixtures was well within the retention factor (Rf) value range observed for pure eugenol.
Conclusions:The study results confirmed that eugenol is compatible with the selected excipients for the development of nanoemulsion gels and nanoparticles.
Keywords:Eugenol, Chitosan, Sodium alginate, Poly-ε-caprolactone, Tween 80, Carbopol 940
Background
Assessment of chemical compatibility is inevitable for a stable and effective delivery system for any drug. Though thin layer chromatography (TLC) is considered useful, dif-ferential scanning calorimetry (DSC) is considered as one of the most suitable technique to study drug-excipient compatibility studies. The advantage of DSC is that it does not warrant long-term storage due to the fact that during DSC itself, the sample is subjected to accelerated temperature conditions (Wells, 2002). One drawback of this method is that it will not be suitable when the degrad-ation or incompatibility is not temperature routed. In the present study, we have extensively carried out the eugenol-excipient compatibility studies by combining
the advantages of DSC and high-performance thin-layer chromatography (HPTLC) along with infrared spectroscopy (FTIR).
Cloves and clove oil are much used in food products such as drinks and dishes, and the major constituent of clove oil is eugenol (80–90 %) and is mainly responsible for its properties. Eugenol (Fig. 1a) is used principally as a fragrance and flavoring agent in food industry. It is an analgesic in dental materials and nonprescription drug products, as an insect attractant and as a chemical intermediate.
Eugenol is a potent phytochemical useful against in-flammation and periodontal infections. Novel drug deliv-ery systems enhance the therapeutic potential of active agents. Development of novel drug delivery systems such as nanoemulsions and nanoparticles of eugenol would be beneficial in enhancement of its therapeutic efficacy. But, the selection of excipients or additives for the
* Correspondence:[email protected] 1
Department of Pharmaceutics, Faculty of Pharmacy, Jamia Hamdard, Hamdard Nagar, New Delhi 110062, India
Full list of author information is available at the end of the article
fabrication of these systems requires a careful screening process so as to ensure that the final product is free from physical or chemical incompatibility between eu-genol and excipients.
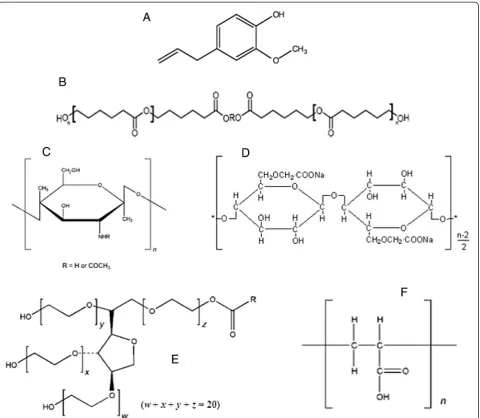
Poly-ε-caprolactone (Fig. 1b) was selected as a suitable polymer candidate to prepare NPs for the treatment of periodontal infections as it possesses advantages that in-clude biocompatibility, biodegradability, high encapsula-tion capacity, non-toxicity, and comparatively slow degradation (Koleske, 1978; Murthy, 1997; Sinha et al. 2004). The application of chitosan (Fig. 1c) and alginate (Fig. 1d) polymers for preparation of nanoparticles (Sos-nik, 2014; Wang et al. 2011) and for treatment of peri-odontal disease (Akncbay et al. 2007; Zaki, 2012) is well reported and established. Polysorbates are widely used in cosmetics, food products and oral, parenteral, and topical
pharmaceutical formulations and are generally regarded as nontoxic and nonirritant materials. Tween 80 (Fig. 1e) is the most commonly employed polysorbate as surfactant in nanoemulsions (Baboota et al. 2007). Carbopol poly-mers (Fig. 1f) are very well suited for aqueous-based top-ical dosage forms. Many commercial toptop-ical products available today have been formulated with Carbopol 940, as they provide the following numerous benefits to topical formulations. Carbopol polymers are safe and effective, non-sensitizing, no effect on the biological activity of the drug and excellent thickening, suspending, and emulsifica-tion properties for topical formulaemulsifica-tions including nanoe-mulsion gels (Baboota et al. 2007).
As a part of selection of suitable polymers and other excipients for the formulation of these colloidal drug de-livery systems, eugenol-excipient compatibility studies
Fig. 1Chemical structures ofaeugenol,bPCL,cchitosan,dsodium alginate,eTween 80, andfCarbopol 940
were carried out. Chitosan, sodium alginate, and poly-ε -caprolactone were studied for their possible use in the formulation of nanoparticles. Tween 80 and Carbopol 940 were checked for compatibility with eugenol for their use in the formulation of topical nanoemulsion gel.
Methods Materials
Eugenol (pure) was purchased from Central Drug House, Delhi, India. Poly-ε-caprolactone (MW–14000), chitosan, and sodium alginate were purchased from Sigma-Aldrich Co., MO, USA. Carbopol 940 was a gift sample from Noveon Corporation, Cleveland, OH, USA. Tween 80 was purchased from Central Drug House, New Delhi, India. All other chemicals and reagents used were of analytical grade.
Eugenol-excipient compatibility studies
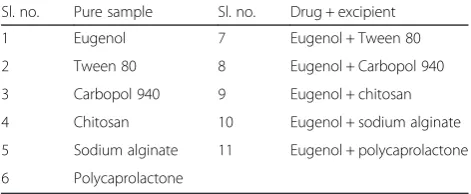
Prior to formulation, to study the physical and chemical compatibilities of eugenol with the proposed excipients to be used, the following studies were conducted on the physical mixtures of drug and each excipient in the weight ratio 1:1. The physical mixtures were stored in light resistant glass containers for 14 days at 37 °C be-fore analysis (Wells, 2002). The samples (Table 1) were subjected to analysis. The analytical results of physical mixtures were compared with those obtained with eu-genol and excipients alone.
Visual observations
The samples subjected to drug-excipient compatibility studies were assessed for any visual changes. The samples were observed for change in color and gas formation.
Differential scanning calorimetry
The DSC thermograms of eugenol, individual excipients, and their physical mixture with eugenol were obtained using DSC-821 (Mettler Toledo, Greifensee, Switzerland) equipped with Star ē Software. Nitrogen gas flow was 60 mL min-1. Samples were weighed about 5–10 mg, sealed in an aluminum pan of 40μL capacity, and equili-brated at 25 °C and were subjected to the DSC run over
the temperature range of 25 to 350 °C at a heating rate of 10 °C min-1.
Infrared spectroscopy
The FTIR spectrum of eugenol was obtained using in IR Prestige-21 Shimadzu FTIR spectrometer (Shimadzu Corp, Kyoto, Japan). Liquid samples and physical mix-tures were examined as a film on sodium chloride salt plate using chlorofom as solvent. The FTIR spectra of powder samples were recorded by KBr pellet method.
High-performance thin-layer chromatography
To assess any possible degradation of the eugenol in the samples subjected to compatibility studies, the devel-oped and validated stability indicating HPTLC method was used (Pramod et al. 2015). The samples subjected to drug-excipient compatibility studies were mixed with methanol. The solutions were filtered through a 0.45 μ nylon filter and were applied as bands. The mobile phase consisted of n-Hexane: acetone (7:3 v/v). The retention factor (Rf) values of the bands of the samples and pure
eugenol were obtained. Comparison of Rf values was
employed to assess the drug-excipient compatibility (Mutalik and Udupa, 2005).
Results and discussion Visual observations
No notable change was observed in the samples on visual observation. There was no observable color change or gas formation in the samples. Other usual visual evaluations like liquefaction and cake formation could not be studied due to the liquid nature of eu-genol. Absence of any significant changes suggested a possible compatibility of eugenol with the selected excipients.
Differential scanning calorimetry
The obtained DSC thermogram of pure eugenol is shown in Figs. 2a, 3a, 4a, 5a, and 6a and was found to be in agree-ment with the reported thermogram of eugenol (Chaar et al. 2004; Monteiro et al. 2011; Nuchuchua et al. 2009; San-tos et al. 2009). The DSC curve for the eugenol displayed one endothermic peak, at 258.81 °C which attributed to the volatilization of eugenol (Monteiro et al. 2011).
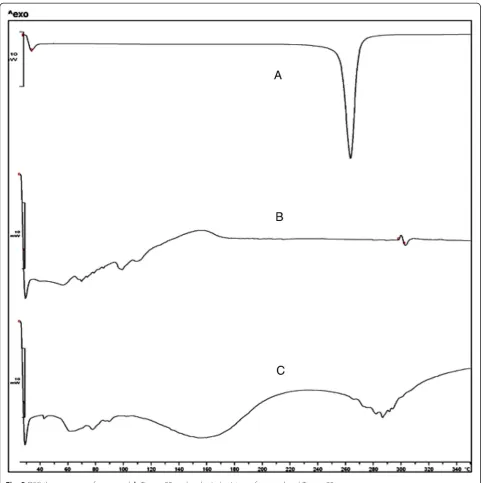
The DSC thermogram of Tween 80 (Fig. 2b) was in reasonable agreement with the reported data (Fang et al. 2008; Kishore et al. 2011). The endothermic peak near 115 °C was observed in the thermogram of Tween 80 which corresponds to its flash point (Fang et al. 2008). The endotherm corresponding to the volatilization of eugenol was found to shift slightly toward higher temperature and showed its peak at 285.79 °C (Fig. 2c). This could be the result of the stabilization of the
Table 1Samples used in drug-excipient compatibility studies
Sl. no. Pure sample Sl. no. Drug + excipient
1 Eugenol 7 Eugenol + Tween 80
2 Tween 80 8 Eugenol + Carbopol 940
3 Carbopol 940 9 Eugenol + chitosan
4 Chitosan 10 Eugenol + sodium alginate
5 Sodium alginate 11 Eugenol + polycaprolactone
eugenol by the Tween 80. The viscous liquid nature of the Tween 80 could also be held responsible for this result.
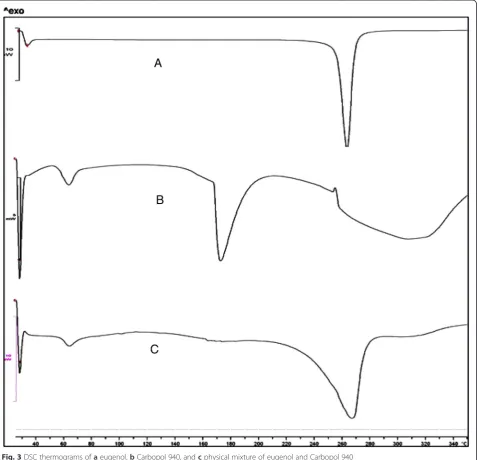
The DSC thermogram of Carbopol 940 (Fig. 3b) was comparable to reported data (Aigner et al. 2011; Mutalik and Udupa, 2005). The DSC thermogram of physical mixture of eugenol and Carbopol (Fig. 3c) revealed only a very negligible change in the endothermic peak of eugenol in the presence of Carbopol 940 (265.83 °C). Previous studies have also reported such negligible change in the melting point of drug in presence of
Carbopol (Mutalik and Udupa, 2005). Thus, it could be assumed to a much extent that eugenol is not subjected to any interaction with Carbopol 940.
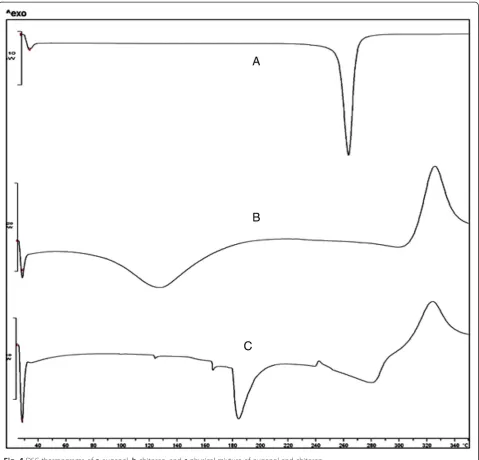
The DSC thermogram of chitosan (Fig. 4b) was in rea-sonable agreement with the reported data (Bhumkar and Pokharkar, 2006; Guinesi and Cavalheiro, 2006; Kittur et al. 2002). The thermogram of chitosan showed an endo-therm at 127.41 °C which could be attributed to the pos-sible moisture content of the chitosan sample. The endotherm could be related to the pressure buildup be-cause of water evaporation inside the pans (Kittur et al.
Fig. 2DSC thermograms ofaeugenol,bTween 80, andcphysical mixture of eugenol and Tween 80
2002). The second thermal event may be related to the decomposition of amine units with correspondent exo-thermic peak at around 325 °C (Guinesi and Cavalheiro, 2006; Kittur et al. 2002). The DSC thermogram of phys-ical mixture of eugenol chitosan (Fig. 4c) revealed ther-mal events (peaks) corresponding to a combination of individual thermograms of both. An endothermic peak at 280.86 °C corresponding to eugenol and an exothermic peak at around 325 °C corresponding to that of chitosan were observed. The endothermic peak corresponding to moisture in chitosan was also observed at around 125 °C. Thus, it could be inferred that eugenol is not subjected to any interaction with chitosan.
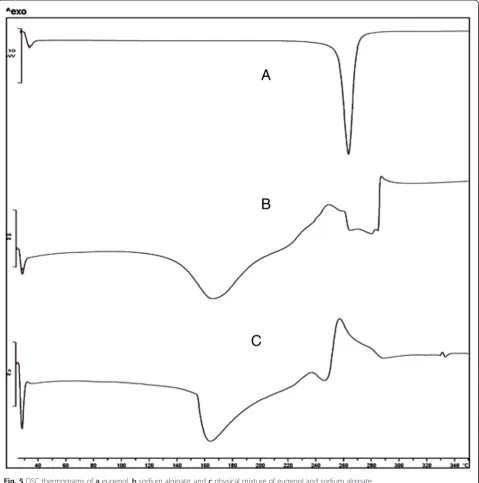
The DSC thermogram of sodium alginate (Fig. 5b) was in reasonable agreement with the reported data (Pathak et al. 2008; Soares et al. 2004). The decomposition of the polymer was represented by an exothermic peak at around 250 °C (Soares et al. 2004). Complete decom-position of the carbonaceous material occurred above 300 °C as indicated by the exothermic response in the thermogram (Soares et al. 2004). The major ther-mal events of eugenol and sodium alginate were ob-served in the thermogram of their physical mixture also (Fig. 5c). The endothermic peak of eugenol was found around 250 °C in the mixture. The decomposition exo-thermic peak of sodium alginate was found to be around
255 °C in the mixture. Thus, from the DSC thermograms, it could be inferred that eugenol is not subjected to any interaction with sodium alginate.
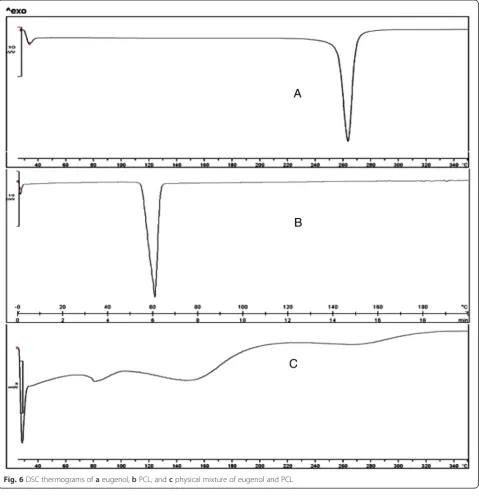
The DSC thermogram of polycaprolactone (Fig. 6b) showed its endothermic peak of melting at 60.40 °C. It was in agreement with the reported data (Chawla and Amiji, 2002; Natarajan et al. 2011). The endothermic peak of eugenol was observed in the thermogram of the mixture (Fig. 6c) at 270.88 °C. The endothermic peak of polycaprolactone was slightly shifted to 81.16 °C. This could be due to the stabilization of the polymer by the liquid nature of eugenol with high boiling point. Thus, from the DSC thermograms, it could be
assumed that eugenol is not subjected to any inter-action by polycaprolactone.
From the results of the DSC studies, to a much ex-tent, we could assume that eugenol is not subjected to any interaction with the selected excipients for the proposed nanoemulsion gel and nanoparticles. But in some cases viz. polycaprolactone and Carbopol, though not to a significant level, slight deviation of the nature and position of the endothermic peaks of eugenol were observed. Considering the fact that eugenol is in the liquid state and the excipients are in solid/liquid state, the results obtained could be con-sidered as satisfactory. The change of the physical
Fig. 4DSC thermograms ofaeugenol,bchitosan, andcphysical mixture of eugenol and chitosan
state of the mixture (semisolid type except for the mixture with Tween 80 where is a change in the viscosity), which is different from the individual ones (liquid and solids), could also contribute toward this type of response. Moreover, it is difficult to expect a result as we do in solid samples which we usually come across in case of drugs. In general and most cases of drug excipients compatibility studies, where both drug and excipients are solids, these types of be-havior may not be observed. Considering all these facts, we finally decided to carry out the IR spectros-copy of the samples which could yield a more
authentic and appropriate result to confirm whether the purity of the eugenol is retained or not in the mixture. The results of these experiments are detailed and discussed in the next section.
Infrared spectroscopy
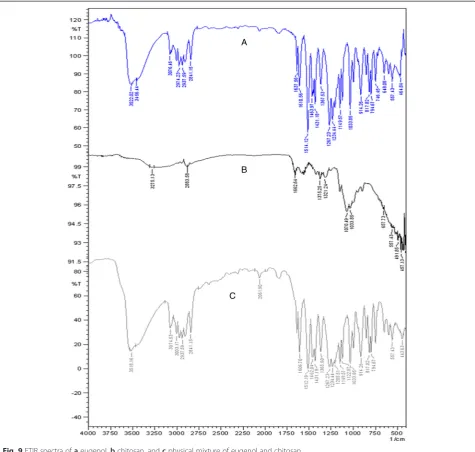
FTIR spectra of the mixture of eugenol and excipients were compared with the spectra of individual compo-nents. The FTIR spectrum of eugenol is shown in Figs. 7a, 8a, 9a, 10a, and 11a. Eugenol showed its signa-ture peaks in 720–1250 cm-1 region corresponding to C=C region. In addition, sharp peaks at 1637.56,
1610.56, and 1514.12 cm-1 were also found from eu-genol, which could be due to C=C stretching of the aro-matic moiety. The obtained spectrum was found to be well in agreement with the reported spectrum of eugenol (Nuchuchua et al. 2009; Yang and Song, 2005).
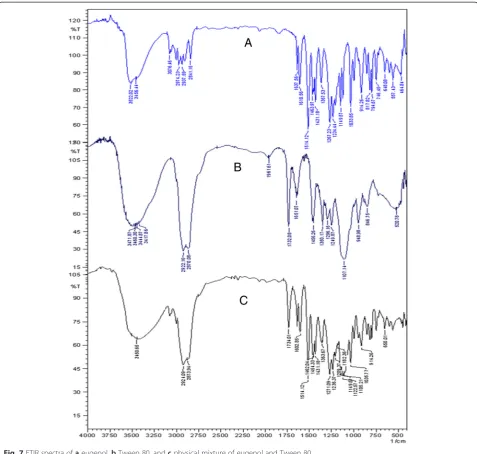
In the case of Tween 80, the FTIR spectrum (Fig. 7b) was well in agreement with reported data (Hillgren et al. 2002; Lim et al. 2009; Shan et al. 2010). The FTIR spectrum of Tween 80 exhibited peaks at around 3600 (OH-stretching), around 2900 (CH2-stretching), around 1732.08 (C=O-stretching),
and around 1600 cm-1 (HOH-bending). The signature
peaks of eugenol (720–1250 cm-1) were present in the physical mixture also (Fig. 7c). The sharp peaks at around 1637, around 1602.85, and 1514.12 cm-1 (Fig. 7c) were well in agreement with the FTIR spectrum of pure eugenol.
The FTIR spectrum of Carbopol 940 (Fig. 8b) was well in agreement with reported data (USP 29, 2006). The FTIR spectrum exhibited main peaks at 1712.79, around 1454, around 1414, around 1245, 1172.72, around 1115, and around 801 cm-1. The signature peaks of eugenol (720–1250 cm-1) were present in the physical mixture also (Fig. 8c). The sharp peaks at around 1637, around
Fig. 6DSC thermograms ofaeugenol,bPCL, andcphysical mixture of eugenol and PCL
1610, and 1512.19 cm-1were well in agreement with the FTIR spectrum of pure eugenol. The characteristic peaks of Carbopol 940 at 1712.79, around 1454, around 1414, around 1245, around 1115, and around 801 cm-1 were present in the physical mixture (Fig. 8c) and were well in agreement with that of FTIR spectrum of pure Carbopol 940 (Fig. 8b).
In the case of chitosan, the FTIR spectrum (Fig. 9b) was well in agreement with reported data (Lawrie et al. 2007; Sahoo et al. 2010). The FTIR spectrum of chitosan showed its characteristic peaks at 3275.13 (O-H and N-H stretch), 2883.58 (C-N-H stretch), 1662.64 (amide I vi-bration), around 1580 (N-H bending from amine and amide II), around 1414 (-CH2 bending), 1375.25 (CH3
symmetrical deformation), around 1150 (antisymmetric stretch C-O-C and C-N stretch) and around 1026 cm-1 (skeletal vibration of C-O stretching). The signature peaks of eugenol (720–1250 cm-1) were present in the physical mixture (Fig. 9c) also. The sharp peaks at 1606.70, 1512.19, and around 1637 cm-1 were well in agreement with the FTIR spectrum of pure eugenol. The characteristic peaks of chitosan at around 2880, around 1662, 1431.18, 1365.60, 1149.57, and around 1026 cm-1 were present in the physical mixture and were well in agreement with that of the FTIR spectrum of pure chito-san. The peak at 3275.13 cm-1 due to O-H and N-H stretch was overlapped by the peak of eugenol in the mixture.
The FTIR spectrum of sodium alginate (Fig. 10b) showed its characteristic peaks at 3700–3000 (broad, OH stretch), 3000–2850 (CH stretch), 1598.99 (antisymmetric CO2-stretch), 1415.75 (symmetric CO2-stretch), around
1297 skeletal vibration, and 1081–1027 cm-1 (antisymmet-ric stretch C-O-C). These results were well in agreement with reported data (Lawrie et al. 2007; Sakugawa et al. 2004). The signature peaks of eugenol (720–1250 cm-1) were present in the FTIR spectrum of physical mixture also (Fig. 10c). The sharp peaks at around 1637, 1608.63, and 1512.19 cm-1were well in agreement with the FTIR spectrum of pure eugenol. The characteristic peaks of so-dium alginate were possibly overlapped by the peaks of eugenol as both exhibited peaks at very similar wave
number. Another possibility for this result is the insolubil-ity of sodium alginate in chloroform (USP 29, 2006) used as medium for taking the IR spectrum. Overall, the study revealed that eugenol does not have any incompatibility with sodium alginate.
In the case of polycaprolactone, the FTIR spectrum (Fig. 11b) was well in agreement with reported data (Sahoo et al. 2010; Wu, 2003). The characteristic peaks of polycaprolactone (PCL) at 3300–3700, 1730.15, 850– 1480, and 731.02 cm-1 all appeared in its spectrum. In the case of the physical mixture of eugenol and PCL, the FTIR spectrum (Fig. 11c) showed the characteristic peaks of both eugenol and PCL. The signature peaks of eugenol (720–1250 cm-1) were present in the physical
Fig. 8FTIR spectra ofaeugenol,bCarbopol 940, andcphysical mixture of eugenol and Carbopol 940
mixture also. The sharp peaks at 1604.77, 1514.12, and around 1637 cm-1were well in agreement with the FTIR spectrum of pure eugenol. The characteristic peaks of PCL at 3300–3700, 1732.08, 850–1480, and 746.45 cm-1 were present in the physical mixture and were well in agreement with that of FTIR spectrum of pure PCL (Fig. 11b).
The results of the IR spectroscopy confirmed the compatibility of eugenol with Tween 80, Carbopol 940, chitosan, sodium alginate, and polycaprolactone.
High-performance thin-layer chromatography
As a final step of confirmation of the compatibility of eugenol with the excipients, we carried out the HPTLC
of the samples stored for 14 days at 37 °C. The HPTLC method (Pramod et al. 2015) was used to check the presence of peak(s) of degradation product(s) of eugenol, if any, and thereby assess the drug-excipient compatibil-ity with the proposed excipients.
It was observed that none of the pure samples of ex-cipients showed peaks in their densitogram. In the phys-ical mixtures of eugenol and excipients, all the samples developed single peak only. The retention factor of the peaks for all the physical mixtures was well within the Rf
value of 0.539 ± 0.004 observed for pure eugenol. Thus, it was confirmed that eugenol is compatible with the selected excipients for the development of nanoemulsion gel and nanoparticles.
Fig. 10FTIR spectra ofaeugenol,bsodium alginate, andcphysical mixture of eugenol and sodium alginate
Conclusions
Toward the selection of suitable excipients for the for-mulation of nanoemulsion gel and nanoparticlulate de-livery systems, eugenol-excipient compatibility studies were carried out. Eugenol-excipient compatibility studies were carried out with the possible excipients viz. Tween 80, Carbopol 940, chitosan, sodium alginate, and polyca-prolactone. The eugenol-excipient compatibility studies were carried out by visual observations, differential scan-ning calorimetry (DSC), infrared spectroscopy (FTIR), and HPTLC. The study results thus confirmed that com-patibility of eugenol with selected excipients was accept-able with the employed methods. Thus, the selected excipients could be used for the development of nanoe-mulsion gels and nanoparticles.
Competing interests
The authors declare that they have no competing interests.
Authors’contributions
KP, SHA and JA proposed the idea and design the experiment. CVS carried out infrared spectroscopy (FTIR) studies. SS carried out differential scanning calorimetry (DSC) studies. KP and JA prepared samples for analysis. KP carried out the HPTLC analysis. All authors participated in the preparation of the manuscript. All authors read and approved the final manuscript.
Author details
1
Department of Pharmaceutics, Faculty of Pharmacy, Jamia Hamdard, Hamdard Nagar, New Delhi 110062, India.2Department of Chemistry,
University of Kerala, Kariavattom Campus, Thiruvananthapuram 695581Kerala, India.3Starch Characterization Laboratory, Division of Crop Utilization, Central
Tuber Crops Research Institute, Sreekariyam, Thiruvananthapuram 695017Kerala, India.4Department of Pharmacognosy & Phytochemistry,
Faculty of Pharmacy, Jamia Hamdard, Hamdard Nagar, New Delhi 110062, India.5College of Pharmaceutical Sciences, Government Medical College,
Kozhikode 673008Kerala, India.
Received: 13 February 2015 Accepted: 5 November 2015
References
Aigner Z, Heinrich R, Sipos E, Farkas G, Ciurba A, Berkesi O, et al. Compatibility studies of aceclofenac with retard tablet excipients by means of thermal and FT-IR spectroscopic methods. J Therm Anal Calorim. 2011;104:265–71. Akncbay H, Senel S, Ay ZY. Application of chitosan gel in the treatment of
chronic periodontitis. J Biomed Mater Res B Appl Biomater. 2007;80:290–6. Baboota S, Shakeel F, Ahuja A, Ali J, Shafiq S. Design, development and
evaluation of novel nanoemulsion formulations for transdermal potential of celecoxib. Acta Pharm. 2007;57(3):315–32.
Bhumkar DR, Pokharkar VB. Studies on effect of pH on cross-linking of chitosan with sodium tripolyphosphate: a technical note. AAPS PharmSciTech. 2006; 7(2):E1–6.
Chaar JS, Mouchreck-Filho VE, Breviglieri ST, Cavalheiro ÉTG, Chierice GO. Boiling temperatures and enthalpy changes of essential oils. J Therm Anal Calorim. 2004;75:437–43.
Chawla JS, Amiji MM. Biodegradable poly(ε-caprolactone) nanoparticles for tumor targeted delivery of tamoxifen. Int J Pharm. 2002;249:127–38.
Fang JY, Fang CL, Liu CH, Su YH. Lipid nanoparticles as vehicles for topical psoralen delivery: solid lipid nanoparticles (SLN) versus nanostructured lipid carriers (NLC). Eur J Pharm Biopharm. 2008;70:633–40.
Guinesi LS, Cavalheiro ETG. The use of DSC curves to determine the acetylation degree of chitin/chitosan samples. Thermochim Acta. 2006;444:128–33. Hillgren A, Lindgren J, Aldén M. Protection mechanism of Tween 80 during freeze-thawing of a model protein, LDH. Int J Pharm. 2002;237:57–69. Kishore RS, Pappenberger A, Dauphin IB, Ross A, Buergi B, Staempfli A, et al.
Degradation of polysorbates 20 and 80: studies on thermal autoxidation and hydrolysis. J Pharm Sci. 2011;100:721–31.
Kittur FS, Prashanth KVH, Sankar KU, Tharanathan RN. Characterization of chitin, chitosan and their carboxymethyl derivatives by differential scanning calorimetry. Carbohydr Polym. 2002;49:185–93.
Koleske JV. Blends containing poly(ε-caprolactone) and related polymers. In: Paul DR, Newman S, editors. Polymer Blends, vol. 2. New York: Academic; 1978. p. 369–89. Lawrie G, Keen I, Drew B, Chandler-Temple A, Rintoul L, Fredericks P, et al.
Interactions between alginate and chitosan biopolymers characterized using FTIR and XPS. Biomacromolecules. 2007;8:2533–41.
Lim EK, Yang J, Suh JS, Huh YM, Haam S. Self-labeled magneto nanoprobes using tri-aminated polysorbate 80 for detection of human mesenchymal stem cells. J Mater Chem. 2009;19:8958–63.
Monteiro OS, Souza AG, Soledade LEB, Queiroz N, Souza AL, Mouchrek Filho VE, et al. Chemical evaluation and thermal analysis of the essential oil from the fruits of the vegetable species Pimenta dioica Lindl. J Therm Anal Calorim. 2011;106:595–600.
Murthy RSR. Biodegradable polymers. In: Jain NK, editor. Controlled and Novel Drug Delivery. New Delhi: CBS Publisher; 1997. p. 27–51.
Mutalik S, Udupa N. Formulation development, in vitro and in vivo evaluation of membrane controlled transdermal systems of glibenclamide. J Pharm Pharm Sci. 2005;8:26–38.
Natarajan V, Krithica N, Madhan B, Sehgal PK. Formulation and evaluation of quercetin polycaprolactone microspheres for the treatment of rheumatoid arthritis. J Pharm Sci. 2011;100:195–205.
Nuchuchua O, Saesoo S, Sramala I, Puttipipatkhachorn S, Soottitantawat A, Ruktanonchai U. Physicochemical investigation and molecular modeling of cyclodextrin complexation mechanism with eugenol. Food Res Int. 2009;42: 1178–85.
Pathak TS, Kim JS, Lee SJ, Baek DJ, Paeng KJ. Preparation of alginic acid and metal alginate from algae and their comparative study. J Polym Environ. 2008;16:198–204.
Pramod K, Ilyas UK, Singh M, Kamal YT, Ahmad S, Ansari SH, Ali J. High performance thin layer chromatographic analysis of eugenol in developed nanoemulsion gel and nanoparticles: validation of a stability indicating method. ACTA Chromatographica. 2015. doi:10.1556/AChrom.27.2015.3.12. Sahoo S, Sasmal A, Sahoo D, Nayak P. Synthesis and characterization of
chitosan-polycaprolactone blended with organoclay for control release of doxycycline. J Appl Polym Sci. 2010;118:3167–75.
Sakugawa K, Ikeda A, Takemura A, Ono H. Simplified method for estimation of composition of alginates by FTIR. J Appl Polym Sci. 2004;93:1372–7. Santos AL, Chierice GO, Alexander KS, Riga A, Matthews E. Characterization of the
raw essential oil eugenol extracted fromSyzygium aromaticumL. J Therm Anal Calorim. 2009;96:821–5.
Shan X, Chen L, Yuan Y, Liu C, Zhang X, Sheng Y, et al. Quantitative analysis of hemoglobin content in polymeric nanoparticles as blood substitutes using Fourier transform infrared spectroscopy. J Mater Sci Mater Med. 2010;21:241–9. Sinha VR, Bansal K, Kaushik R, Kumria R, Trehan A. Poly-ε-caprolactone
microspheres and nanospheres: an overview. Int J Pharm. 2004;278:1–23. Soares JP, Santos JE, Chierice GO, Cavalheiro ETG. Thermal behavior of alginic
acid and its sodium salt. Ecletica Quimica. 2004;29:53–6.
Sosnik A. Alginate particles as platform for drug delivery by the oral route: State-of-the-art. ISRN Pharm 926157. 2014. doi:10.1155/2014/926157. USP 29. The United States Pharmacopoeial convention Inc., Rockville, USA: 2006. Wang JJ, Zeng ZW, Xiao RZ, Xie T, Zhou GL, Zhan XR, et al. Recent advances of
chitosan nanoparticles as drug carriers. Int J Nanomedicine. 2011;6:765–74. Wells J. Pharmaceutical preformulation: the physicochemical properties of drug substances. In: Aulton ME, editor. Pharmaceutics The science of dosage form design. 2nd ed. London: Churchill Livingstone; 2002. p. 114–38.
Wu CS. Physical properties and biodegradability of maleated-polycaprolactone/ starch composite. Polym Degrad Stabil. 2003;80:127–34.
Yang Y, Song LX. Study on the inclusion compounds of eugenol withα-,β-, γ- and heptakis (2,6-di-O-methyl)-β-cyclodextrins. J Inclusion Phenom Macrocyclic Chem. 2005;53:27–33.
Zaki NM. Site-specific delivery of the neutraceutical CoQ10 for periodontal therapy. Int J Pharm Pharm Sci. 2012;4(2):717–23.