VOLUME 38, ARTICLE 36, PAGES 1017−1058
PUBLISHED 16 MARCH 2018
http://www.demographic-research.org/Volumes/Vol38/36/ DOI: 10.4054/DemRes.2018.38.36
Research Material
Collecting data from migrants in Ghana:
Lessons learned using respondent-driven
sampling
Samantha R. Lattof
© 2018 Samantha R. Lattof.
This open-access work is published under the terms of the Creative Commons Attribution 3.0 Germany (CC BY 3.0 DE), which permits use, reproduction, and distribution in any medium, provided the original author(s) and source are given credit.
1 Background 1018 1.1 Surveying migrants with respondent-driven sampling 1019
1.2 Sampling female migrants in Ghana 1021
2 Data and methods 1023
2.1 Formative research 1024
2.2 Recruitment of seeds and participants 1025
2.3 Data collection 1027
2.4 Analyses 1029
3 Results 1030
3.1 Recruitment productivity 1032
3.2 Network size and ties 1034
3.3 Successes and challenges implementing RDS 1039
3.3.1 Coupons and recruitment 1040
3.3.2 Kayayei data collectors 1041
3.3.3 Incentives 1042
4 Discussion 1044
5 Conclusion 1049
6 Acknowledgements 1051
Collecting data from migrants in Ghana:
Lessons learned using respondent-driven sampling
Samantha R. Lattof1
Abstract
BACKGROUND
Policymakers and program implementers require high-quality data on migrants and migration in low- and middle-income countries (LMIC); however, a shortage of high-quality data exists in these settings. Sampling migrant populations requires better techniques. Respondent-driven sampling (RDS) may be one such solution.
OBJECTIVE
Using Ghana as a case study, the objectives of this paper are to: 1) assess RDS recruitment productivity, network size, and ties of internal migrants; 2) test for homophily; and 3) detail the successes of and challenges to implementing RDS in Ghana and how these lessons can be applied to migrant populations in other LMIC settings.
METHODS
This study used RDS to sample 625 rural–urban female migrants working as market
porters (kayayei) in Accra, Ghana.
RESULTS
This study generated the most comprehensive data set on kayayei to date. Network size increases as participants become more educated and migrate more often to Accra. Ethnic group membership is an important determinant of recruitment, with certain groups preferring to recruit from within. Employing members of the kayayei population to collect data built crucial trust.
CONCLUSIONS
Whilst RDS is not a one-size-fits-all solution for sampling hard-to-reach migrants in LMIC, it can be a powerful tool to uncover and to recruit hard-to-reach migrant populations. In countries with multiple ethnolinguistic groups, recruiting a migrant population with greater ethnolinguistic overlap may facilitate quicker equilibrium.
1 Department of Social Policy, London School of Economics and Political Science, UK.
CONTRIBUTION
This study expands the evidence base on use of RDS among migrant populations in LMIC and provides lessons learned to assist other researchers implementing RDS in LMIC settings.
1. Background
The 2030 Agenda for Sustainable Development marks the first time that the global development framework includes migration. Migration’s relevance and contribution to development is reflected throughout the Agenda in goals and targets such as protecting labour rights of migrant workers, ending human trafficking, and implementing planned and well-managed migration policies (United Nations 2015). Monitoring progress of these goals demands high-quality, timely data on migrants and migration. Population registers or administrative systems can generate migration data; however, this data is primarily collected within Europe (UNDESA 2013). High-quality, timely data on migrants and migration in low- and middle-income countries (LMIC) is sparse. In LMIC, migration data comes primarily from decennial population censuses and ad hoc population surveys that are expensive to implement. Ad hoc subnational surveys and research on migration tend to be localised and small-scale; data are rarely representative or generalizable.
migrants; 2) test for homophily; and 3) detail the successes of and challenges to implementing RDS in Ghana and how these lessons can be applied in other LMIC settings.
1.1 Surveying migrants with respondent-driven sampling
RDS, a variation on chain-referral sampling methods like snowball sampling, originated in the United States of America (USA) as a method to sample ‘hidden’ populations such as people living with HIV/AIDS and injecting drug users (Heckathorn 1997). Traditional chain-referral methods may generate biased samples through the oversampling of cooperative participants with larger networks, for example. Such biases would negatively impact inferences from the sample. RDS, however, employs a mathematical model rooted in Markov chain and biased network theories to account for the nonrandom way in which the sample was collected and to generate a weighted sample (Heckathorn 1997). This weighted sample has been proven to be unbiased for samples of meaningful size, regardless of how the researcher purposively selects the initial ‘seeds’ who initiate the recruitment process (Heckathorn 1997; Salganik and Heckathorn 2004). RDS also relies upon a dual-incentive structure whereby participants are rewarded for both participating in the study and for recruiting additional members of the target population via the distribution of uniquely numbered recruitment coupons. For RDS to succeed, the population of interest must be well networked, with individuals recognizing one another as part of a social group. Additionally, researchers must record each participant’s personal network size (the number of eligible participants within each participant’s social network).
growing body of RDS literature addresses the need to “identify potential recruitment biases so that they can be either acknowledged as potential limitations or corrected for in the analysis” (Rudolph, Fuller, and Latkin 2013: 5).
Researchers have used RDS most frequently in the USA, China, India, Mexico, and South Africa (White et al. 2015). Though four of the five most common countries for RDS studies are classified as LMIC, the use of RDS in migration research is often restricted to sampling hard-to-reach international migrant populations in high-income countries (Tyldum and Johnston 2014). There is a small but growing body of evidence that uses RDS to sample migrants in lower-middle income countries (e.g., Ukraine, Morocco, Kenya) and upper-middle income countries (e.g., South Africa, China, Thailand) (International Organization for Migration 2010; Khamsiriwatchara et al. 2011; Tyldum and Johnston 2014; Okal 2016). In the limited evidence on the use of RDS for migrant populations outside of high-income countries, there is little detailed methodological reflection – either positive or negative – on the suitability of this technique for migrant populations in LMIC settings and the lessons learned.
Researchers have implemented RDS within migrant populations to study issues such as sexual violence among Sub-Saharan migrants in Morocco; HIV risk behaviours among undocumented immigrant women in Texas, USA; and the health of adolescent migrants in Shanghai, China (Montealegre et al. 2013; Decker et al. 2014; Keygnaert et al. 2014). These studies contribute to a nascent body of evidence within the migration literature that documents efforts to ground RDS in local cultures and settings. Keygnaert et al. (2014) adopt a community-based participatory research approach with a community advisory board that contributes to the study design and helps identify community-based researchers in Morocco. Montealegre et al. (2013) incorporate extensive formative evidence in the design of RDS among Central American immigrant women in the USA that includes in-depth interviews with women to assess the acceptability of RDS, to examine social network characteristics, and to pilot the survey questionnaire. Decker et al.’s (2014) five-country (United States, Nigeria, South Africa, India, China) comparative study of disadvantaged 15–19-year-olds also incorporates an extensive formative phase to inform RDS design and implementation, including community mapping, in-depth interviews and focus group discussions with the target population, and key informant interviews.
target populations as well as participant reluctance to refer additional participants (Platt, Luthra, and Frere-Smith 2015). Among socially marginalized young people in Sydney, Australia, Bryant (2014) found that RDS sampled the target population inefficiently, leading to a high proportion of ineligible participants. Compared to other RDS studies the recruitment rate was low, and participants had small and disparate networks (Bryant 2014).
These documented challenges implementing RDS shed important light on some of the pitfalls involved in using this sampling method for migrant populations. Taken as a whole, they suggest a need to more fully ground RDS in formative research prior to sampling and to share lessons learned from applying RDS in various settings. Involving members of the target population in the design of RDS might help minimize potential implementation challenges such as inappropriate incentives, cultural attitudes towards research participation and peer-recruitment, and whether or not sufficient, direct links exist between members of the target social group. Feedback from the target population and stakeholders may also indicate that RDS may be an inappropriate tool in certain settings or within certain populations. In Moscow, Russia, preliminary fieldwork revealed that irregular female migrants were unable or unwilling to refer participants via RDS; thus, the researchers modified their initial plans and implemented an alternative sampling method (Agadjanian and Zotova 2012).
Little evidence has been published regarding the nuances and practicalities of implementing RDS among migrants in LMIC. With inconsistent documentation of RDS implementation experiences it is difficult to assess where and why RDS is working or failing. The use of RDS in such settings warrants better understanding of factors leading to its successful implementation.
1.2 Sampling female migrants in Ghana
This case study uses data collected during the implementation of RDS among a subpopulation of female internal migrants in Ghana. These migrants are identified by
their occupation as market porters who carry loads on their heads (kayayei2 [plural],
kayayoo [singular]). They represent the face of contemporary female north–south, rural–urban migration in Ghana, with most migrant female youth taking up this work upon arrival in Accra (Kwankye and Addoquaye Tagoe 2009). Yet head porter work is not limited to female migrants from northern Ghana. Kayayei may come from Ghana’s
2Kayayei and kayayoo are compound words formed from the Hausa and Ga languages. Kaya is often
other regions and from Togo. Ga petty traders in Accra may even work occasionally as head porters if they cannot make enough money trading (Salifu 2015). In Accra and Kumasi, Ghana’s two largest cities, authorities and local residents alike often view kayayei as outsiders, since the majority of kayayei migrated from rural areas in Ghana’s northern three regions. Kayayei are highly stigmatized due to a combination of their menial work and northern ethnicities, and they may regard strangers and authority figures with fear and suspicion (Daily Graphic 2010).
These internal migrant kayayei tend to be missed or excluded from household- and institution-based (e.g., school, health facility) surveys since they are mobile, occasionally homeless, and have low levels of formal education. Though vulnerable to sexual and reproductive health risks and violence, migrant kayayei seek formal health services infrequently (Anarfi and Appiah 2009; Kwankye and Addoquaye Tagoe 2009), excluding the possibility of facility-based sampling methods to research health-related issues. This population has become a growing concern for the government, nongovernmental organizations, and civil society organizations. The growing migration of girls and women from northern Ghana seeking kayayei work to avoid poverty highlights a need for greater development in the north. Large numbers of teenagers working as kayayei challenge Ghana’s efforts to combat child labour. The increasing number of adolescents and young adults in Accra places additional pressure on social services and employment opportunities. Despite consensus that the total number of kayayei in Accra is increasing, the exact figure remains unknown: estimates range from 2,300 to 160,000 (Kearney 2013; Parliament of the Republic of Ghana 2016).
with chain-referral methods like snowball sampling, recruiting migrant kayayei with the largest networks would likely lead to bias.
Despite the methodological and implementation limitations of RDS, this method offers an opportunity to overcome previously documented kayayei sampling challenges (e.g., declining to participate when interrupted at work, lack of a sampling frame) and an opportunity to generate stronger population-level inferences than prior studies employing nonrandom sampling methods. By design, RDS features (e.g., peer recruiting, coupons) could also help facilitate participant willingness and availability, which have hindered prior efforts to sampling migrant kayayei. Ghana’s migrant kayayei meet the criteria to sample using RDS. Migrant kayayei can be clearly defined, recognize one another as part of the group, and have the characteristics of a social group (i.e., they identify and interact with each other) (Friberg and Horst 2014). Formative discussions with key informants, including members of the Kayayei Youth Association (KYA) and kayayei leaders, indicated that kayayei migrants would have sufficiently dense network ties to facilitate chain referral. Organizations in Accra offer events and programmes (e.g., community health outreach programmes, skills training, activities organized by the KYA) to kayayei regardless of ethnolinguistic group, providing opportunities for kayayei to meet and interact with members of different tribes. North– south migration in Ghana is a highly network-driven phenomenon with migrant kayayei linked by kinship, friendship, community, and tribe. Kayayei are directly linked to one another, and these connections impact their migration. For girls and women in the north considering migrating to Accra, relationships with current migrants influences choice of destination. Kayayei migrants work together in groups, sleep together outside or in a shared room, watch over each other’s children, and support one another.
2. Data and methods
the KYA’s office allowed the research team to link participants needing additional support with services that the KYA provides in collaboration with partners (e.g., Marie Stopes Ghana, United States Agency for International Development, Society for Women and AIDS in Africa). In recognition of the diverse roles that female migrants play, including that of mother and caregiver, the office was a child-friendly place. Infants and young children accompanied participants on a daily basis.
2.1 Formative research
Before implementing the survey, the author spent two months in the community conducting formative research and volunteering with the KYA. Formative activities identified as critical prior to implementing RDS included meetings with a wide range of stakeholders (e.g., kayayei community leaders, potential seeds who would initiate the study, KYA board members) to introduce the study, seek their input, and answer questions about the research. The formative research generated evidence on factors necessary for implementation of RDS, including appropriate incentives; participants’ personal network sizes; hours and days during which to conduct the study; coupon design; the survey instrument; participants’ languages; and participants’ prior experiences with researchers, outsiders, and census enumerators. People were unfamiliar yet intrigued by the idea of using coupons to recruit and to participate. Formative discussions about the use of coupons revealed that, so long as the incentives were appropriate, kayayei migrants would participate in longer interviews. Provided participants received an appropriate incentive that compensated them for missed work and travel, key informants expected that participants would sit for at least 45 minutes to complete the survey.
To accurately measure personal network size (PNS) – the number of eligible participants within each participant’s social network – the formative assessment phase explored what it meant to know someone in this setting, and piloted ways in which to ask participants these questions. Capturing each participant’s PNS is crucial for analysing data using RDS and requires: 1) a clear definition of the target population, 2) a defined meaning of what it means to know someone, 3) a geographic parameter, and 4) a time frame (Johnston, Rodriguez, and Napierala 2014).
The critical importance of the identity of interviewers also emerged during the formative work. Key informants recommended hiring local data collectors who identified as insiders rather than outsiders and could thus minimize social distance (Driedger and Peters 1977) and put the study population at greater ease. Additionally, kayayei data collectors would be well positioned to confirm eligibility criteria and rule out potential imposters, such as beggars, who might attempt to participate for the incentive. Seven data collectors from northern Ghana who self-identified as kayayei and who had a high school education were selected and trained to administer the survey questionnaire to participants. Data collectors spoke English, Twi, Dagbani, Frafra, Mampruli, Kusaal, and Sisaala. Like the kayayei community leaders consulted during the formative research phase, all data collectors were bilingual or multilingual, speaking two (n = 2), four (n = 2), or five languages (n = 3). The number of data collectors was based on linguistic needs as well as sampling estimates that assisted in study planning and implementation (Wejnert et al. 2012). Conservative calculations revealed that an estimated sample of 538 kayayei was required to achieve the same statistical power as a simple random sample one-tenth as large (Lattof 2018).
2.2 Recruitment of seeds and participants
remaining seeds. The other two failed seeds identified as Sissala and Frafra, warranting replacement seeds that identified similarly to ensure sufficient representation. The remaining six seeds were growing sufficiently and their recruitment chains continued to generate new recruits, so only two replacement seeds were added to the study.
In consultation with stakeholders, coupons were designed and printed in English, the primary language of instruction in Ghana’s schools. Given the low levels of education and literacy among the study population, many participants would likely be unable to read the coupons. If illiterate participants sought assistance from someone outside the office, whoever read the coupon would have learned English in school. To minimize issues with using coupons among a largely illiterate population for whom the coupons would serve as a visible token of potential participation, data collector training emphasized the importance of concise oral recruitment instructions to each participant after the survey. Participants were encouraged to return to the office if they had questions about the coupon details. Participants received three recruitment coupons until their recruitment chain reached the third wave, at which point the number of coupons was reduced to two. In the last week of the study the number of recruiting coupons was gradually reduced to zero. Initially, coupons expired within one week in order to minimize coupon degradation and maximize the possibility that recruiters would correctly recall the recruitment instructions. It became apparent after the first week that a shorter referral window would lead to less coupon deterioration and fewer reports of coupons being taken north with potential recruits returning home. The coupon validity period was reduced to three days for the remainder of the survey.
Recruits who held a valid coupon were invited to participate in the study if they met the following selection criteria:
1. Female
2. Currently working as a kayayoo in Accra
3. Migrated to Accra from one of the three northern regions (Upper East Region, Upper West Region, or Northern Region)
4. Has not already participated.
Assigning participants to data collectors based on shared ethnic group and/or shared language increased the likelihood that any ineligible returning participants would be reinterviewed and identified by their original data collector. Whilst data collectors were advised to be aware of the possibility of repeat participants and were encouraged to report suspected repeat participants, they identified no cases.
study population and suspicion over signing documents, verbal consent was preferable to written consent so as to reduce potential embarrassment and underscore the participants’ agency. Participants were offered the option of verbal consent in which the researchers followed a set script (Evans and Becker 2009; GSS, GHS, and ICF Macro 2009; Day 2014). Among participants under 18 years of age, the data collectors inquired whether the participants migrated to Accra with a parent or guardian or if they were ‘emancipated minors’ who migrated to Accra alone. Adults (those aged 18 years and older) and independent child migrants (emancipated minors under 18 years of age) received the standard consent form. Children under 18 years who resided in Accra with a parent or guardian were asked to bring their parent or guardian to the office to complete a parental consent form and child assent form before participating. The London School of Economics (LSE) Research Ethics Committee (on 18 November 2014) and the University of Ghana’s Noguchi Memorial Institute Institutional Review Board (protocol number 065/14-15) approved this research. In addition, the author sought approval from kayayei community leaders, the KYA’s Board of Directors, the Director of Social Welfare, and the local chief.
2.3 Data collection
The research team pretested and piloted the questionnaire during the formative research period in order to verify the questionnaire structure, formulation of questions, appropriate language and terminology, completion times, range of variation in response variables, and respondent understanding. Data collectors found that the term ‘sister’ was causing confusion, since in this setting ‘sister’ is often used to refer to a close female friend. All survey references to ‘sister’ were thus changed to ‘biological sister.’ Data was recorded in a 25-page questionnaire with ten modules (personal network size, demographic characteristics, employment, reproduction, recent illness or injury, health insurance, relationships, family planning, sexually transmitted infections, and data collector observations). Though the majority of training concluded before the study started, the author continued on-the-job training during survey implementation.
Rodriguez, and Napierala 2014). Data collectors obtained participants’ PNS from three questions at the start of the survey. The first question defines the target population and what it means to know someone (#101). In order to prevent the recruitment of strangers, this question also references time spent together (e.g., carrying loads together for the same customer, sharing a room, sitting together on a break). Subsequent PNS questions limit the survey’s geographic boundary to Accra (#102) and the estimation period to two weeks (#103) to reduce recall bias.
101. How many kayayei do you know who are from the northern three regions: Upper East, Upper West, and Northern Region? By ‘know,’ I mean you know them and they know you. You know their name, and they know your name. They are people you have spent time with who would recognize you in the market.
102. How many of these girls and women currently work in Accra as kayayei? Please give an exact number.
103. How many of these northern kayayei girls and women have you seen at least once in Accra during the last two weeks? Please take your time to count so that you can give me an exact number.
104. From the number you just told me, how many of these kayayei would you consider inviting to this study?
Quality checks were built into the survey and participant flow. Once the data collector finished administering a survey, the author reviewed the survey on site for completeness and accuracy and resolved any inconsistencies or skipped questions with the participant before she received her payment and recruitment instructions. A subset of purposively selected survey participants (n = 48) completed in-depth interviews to discuss their migration histories and their experiences with illness/injury in the two weeks preceding the survey. The author conducted these interviews with a translator who was identified from amongst the data collectors when her skill at connecting with participants became apparent during the survey. The interviews, recorded and transcribed in English, also serve as an important indirect source of information on participants’ reasons for participating in social science research.
2.4 Analyses
Analyses of the population parameters, including the final sample size and sample stability, were conducted using Respondent Driven Sampling Analysis Tool (RDSAT) Version 7.1 (Volz et al. 2012). Apart from analyses of recruitment productivity, seeds were excluded from additional analyses. Partition analysis for categorical and continuous variables in RDSAT used the following recommended options for optimal accuracy and the most stable estimates: dual-component estimate for average network size with a mean cell size of 12, enhanced data-smoothing algorithm type, 16,000 resamples for Bootstrap, and alpha = 0.025 (Heckathorn 2007; Spiller, Cameron, and Heckathorn 2012). Prevalence estimation and equilibrium, or the point at which the sample distribution within variables has stabilized and results in a sample independent of the nonrandom kayayei migrant seeds (Heckathorn 1997, 2002), were also assessed in RDSAT. As recommended in the RDSAT 7.1 User Manual, estimates of the number of waves required for equilibrium used the default convergence radius of 0.02 (Spiller, Cameron, and Heckathorn 2012). Results are reported based on the criteria in the Strengthening the Reporting of Observational Studies in Epidemiology for RDS Studies (STROBE-RDS) checklist (White et al. 2015).
(Salganik and Heckathorn 2004; Heckathorn 2007). Pre-implementation discussions with kayayei generated confidence in the first three assumptions. The fourth assumption (respondents recruit randomly from their networks) is difficult to ensure since factors such as the incentives, study location(s), ethnolinguistic identity, and research topic may influence to whom participants give their coupons (Heckathorn 2007). The researcher discussed these factors with key informants during the formative research period when assessing the appropriateness of RDS and selecting both the study location and incentives. Whilst this fourth assumption is a limitation of RDS that cannot currently be rectified, the survey questionnaire included a fourth question on participants’ personal network sizes in an attempt to minimize potential violation of the fourth assumption, specifically potential recruitment biases underlying the recruiter– recruit relationship. This question and the fifth assumption (accurately reporting personal network size) were tested extensively during data collector training. Most RDS studies violate the sixth assumption (sampling occurs with replacement) since, by design, participants cannot participate again. Biases from violating this particular assumption remain poorly understood (Volz and Heckathorn 2008; Goel and Salganik 2009). Among samples that are relatively small compared to the total population’s size, the sixth assumption is relaxed (Volz and Heckathorn 2008).
3. Results
Figure 1: RDS participant flow diagram of kayayei migrants in Accra, Ghana (March to April 2015)
kayayei experience outside of Accra: three participants previously worked as kayayei in Kumasi (Ashanti Region), and 17 participants previously worked as kayayei in Tamale (Northern Region).
3.1 Recruitment productivity
An average of 156 recruits completed the survey each week. Excluding the 12 seeds recruited into the study without coupons, participants redeemed 613 of the 915 recruitment coupons (67.0%) distributed. This coupon return rate exceeds that of other studies using RDS among migrants; these studies generally report coupon redemption rates from 30.0% to 45.0% among migrant populations in Australia, Albania, and Kenya (Johnston et al. 2010; International Organization for Migration 2010; Bryant 2014). The high rate of return achieved in this study is more comparable to studies examining adolescent health among nonmigrant populations in Ibadan, Nigeria (53.7%) and Delhi, India (75.0%) (Decker et al. 2014).
Table 1: Characteristics of seeds sorted by increasing recruitment productivity ch a ra ct e ri st ic s S e e d re cr u itm e n t p ro d u ct iv ity O ri g in a lo r re p la ce m e n t se e d A g e in ye a rs E th n ic g ro u p R e g io n o f o ri g in N u m b e r o f m ig ra tio ns to A cc ra C u rr e n t le n g th o f tim e in A cc ra W o rk si te in A cc ra H o m el e ss H ig h e st le ve l o f sc h oo l co m p le te d R e lig io n N u m b e r o f se e d ’s d ir e ct re cr u its N u m b e r o
f wave
The recruiter–recruit relationship was tracked with a series of nine questions that were incorporated into the survey. Participants most often reported that their recruiters were friends (58.6%) or biological sisters (25.8%). The majority of participants (95.0%) saw their recruiters every day and knew them very well (96.3%), indicating strong preexisting networks. Three in five participants had known their recruiter for one or more years. Two in five participants knew their recruiter for ten months or less. The survey also asked recruits what type of work their recruiters did for further verification that the recruiters were indeed kayayei migrants.
Data collectors asked participants returning to collect recruitment payments if anyone declined to accept a participation coupon. Participants provided nonresponse data for 16 potential recruits who ranged in age from 16 to 40 years. Participants had strong relationships with these potential recruits and saw them nearly every day. About one third of nonrespondents declined a participation coupon on the grounds that they were too busy to participate. Fear of research was the second most common reason (25.0%) for declining a coupon, followed by lack of interest (18.8%).
3.2 Network size and ties
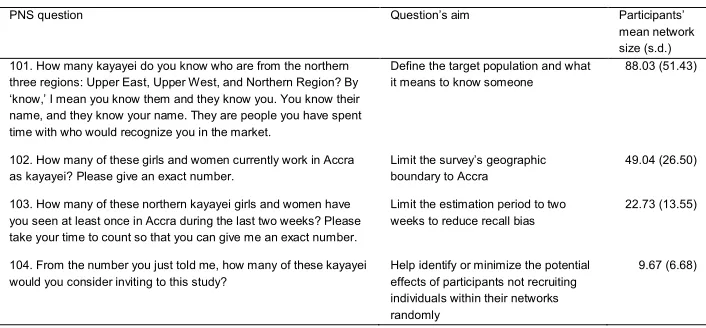
Table 2: Comparison of PNS questions and participants’ mean network sizes
PNS question Question’s aim Participants’
mean network size (s.d.) 101. How many kayayei do you know who are from the northern
three regions: Upper East, Upper West, and Northern Region? By ‘know,’ I mean you know them and they know you. You know their name, and they know your name. They are people you have spent time with who would recognize you in the market.
Define the target population and what it means to know someone
88.03 (51.43)
102. How many of these girls and women currently work in Accra as kayayei? Please give an exact number.
Limit the survey’s geographic boundary to Accra
49.04 (26.50)
103. How many of these northern kayayei girls and women have you seen at least once in Accra during the last two weeks? Please take your time to count so that you can give me an exact number.
Limit the estimation period to two weeks to reduce recall bias
22.73 (13.55)
104. From the number you just told me, how many of these kayayei would you consider inviting to this study?
Help identify or minimize the potential effects of participants not recruiting individuals within their networks randomly
9.67 (6.68)
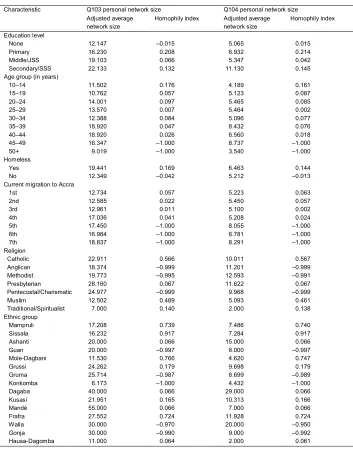
Ethnic group and religion, two variables that did not obtain equilibrium, appear to have restricted some respondents from participating. Ethnic ties remain strong for many participants. Homophily indices (Table 3), a measure of cross-group recruitment ranging from ‒1 (preference for recruiting from outside one’s group) to +1 (preference for recruiting from within one’s group) (Heckathorn 2002), show that participants belonging to Mampruli, Sisaala, Mole-Dagbani, and Frafra tribes were unlikely to recruit across ethnic group; these participants strongly preferred to recruit members of their own tribes. This unwillingness to recruit across ethnic group may be rooted in linguistic differences. It could also reflect a desire to share resources (i.e., the RDS incentives) internally with close friends and family. Homophily indices below 0.4 indicate cross-group recruitment, whereby participants with a particular characteristic are willing to recruit participants without that particular characteristic. Participants recruited freely across characteristics like education level, homelessness, age, and recent illness/injury.
Table 3: Effect of personal network size questions on network sizes and homophily for key demographic characteristics
Characteristic Q103 personal network size Q104 personal network size
Adjusted average network size
Homophily index Adjusted average network size Homophily index Education level None Primary Middle/JSS Secondary/SSS 12.147 16.230 19.103 22.133 ‒0.015 0.208 0.066 0.132 5.065 6.932 5.347 11.130 0.015 0.214 0.042 0.145 Age group (in years)
10‒14 15‒19 20‒24 25‒29 30‒34 35‒39 40‒44 45‒49 50+ 11.502 10.762 14.001 13.570 12.388 18.920 18.920 16.347 9.019 0.176 0.057 0.097 0.007 0.084 0.047 0.026 ‒1.000 ‒1.000 4.189 5.123 5.465 5.464 5.096 8.432 6.560 8.737 3.540 0.161 0.087 0.085 0.002 0.077 0.076 0.018 ‒1.000 ‒1.000 Homeless Yes No 19.441 12.349 0.169 ‒0.042 6.463 5.212 0.144 ‒0.013 Current migration to Accra
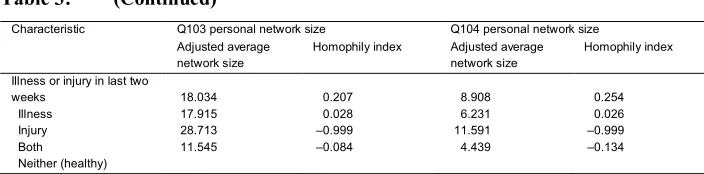
Table 3: (Continued)
Characteristic Q103 personal network size Q104 personal network size
Adjusted average network size
Homophily index Adjusted average network size
Homophily index
Illness or injury in last two weeks
Illness Injury Both Neither (healthy)
18.034 17.915 28.713 11.545
0.207 0.028 ‒0.999 ‒0.084
8.908 6.231 11.591 4.439
0.254 0.026 ‒0.999 ‒0.134
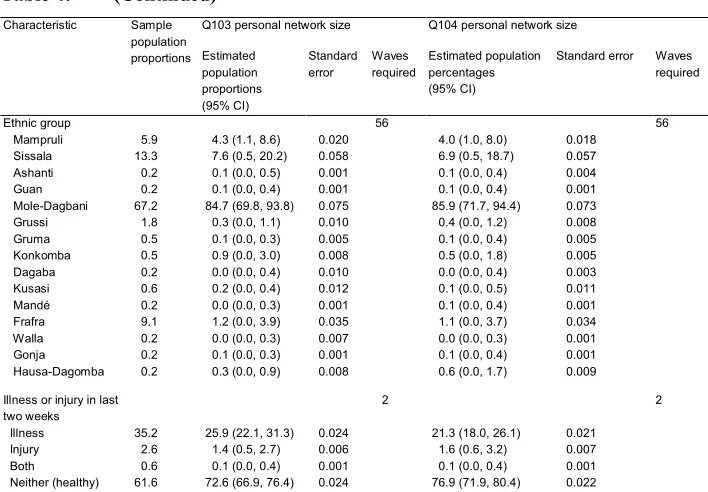
In addition to changes in prevalence, differences in capturing PNS result in subtle changes to estimated population proportions (Table 4). For age group (in years), asking a narrower PNS question (#104) reduced the waves needed for equilibrium from five to four, meaning that after four waves the sample distribution within age group stabilized and produced a sample independent of the age groups of the initial nonrandom migrant kayayei seeds (Heckathorn 1997, 2002). Upon further inspection of the data, a decline in waves required for equilibrium also appeared for respondents’ primary source of drinking water; however, an opposite trend appeared for respondents’ relationship to their recruiter and place of residence in Accra. Both variables required one additional wave to reach equilibrium when estimates used question #104. Asking PNS question (#104) in an attempt to exclude any known or perceived nonresponders from the recruiter’s network calculation certainly did not harm the RDS population estimates.
Table 4: Sample proportions for demographic characteristics versus population estimates by personal network size question
Characteristic Sample
population proportions
Q103 personal network size Q104 personal network size
Estimated population proportions (95% CI)
Standard error Waves required
Estimated population percentages (95% CI)
Standard error Waves required
Education level None Primary Middle/JSS Secondary/SSS
73.3 17.3 7.4 2.1
79.8 (74.8, 84.1) 13.8 (10.0, 18.3) 5.1 (3.4, 7.0) 1.3 (0.5, 2.3)
0.024 0.021 0.009 0.005
3
78.3 (73.1, 82.7) 13.2 (9.8, 17.2)
7.4 (4.6, 10.9) 1.0 (0.4, 1.8)
0.025 0.019 0.016 0.004
3
Age group (in years) 10‒14 15‒19 20‒24 25‒29 30‒34 35‒39 40‒44 45‒49 50+
6.9 15.0 25.9 19.5 18.9 5.6 6.2 1.1 0.8
8.0 (4.8, 12.6) 18.9 (13.6, 25.0) 24.9 (19.3, 29.0) 18.7 (14.5, 23.8) 19.6 (14.5, 25.2) 3.8 (2.2, 5.8) 4.2 (2.7, 6.2) 0.8 (0.2, 1.9) 1.1 (0.1, 2.6)
0.020 0.029 0.024 0.024 0.027 0.009 0.009 0.005 0.007
5
8.9 (5.4, 13.0) 16.2 (12.2, 21.3) 26.1 (20.9, 30.6) 19.0 (14.8, 23.9) 19.6 (15.3, 25.1) 3.4 (2.2, 5.2) 4.9 (2.8, 6.0) 0.6 (0.1, 1.3) 1.2 (0.1, 2.6)
0.020 0.023 0.024 0.023 0.025 0.008 0.008 0.003 0.006
4
Homeless Yes No
17.6 82.4
11.9 (9.0, 15.1) 88.1 (84.9, 91.0)
0.016 0.016
2
14.4 (11.4, 18.4) 85.6 (81.6, 88.6)
0.018 0.018
2
Current migration to Accra
1st 2nd 3rd 4th 5th 6th 7th
33.4 35.4 17.1 7.0 3.4 2.9 0.8
34.8 (28.6, 40.8) 37.2 (31.0, 42.9) 17.4 (13.5, 22.8) 5.2 (3.4, 7.7) 2.4 (1.1, 4.3) 2.4 (1.1, 4.0) 0.5 (0.1, 1.2)
0.031 0.030 0.024 0.011 0.008 0.007 0.003
2
34.8 (29.4, 40.6) 35.1 (29.0, 39.7) 18.2 (14.2, 23.5) 6.9 (4.4, 10.1) 2.1 (0.1, 3.5) 2.4 (1.3, 3.9) 0.5 (0.1, 1.2)
0.028 0.027 0.024 0.015 0.006 0.007 0.003
2
Religion Catholic Anglican Methodist Presbyterian Pentecostal/Charismatic Muslim
Traditional/Spiritualist 8.6 0.5 0.3 1.4 0.8 88.2 0.2
3.6 (1.6, 7.1) 0.3 (0.0, 0.8) 0.2 (0.0, 0.6) 0.5 (0.1, 1.1) 0.3 (0.0, 0.7) 94.8 (90.5, 97.5)
0.4 (0.0, 1.2) 0.014 0.002 0.002 0.003 0.002 0.019 0.008
17
3.4 (1.5, 6.6) 0.2 (0.0, 0.5) 0.1 (0.0, 0.4) 0.5 (0.1, 1.1) 0.3 (0.0, 0.7) 95.0 (91.0, 97.6)
0.5 (0.0, 1.7)
0.013 0.001 0.001 0.003 0.002 0.021 0.014
Table 4: (Continued)
Characteristic Sample population proportions
Q103 personal network size Q104 personal network size
Estimated population proportions (95% CI)
Standard error
Waves required
Estimated population percentages (95% CI)
Standard error Waves required
Ethnic group Mampruli Sissala Ashanti Guan Mole-Dagbani Grussi Gruma Konkomba Dagaba Kusasi Mandé Frafra Walla Gonja Hausa-Dagomba
5.9 13.3 0.2 0.2 67.2 1.8 0.5 0.5 0.2 0.6 0.2 9.1 0.2 0.2 0.2
4.3 (1.1, 8.6) 7.6 (0.5, 20.2) 0.1 (0.0, 0.5) 0.1 (0.0, 0.4) 84.7 (69.8, 93.8)
0.3 (0.0, 1.1) 0.1 (0.0, 0.3) 0.9 (0.0, 3.0) 0.0 (0.0, 0.4) 0.2 (0.0, 0.4) 0.0 (0.0, 0.3) 1.2 (0.0, 3.9) 0.0 (0.0, 0.3) 0.1 (0.0, 0.3) 0.3 (0.0, 0.9)
0.020 0.058 0.001 0.001 0.075 0.010 0.005 0.008 0.010 0.012 0.001 0.035 0.007 0.001 0.008
56
4.0 (1.0, 8.0) 6.9 (0.5, 18.7) 0.1 (0.0, 0.4) 0.1 (0.0, 0.4) 85.9 (71.7, 94.4)
0.4 (0.0, 1.2) 0.1 (0.0, 0.4) 0.5 (0.0, 1.8) 0.0 (0.0, 0.4) 0.1 (0.0, 0.5) 0.1 (0.0, 0.4) 1.1 (0.0, 3.7) 0.0 (0.0, 0.3) 0.1 (0.0, 0.4) 0.6 (0.0, 1.7)
0.018 0.057 0.004 0.001 0.073 0.008 0.005 0.005 0.003 0.011 0.001 0.034 0.001 0.001 0.009
56
Illness or injury in last two weeks Illness Injury Both Neither (healthy)
35.2 2.6 0.6 61.6
25.9 (22.1, 31.3) 1.4 (0.5, 2.7) 0.1 (0.0, 0.4) 72.6 (66.9, 76.4)
0.024 0.006 0.001 0.024
2
21.3 (18.0, 26.1) 1.6 (0.6, 3.2) 0.1 (0.0, 0.4) 76.9 (71.9, 80.4)
0.021 0.007 0.001 0.022
2
* Population proportions are reported per 100 individuals.
3.3 Successes and challenges implementing RDS
3.3.1 Coupons and recruitment
Key informants and participants perceived RDS’s peer recruitment and coupon features as a means to give participants control over whether or not to participate and the timing of their participation. Participants could complete the survey when it suited their schedules, such as periods when the markets were slow or on breaks. During the first week of data collection, data collectors noted occasional stress caused by participant clustering. Participants often waited to redeem their coupons in groups (e.g., those who share a room, friends who work at the same market) around lunchtime and in the afternoon.
Lesson learned: To manage participant flow, suggest that participants encourage their recruits to come at times when the office is known to be quieter, with shorter waiting times. Offer water and snacks to participants waiting to be surveyed, and provide approximate wait times to participants during busy hours.
The use of paper coupons was difficult in Agbogbloshie, where paper deteriorates quickly. Multiple participants and potential participants reported coupons being burned in building fires. Some potential participants reported that their coupons, stored with their money, had been stolen when thieves robbed them at night. The rainy season also soaked multiple coupons until the participant numbers were nearly illegible.
Lesson learned: Laminating coupons or choosing a thicker paper with indelible ink could help mitigate coupon deterioration under similar circumstances. Shortening expiration dates to two or three days can also help mitigate coupon deterioration to a degree; however, some coupon deterioration and loss is unavoidable in settings with similar climates and among populations that are homeless or reside in informal settlements.
informed participants that the study was concluding at the end of the week. The office remained open for one week after the study ended in order to pay out recruitment bonuses and answer any questions about the study, but only one participant returned to collect her recruiting bonus. No potential participants attempted to redeem expired coupons once the study ended, suggesting that the oral participation instructions were well received and understood.
Lesson learned: When conducting RDS among a largely illiterate population, keep recruiting instructions concise. Encourage recruiters and recruits to visit the study site if they forget oral participation details. Establish a member of the research team at the place of interview as a visible first point of contact for participants and potential participants seeking additional information.
3.3.2 Kayayei data collectors
Hiring and training kayayei with a high school education to work as data collectors was a valuable recommendation from the formative assessment period. The kayayei data collectors were integral to the success of this research. They minimized participants’ fears of participating in research and put participants at ease. Data collectors repeatedly mentioned that kayayei said they participated because data collectors could speak their languages and identify with the group. Data collectors also reported multiple participants saying that they only spoke truthfully since the data collector spoke the same language. In addition, kayayei data collectors were well positioned to identify ineligible participants (e.g., beggars) who might have attempted to participate using fabricated responses to obtain the incentive.
3.3.3 Incentives
Incentives are increasingly used in research to motivate and recruit participants. The potential of incentives to coerce or to exert undue influence on participation is understandably controversial, particularly in studies where the research is risky and degrading (Grant and Sugarman 2004; Singer and Couper 2008). For minimal-risk, nondegrading human-subjects research that fulfils the usual ethical criteria, like this study, incentives often pose no ethical problems (Grant and Sugarman 2004; Singer and Couper 2008).
In practice, the initial five-cedi participation incentive operated as compensation for the actual and potential missed work that participants could be expected to forego in order to participate in this study. To make participation worthwhile, the participation incentive had to compensate participants for their time spent participating in the study (2 cedis) as well as for the time involved in traveling to the office and any potential transportation expenses (3 cedis). This incentive did not appear to be excessive. Only five ineligible people attempted to participate, and the data collection team heard no reports of people selling or bartering coupons. Data collectors did not identify any repeat participants. When asked to evaluate the quality of information that participants shared, data collectors assessed 97.0% of participants as providing high quality information, 2.1% as providing fair quality information, and 1.0% as providing low quality information. Data collectors reported that participants assessed as providing fair or low quality information tended to be shy, did not know their exact age, or needed to have questions repeated. No data collectors reported that they suspected the incentive affected participants’ responses, leading to lower quality data.
Lesson learned: Compensating participants for their time completing the survey may insufficiently motivate working individuals to participate. The participation incentive may need to include compensation for time traveling to the office and transportation expenses. The formative research phase should address these factors.
Participants also identified nonfinancial reasons for participation. They reported participating because the research team treated them with respect that they seldom received in Accra:
You see us to be human beings, like you. […] How they [in Accra] open their mouths to insult us, they don’t see us to be human beings like the way you see us to be human beings. (Participant, from the Upper East Region, 20s)
Others valued the opportunity to have their voices heard and to advocate for increased development and economic opportunities in northern Ghana. Whilst the in-depth interviews focused on participants’ migration histories and their use of health services for recent illness/injury, interview respondents frequently discussed their motivations for participating in the survey research. Many participants were hopeful that the findings from this research would translate into help:
God give you people more knowledge so that you people will help us at the north. (Participant and RDS seed, from the Northern Region, 20s)
Now when they are telling us what is the problem, they know that it will go outside to USA or London so that they [outsiders] will know their [kayayei’s] problems. (Translator, from the Northern Region, 30s)
The theme of beneficence emerged among respondents who hoped that the study would benefit their families and their communities. Some participants asked for assistance in paying the school fees of their children or siblings, for example. Whilst financial assistance was not provided by this research project, conducting the study out of the KYA office enabled the research team to raise awareness of local initiatives by nongovernmental organizations and to link participants with appropriate, albeit limited, services.
4. Discussion
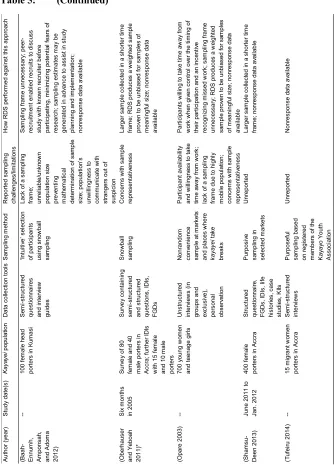
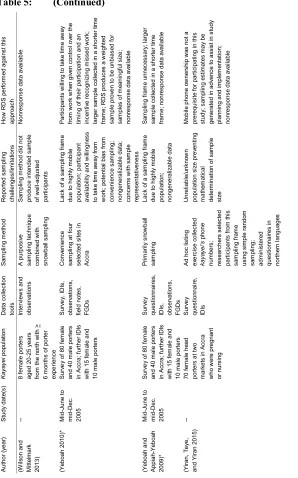
Sampling kayayei migrants using RDS required a nuanced understanding of both the participants’ experiences and the local community to ensure successful implementation and sufficient recruitment. Compared to other studies collecting data on kayayei, this study generated the most comprehensive dataset to date. It overcame many challenges and limitations reported in previous studies (Table 5) and permitted the collection of more data in a shorter timeframe.
Prior studies on kayayei report concerns with the representativeness of their samples (Opare 2003; Yeboah 2010; Addai 2011; Oberhauser and Yeboah 2011; Agyei, Kumi, and Yeboah 2016). To improve representativeness in this study and minimize known sources of nonparticipation bias, the formative research phase discussed past studies’ sampling challenges (Table 5) and potential solutions. By using RDS rather than a sampling frame generated from phone numbers, for example, this study included 64.8% of respondents who would have been excluded from prior research (Yiran, Teye, and Yiran 2015). Instead of requiring that participants speak Twi (Addai 2011), kayayei data collectors accommodated participants in multiple dialects. The kayayei data collectors also facilitated greater participation among individuals who were suspicious of outsiders, reducing that barrier to participation (Baah-Ennumh, Amponsah, and Adoma 2012).
By design, RDS minimized prior challenges regarding participant availability and willingness to take time away from work to engage in extended conversations (Opare 2003; Awumbila and Ardayfio-Schandorf 2008; Yeboah 2010). This study remained unaffected by the high degree of mobility that challenged others’ efforts to track participants and to collect data (Opare 2003; Yeboah and Appiah-Yeboah 2009; Yeboah 2010; Addai 2011), since participation required visiting a central office. Basing the research in a central office will have restricted potential recruits working and living outside the central business district; however, the surveys captured participants living in 29 communities and working in 44 places within Accra.
Lesson learned: For widely dispersed and highly mobile populations, multiple field sites will minimize participants’ need for transportation and will better capture their geographical distribution. If financial and personnel resource constraints make such an endeavor unfeasible, select the most appropriate site in close collaboration with stakeholders, including members of the target population.
recruitment during the formative research phase, this study did not obtain equilibrium for ethnic group or the closely related variables religion, region of birth, and place of residence in Accra. Such data cannot be generalised to the larger kayayei population. For the majority of kayayei migrants, linguistic differences between ethnic groups likely restricted cross-group recruitment and equilibrium. Though the survey did not capture all languages a participant spoke, the survey recorded the language of the interview. Ultimately, a minimum of one in seven participants spoke at least two languages. English- and Twi-speaking participants would have been well positioned to recruit across ethnic group, as would other multilingual participants who the survey questionnaire could not identify. It is possible that the sample’s bias towards well-connected respondents also restricted cross-group recruitment and equilibrium. Generalizations are stronger for variables pertaining to health (e.g., ever given birth, ever had a health problem caused by kayayoo work) and migration behaviours (e.g., send remittance(s), recommend kayayoo work to friend in the north) that obtained equilibrium.
Table 5: Sampling challenges/limitations among studies of kayayei in Ghana and how RDS performed against these approaches
Several sources of potential bias or imprecision affect RDS and this data. In addition to the previously mentioned methodological limitations and assumptions, RDS estimates are particularly sensitive to errors in reported PNS (Mills et al. 2014). This study refined the PNS question in an attempt to minimize such errors, and data collectors encouraged participants to spend time counting specific individuals in their networks before answering PNS questions. Participants are supposed to recruit both strong and weak ties, but the majority of participants (96.3%) reported knowing their recruiter ‘very well.’ The final sample appears biased towards well-connected respondents, which may lead to biased population proportion estimates. Yet among participants who knew their recruiter for three weeks or less (n = 35), 57.1% of participants reported knowing these new contacts ‘very well.’ Participants may have inflated the strength of their recruiter-recruit relationships, leading to an overestimation of strong ties.
Nonresponse bias and measurement errors also affect this survey data. Whilst participants returning to collect their recruitment payments provided nonresponse data for 16 potential recruits who declined coupons, 302 distributed recruitment coupons (33.0%) were unredeemed. Having no time to participate, fearing research, and lacking interest in the study contributed in part to nonresponses; however, the actual number of nonresponses is likely much lower than the number of unredeemed coupons. Informal discussions with participants revealed that coupon theft, coupon deterioration, and return migrations contributed to nonresponse. Quality checks built into the survey and participant flow process uncovered measurement errors, specifically nonsampling errors, that occurred on several known occasions when data collectors and respondents misunderstood survey questions. These errors were immediately discussed with the research team and corrected before the participant departed.
5. Conclusion
achievement of equilibrium. In such cases, researchers should consider alternative sampling methods or should consider narrowing their population to a group with ethnolinguistic overlap. Implementing RDS among a specific ethnolinguistic migrant group would likely facilitate achieving equilibrium with fewer waves. It is possible that these barriers may be weaker when implementing RDS among international migrants who originate from the same country if national identity supersedes intra-national identity, helping facilitate recruitment across ethnic groups.
Researchers studying migrants in LMIC should consider RDS if formative research indicates that the method is likely to be appropriate and well received by the study population. Formative research with members of the target population, community leaders, and key stakeholders was integral to the successful implementation of RDS in this study. This research included assessing logistical factors preimplementation (e.g., appropriate incentives, coupon design, whether personal networks are sufficient); however, the formative research also expanded the logistics of implementing RDS in order to identify specific factors regarding both the population and the place that could potentially affect implementation (e.g., kayayei are resistant to speak with outsiders given past experiences with census enumerators and talk of forcibly sending kayayei back north; participants may need to bring children with them in order to participate).
RDS may allow researchers in LMIC to stretch limited resources, as it has been found to be faster, less expensive, and easier to implement than other methods for examining hard-to-reach populations (Semaan, Lauby, and Liebman 2002; Salganik and Heckathorn 2004). Future studies implementing RDS among migrant populations in such settings should include members of the study population as data collectors and as advisors throughout the study to advise on the appropriateness and feasibility of implementing RDS. Although nonfinancial incentives may motivate potential recruits to participate in the study, incentives must recognize participants’ time, including participation as well as travel to and from the study site. In settings where a high rate of coupon deterioration may occur, coupon design must consider this factor.
migrants in LMIC, it can be a powerful tool to uncover and recruit hard-to-reach migrant populations.
6. Acknowledgements
References
Addai, I. (2011). Estimating remittances in the informal sector labour market in a developing economy: A micro-level evidence on Kayayoo migrants in Kumasi,
Ghana. The Social Sciences 6(4): 313‒317. doi:10.3923/sscience.
2011.313.317.
Agadjanian, V. and Zotova, N. (2012). Sampling and surveying hard-to-reach populations for demographic research: A study of female labor migrants in
Moscow, Russia. Demographic Research 26(5): 131‒150. doi:10.4054/Dem
Res.2012.26.5.
Agyei, Y.A., Kumi, E., and Yeboah, T. (2016). Is better to be a kayayei than to be unemployed: Reflecting on the role of head portering in Ghana’s informal
economy.GeoJournal 81(2): 293–318.doi:10.1007/s10708-015-9620-z.
Anarfi, J.K. and Appiah, M. (2009). The phenomenon of independent child migration in Ghana in the context of a globalised world. In: Anarfi, J.K. and Kwankye, S.O.
(eds.). Independent migration of children in Ghana. Legon: Sundel Services:
45‒70.
Awumbila, M. and Ardayfio-Schandorf, E. (2008). Gendered poverty, migration and
livelihood strategies of female porters in Accra, Ghana. Norsk Geografisk
Tidsskrift – Norwegian Journal of Geography 62(3): 171–179.
doi:10.1080/00291950802335772.
Baah-Ennumh, T.Y., Amponsah, O., and Adoma, M.O. (2012). The living conditions of
female head porters in the Kumasi metropolis, Ghana. Journal of Social and
Development Sciences3(7): 229‒244.
Bryant, J. (2014). Using respondent-driven sampling with ‘hard to reach’ marginalised young people: Problems with slow recruitment and small network size.
International Journal of Social Research Methodology 17(6): 599–611.
doi:10.1080/13645579.2013.811921.
Carballo-Diéguez, A., Balan, I., Marone, R., Pando, M.A., Dolezal, C., Barreda, V., Leu, C.-S., and Ávila, M.M. (2011). Use of respondent driven sampling (RDS) generates a very diverse sample of men who have sex with men (MSM) in
Buenos Aires, Argentina. PLoS One 6(11): e27447. doi:10.1371/
Crush, J. and Tawodzera, G. (2014). Medical xenophobia and Zimbabwean migrant
access to public health services in South Africa.Journal of Ethnic and Migration
Studies40(4): 655–670.doi:10.1080/1369183X.2013.830504.
Daily Express (2010, September 28). “Kayayei” numbers higher than anticipated.Daily
Express.http://statsghana.gov.gh/docfiles/news/Kayayei.pdf.
Daily Graphic (2010, September 28). Hectic time for census teams. Daily Graphic.
https://www.modernghana.com/news/298213/hectic-time-for-census-teams.html.
Day, C. (2014). Giving the vulnerable a voice: Ethical considerations when conducting
research with children and young people. In: Lunn, J. (ed.). Fieldwork in the
global South: Ethical challenges and dilemmas. London: Routledge: 192–205. Decker, M.R., Marshall, B.D., Emerson, M., Kalamar, A., Covarrubias, L., Astone, N.,
Wang, Z., Gao, E., Mashimbye, L., Delany-Moretlwe, S., Acharya, R., Olumide, A., Ojengbede, O., Blum, R.W., and Sonenstein, F.L. (2014). Respondent-driven sampling for an adolescent health study in vulnerable urban settings: A
multi-country study. Journal of Adolescent Health 55(6S): S6–S12.
doi:10.1016/j.jadohealth.2014.07.021.
Driedger, L. and Peters, J. (1977). Identity and social distance: Towards understanding
Simmel’s ‘The Stranger.’ Canadian Review of Sociology 14(2): 158–173.
doi:10.1111/j.1755-618X.1977.tb00339.x.
Evans, R. and Becker, S. (2009). Children caring for parents with HIV and AIDS:
Global issues and policy responses. Bristol: Policy Press.
Friberg, J.H. and Horst, C. (2014). RDS and the structure of migrant populations. In:
Tyldum, G. and Johnston, L. (eds.). Applying respondent driven sampling to
migrant populations: Lessons from the field. London: Palgrave Pivot: 17–26. Gile, K.J. and Handcock, M.S. (2010). Respondent-driven sampling: An assessment of
current methodology. Sociological Methodology 40(1): 285–327.
doi:10.1111/j.1467-9531.2010.01223.x.
Goel, S. and Salganik, M.J. (2009). Respondent-driven sampling as Markov chain
Monte Carlo. Statistics in Medicine 28(17): 2202–2229. doi:10.1002/sim.
3613.
Goel, S. and Salganik, M.J. (2010). Assessing respondent-driven sampling.
Proceedings of the National Academy of Sciences 107(15): 6743–6747.
Grant, R.W. and Sugarman, J. (2004). Ethics in human subjects research: Do incentives
matter? Journal of Medicine and Philosophy 29(6): 717–738.
doi:10.1080/03605310490883046.
GSS, GHS, and ICF Macro (2009). Ghana Demographic and Health Survey 2008. Calverton and Accra: Ghana Statistical Service, Ghana Health Service, and ICF
Macro.
https://dhsprogram.com/publications/publication-fr221-dhs-final-reports.cfm.
Heckathorn, D. (2007). Extensions of respondent driven sampling: Analyzing
continuous variables and controlling for differential recruitment. Sociological
Methodology 37(1): 151–207. doi:10.1111/j.1467-9531.2007. 00188.x.
Heckathorn, D.D. (1997). Respondent-driven sampling: A new approach to the study of
hidden populations. Social Problems 44(2): 174–199. doi:10.2307/
3096941.
Heckathorn, D.D. (2002). Respondent-driven sampling II: Deriving valid population
estimates from chain-referral samples of hidden populations. Social Problems
49(1): 11–34.doi:10.1525/sp.2002.49.1.11.
International Organization for Migration (2010).Integrated Biological and Behavioural
Surveillance Survey among migrant female sex workers in Nairobi, Kenya. Nairobi: International Organization for Migration.
Johnston, L., Rodriguez, L., and Napierala, J. (2014). Measuring personal network size
in RDS. In: Tyldum, G. and Johnston, L. Applying respondent driven sampling
to migrant populations: Lessons from the field. London: Palgrave Pivot: 27–36. Johnston, L., Thurman, T., Mock, N., Nano, L., and Carcani, V. (2010).
Respondent-driven sampling: A new method for studying street children with findings from
Albania. Vulnerable Children and Youth Studies 5(1): 1–11.
doi:10.1080/17450120903193923.
Kearney, H. (2013, November 22). Ghana’s female porters get family planning advice.
Keygnaert, I., Dialmy, A., Manco, A., Keygnaert, J., Vettenburg, N., Roelens, K., and Temmerman, M. (2014). Sexual violence and sub-Saharan migrants in Morocco: A community-based participatory assessment using respondent driven sampling.
Globalization and Health 10(32).doi:10.1186/1744-8603-10-32.
Khamsiriwatchara, A., Wangroongsarb, P., Thwing, J., Eliades, J., Satimai, W., Delacollette, C., and Kaewkungwal, J. (2011). Respondent-driven sampling on the Thailand–Cambodia border: I. Can malaria cases be contained in mobile
migrant workers? Malaria Journal 10(120): 1–11.
doi:10.1186/1475-2875-10-120.
Kubal, A., Shvab, I., and Wojtynska, A. (2014). Initiation of the RDS recruitment
process: Seed selection and role. In: Tyldum, G. and Johnston, L. Applying
respondent driven sampling to migrant populations: Lessons from the field.
London: Palgrave Pivot: 37–48.doi:10.1057/9781137363619_5.
Kwankye, S.O. and Addoquaye Tagoe, C. (2009). City life outside the home: The experiences of independent child migrants in Ghana. In: Anarfi, J.K. and
Kwankye, S.O. (eds.). Independent migration of children in Ghana. Legon:
Sundel Services.
Lattof, S.R. (2018). Health insurance and care-seeking behaviours of female migrants in
Accra, Ghana. Health Policy and Planning. doi:10.1093/heapol/
czy012.
Liu, H., Li, J., Ha, T., and Li, J. (2012). Assessment of random recruitment assumption
in respondent-driven sampling in egocentric network data. Social Networking
1(2): 13–21.doi:10.4236/sn.2012.12002.
Mills, H.L., Johnson, S., Hickman, M., Jones, N.S., and Colijn, C. (2014). Errors in
reported degrees and respondent driven sampling: Implications for bias. Drug
and Alcohol Dependence 142: 120–126. doi:10.1016/j.drugalcdep. 2014.06.015.
Montealegre, J., Risser, J., Selwyn, B., McCurdy, S., and Sabin, K. (2013). Effectiveness of respondent driven sampling to recruit undocumented Central American immigrant women in Houston, Texas for an HIV behavioral survey.
AIDS and Behavior 17(2): 719–727.doi:10.1007/s10461-012-0306-y.
Oakley, A. (1981). Interviewing women: A contradiction in terms. In: Roberts, H. (ed.).
Oberhauser, A.M. and Yeboah, M.A. (2011). Heavy burdens: Gendered livelihood
strategies of porters in Accra, Ghana. Singapore Journal of Tropical Geography
32(1): 22–37.doi:10.1111/j.1467-9493.2011.00417.x.
Okal, J., Raymond, H.F., Tun, W., Musyoki, H., Dadabhai, S., Broz, D., Nyamu, J., Kuria, D., Muraguri, N., and Geibel, S. (2016). Lessons learned from respondent-driven sampling recruitment in Nairobi: Experiences from the field.
BMC Research Notes 9(1): 1–13.doi:10.1186/s13104-016-1965-y.
Opare, J.A. (2003). Kayayei: The women head porters of southern Ghana. Journal of
Social Development in Africa 18(2): 33–48.
Parliament of the Republic of Ghana (2016). Parliamentary debates: Official report,
Friday, 4th March, 2016.Parliamentary Debates 83(24): 1889–2072.
Platt, L., Luthra, R., and Frere-Smith, T. (2015). Adapting chain referral methods to
sample new migrants: Possibilities and limitations. Demographic Research
33(24): 665–700.doi:10.4054/DemRes.2015.33.24.
Rudolph, A.E., Fuller, C.M., and Latkin, C. (2013). The importance of measuring and
accounting for potential biases in respondent-driven samples. AIDS and
Behavior 17(6): 2244–2252.doi:10.1007/s10461-013-0451-y.
Salganik, M. (2006). Variance estimation, design effects, and sample size calculations
for respondent-driven sampling. Journal of Urban Health 83(1): 98–112.
doi:10.1007/s11524-006-9106-x.
Salganik, M.J. and Heckathorn, D.D. (2004). Sampling and estimation in hidden
populations using respondent-driven sampling.Sociological Methodology 34(1):
193–239.doi:10.1111/j.0081-1750.2004.00152.x.
Salifu, M.I. (2015). Unpublished oral interview with Mohammed Salifu, Director and Founder of Kayayei Youth Association of Ghana. Conducted by S.R. Lattof. Semaan, S., Lauby, J., and Liebman, J. (2002). Street and network sampling in
evaluation studies of hiv risk-reduction interventions.AIDS Review 4: 213–223.
Shamsu-Deen, Z. (2013). Migrattion [sic] and health nexus: A case of female porters
(Kayayei) in Accra, Ghana. Research on Humanities and Social Sciences 3(3):
103–109.
Singer, E. and Couper, M.P. (2008). Do incentives exert undue influence on survey
participation? Experimental evidence.Journal of Empirical Research on Human
Spiller, M.W., Cameron, C., and Heckathorn, D.D. (2012). RDS Analysis Tool 7.1: User manual. Ithaca: Cornell University.
Tufeiru, A. (2014). The nexus of female capital and north–south labor migration in
Ghana: A potential remedy from microfinance. Journal of Developing Societies
30(1): 91–114.doi:10.1177/0169796X13504680.
Tyldum, G. and Johnston, L. (eds.) (2014). Applying respondent driven sampling to
migrant populations: Lessons from the field. London: Palgrave Pivot.
doi:10.1057/9781137363619.
Tyldum, G., Rodriguez, L., Bjørkhaug, I., and Wojtynska, A. (2014). Deciding on and
distributing incentives in RDS. In: Tyldum, G. and Johnston, L. (eds.).Applying
respondent driven sampling to migrant populations: Lessons from the field. London: Palgrave Pivot.
UNDESA (2013). Cross-national comparisons of internal migration: An update on global patterns and trends. New York: United Nations Department of Economic and Social Affairs.
United Nations (2015). Transforming our world: The 2030 agenda for sustainable development. Geneva: United Nations.
Volz, E. and Heckathorn, D.D. (2008). Probability based estimation theory for
respondent driven sampling.Journal of Official Statistics24(1): 79–97.
Volz, E., Wejnert, C., Cameron, C., Spiller, M., Barash, V., Degani, I., and Heckathorn, D.D. (2012). Respondent-driven sampling analysis tool (RDSAT). Ithaca: Cornell University. Version 7.1.
Wejnert, C., Pham, H., Krishna, N., Le, B., and DiNenno, E. (2012). Estimating design effect and calculating sample size for respondent-driven sampling studies of
injection drug users in the United States. AIDS and Behavior 16(4): 797–806.
doi:10.1007/s10461-012-0147-8.
White, R.G., Hakim, A.J., Salganik, M.J., Spiller, M.W., Johnston, L.G., Kerr, L., Kendall, C., Drake, A., Wilson, D., Orroth, K., Egger, M., and Hladik, W. (2015). Strengthening the reporting of observational studies in epidemiology for
respondent-driven sampling studies: ‘STROBE-RDS’ statement. Journal of
Wilson, A. and Mittelmark, M.B. (2013). Resources for adjusting well to work migration: Women from northern Ghana working in head porterage in Greater
Accra.Africa Today 59(4): 24‒38.doi:10.2979/africatoday.59.4.25.
Ye, Y., Wamukoya, M., Ezeh, A., Emina, J.B.O., and Sankoh, O. (2012). Health and demographic surveillance systems: A step towards full civil registration and vital
statistics system in sub-Sahara Africa? BMC Public Health 12(1): 741.
doi:10.1186/1471-2458-12-741.
Yeboah, M.A. (2010). Urban poverty, livelihood, and gender: Perceptions and
experiences of porters in Accra, Ghana. Africa Today 56(3): 42–60.
doi:10.2979/aft.2010.56.3.42.
Yeboah, M.A. and Appiah-Yeboah, K. (2009). An examination of the cultural and
socio-economic profiles of porters in Accra, Ghana. Nordic Journal of African
Studies18(1): 1–21.
Yiran, G.-S., Teye, J., and Yiran, G.B. (2015). Accessibility and utilisation of maternal
health services by migrant female head porters in Accra.Journal of International