S O F T W A R E
Open Access
Rapid, precise quantification of bacterial
cellular dimensions across a genomic-scale
knockout library
Tristan Ursell
1,2†, Timothy K. Lee
1†, Daisuke Shiomi
4,5, Handuo Shi
1, Carolina Tropini
3,9, Russell D. Monds
1,10,
Alexandre Colavin
3, Gabriel Billings
6, Ilina Bhaya-Grossman
1, Michael Broxton
7, Bevan Emma Huang
8,
Hironori Niki
4and Kerwyn Casey Huang
1,9*Abstract
Background:The determination and regulation of cell morphology are critical components of cell-cycle control, fitness, and development in both single-cell and multicellular organisms. Understanding how environmental factors, chemical perturbations, and genetic differences affect cell morphology requires precise, unbiased, and validated measurements of cell-shape features.
Results:Here we introduce two software packages,MorphometricsandBlurLab, that together enable automated, computationally efficient, unbiased identification of cells and morphological features. We applied these tools to bacterial cells because the small size of these cells and the subtlety of certain morphological changes have thus far obscured correlations between bacterial morphology and genotype. We used an online resource of images of the Keio knockout library of nonessential genes in the Gram-negative bacteriumEscherichia colito demonstrate that cell width, width variability, and length significantly correlate with each other and with drug treatments, nutrient changes, and environmental conditions. Further, we combined morphological classification of genetic variants with genetic meta-analysis to reveal novel connections among gene function, fitness, and cell morphology, thus suggesting potential functions for unknown genes and differences in modes of action of antibiotics.
Conclusions:MorphometricsandBlurLabset the stage for future quantitative studies of bacterial cell shape and intracellular localization. The previously unappreciated connections between morphological parameters measured with these software packages and the cellular environment point toward novel mechanistic connections among physiological perturbations, cell fitness, and growth.
Keywords:Microbiology, Cell biology, Cell morphology, Cell shape, Imaging, Chemical genomics, Principal component analysis, Segmentation, Microscopy, Computer vision
Background
Cell shape varies widely across bacterial species and has been linked to a diverse range of processes including adhe-sion, motility, pathogenicity, and differentiation [1]. The cell wall, a polymer network of sugar strands crosslinked by short peptides, is both necessary and sufficient for defin-ing a particular cell shape [2]. The precise morphology and
size of a cell is determined by the equilibrium between cell-wall mechanics and the turgor pressure caused by the high concentration of osmolytes inside the cell. Cell shape is maintained via feedback between the spatial pattern of cell-wall synthesis and the cell’s current geometry. In many rod-shaped organisms, especially those that grow by insert-ing cell wall material along the cylindrical region of the cell, the spatial pattern of growth is dictated by the cyto-skeletal protein MreB [3], an actin homolog that forms fila-ments bound to the inner membrane [4]. Cell volume is positively linked with fitness [5] and increases exponen-tially with growth rate on different nutrient sources that * Correspondence:[email protected]
†Equal contributors
1Department of Bioengineering, Stanford University, Stanford, CA 94305, USA 9Department of Microbiology and Immunology, Stanford University School
of Medicine, Stanford, CA 94305, USA
Full list of author information is available at the end of the article
vary growth rate over a wide range [6]. Moreover, in long-term evolution experiments withEscherichia coli, cell vol-ume more than doubled in all evolved lines after 10,000 generations [7]. Thus, an outstanding challenge in biology is to understand the mapping between genotype and mor-phological phenotypes.
To achieve such an understanding requires accurate quantification of cell morphology, particularly for very subtle changes such as the sub-micron curvature prefer-ence of MreB [3]. Several computational tools were previ-ously developed to quantify cell shape [8] in order to investigate intracellular organization and size homeostasis. The first software to interpolate cell contours at subpixel resolution wasPSICIC [9], which has generally been ap-plied to precisely quantify the subcellular localization of proteins. Simulations of point spread functions and their effects were combined with diffraction-limited imaging to achieve generational tracking and superior cell-division classification using ObjectJ [10, 11]. Another software package, Microbetracker, enabled segmentation of cells within a dense population [12]; Microbetracker and its successorOufti[13] were recently used to investigate the relationships among growth rate, elongation, and division in E. coli [14] and Caulobacter crescentus [15, 16]. For rod-shaped bacteria, most quantitative studies involving cell size have essentially studied the dynamics of cell length, since cell width is generally maintained during elongation. However, E. coli B/r cells that experienced a nutrient upshift from minimal to rich medium increased in cell width progressively over a few doublings [17, 18], consistent with bulk measurements linking growth rate and cell volume [6]. Further, mutations in MreB [5] and key cell-wall synthesis enzymes such as PBP2 [19] have been identified that alter cell width, and sublethal doses of antibiotics such as A22, which depolymerizes MreB, or mecillinam, which inhibits PBP2, lead to cell-width increases in a concentration-dependent manner [20]. Fi-nally, osmotic shock subtly alters cell width [21], signifying a change in turgor pressure. These data are evidence that the cell’s ability to determine its width may be important for its regulation of cell growth and fitness. While power-ful for many applications, packages such as PSICIC,
Microbetracker, andMicrobeJ[22], the latter of which has an elegant interface for tracking lineages and measuring sub-cellular localization [22–24], require a relatively large number of parameters; measurements of cell width are sensitive to the values of these parameters. Critically, our ability to link these subtle shape changes to underlying ge-notypes and chemical environments relies on accurate, unbiased morphological characterization.
The Keio collection of single, nonessential gene dele-tions inE. coliBW25113 is a powerful resource for discov-ering the phenotypes of genes of unknown function [25]. A visual screen of the qualitative shapes of the knockouts
in this collection revealed only one mutant that was obvi-ously non-rod-shaped [26].ΔrodZ cells are round, and it was subsequently found that RodZ interacts with MreB [26–28]. By profiling mutants from the Keio collection across hundreds of chemical treatments and environ-mental conditions, the functions of several genes have been discovered [29], such as the lipoprotein co-factors LpoA/B that activate the bifunctional penicillin binding proteins PBP1A/B, respectively [30]. This chemical-genomics approach can be used to cluster genes whose functions are related by virtue of a common pathway. Given previous discoveries of close connections between cell size and growth rate [6] and size and fitness [5], measuring cell shape and size in distinct environments will likely reveal the mechanisms of growth regulation. Moreover, imaging data may consti-tute a phenotype vector for individual cells or popula-tions of cells containing multiple morphological features such as cell width and length, curvature, and polar morphology [31]. A preliminary analysis of cell shape classified mutants in the Keio collection as short, normal, long, or very long (https://shigen.nig.ac.jp/ ecoli/strain/resource/keioCollection/list). However, de-tailed features such as cell width, size variability, or polar morphology have been difficult to accurately measure due to computational and software limitations.
regions of the cell [3], targeting new cell-wall growth to these locations and straightening the cell. When we mea-sured the correlations among cell size, cytoskeletal dynam-ics, and cell twisting for cells with a range of sizes generated via genetic or chemical perturbations, we found that cells systematically altered cell-wall structure as cell width increased [20]. In a morphological screen of the effects of depleting essential genes in B. subtilis, partial depletion led to cell-width outliers that highlighted both shape actuators (involved in cell-wall synthesis) and modu-lators (e.g., involved in DNA replication) [35]. However, the molecular mechanisms that regulate cell size are currently relatively unknown, motivating an unbiased examination of a genomic-scale library.
Here we present cell-shape measurement tools in a user-friendly, computationally efficient MATLAB-based package calledMorphometrics. This software segments cell contours from phase contrast images, fluorescence labeling of the cell surface, or cytoplasmic fluorescence, without assumptions about cell shape or size. Once cells have been identified, cell contours are determined via a straightforward, essentially parameter-free algorithm that yields robust measurements of cellular dimensions and contour curvature, allowing for automatic characterization of mutants with subtle variations in morphology. Since judging the accuracy of contour de-tection requires the ability to measure cell shape from im-ages of cells with known size, we also present a separate software platform,BlurLab, that generates simulated fluor-escence microscopy images [36]. While other software tools have been developed to generate fluorescence images for predefined shapes and structures [37], BlurLab addresses arbitrary distributions of fluorescent molecules in space and time and has the capacity to mimic a wide variety of tech-niques, features, and sources of noise in light microscopy. In the current investigation, we used Morphometrics to measure cell size from phase contrast and fluorescence im-ages, andBlurLabto validate our measurements and to de-termine the relative shifts in cellular dimensions between imaging modalities. We then applied Morphometrics to quantify cell shape and size across ~14,000 images of the Keio collection, revealing an inverse correlation between cell width and the robustness of cell-shape maintenance. Finally, we demonstrated that cell-shape parameters such as width and length correlate with particular chemical sensitivities. Ultimately, we envision that Morphometrics and Blurlab
will provide fast, reproducible quantification of cell shape as well as the ability to test quantitative models, thus comple-menting canonical tools for biochemistry and cell biology.
Implementation and Results
Assessment of the consistency of cell contours determined by different imaging modalities
To facilitate quantitative analysis of contours from cells with a wide variety of shapes and sizes, we sought to
implement an algorithm that made no assumptions about specific cell shapes and that extracted a parameter-free con-tour not subject to user biases. The Morphometrics algo-rithm can be conceptualized in two stages. First, with a small number of user-defined parameters, discrete‘objects’ are detected as contiguous groups of pixels through water-shed and distance-transform segmentation. Second, a smooth parameter-free contour defining the boundary of each object is calculated by treating the image intensity as a metric surface on which contour‘energy’can be minimized, with the segmented object boundary as an initial contour guess. Further information about the algorithm can be found in theMorphometricsuser manual included with the software download. Three types of images can be used for contour detection: i) phase contrast images, in which the cell interior appears dark; ii) interior fluorescence images, e.g. from uniformly distributed cytoplasmic fluorescent pro-teins; and iii) peripheral fluorescence images, e.g. from membrane dye. Calculating the magnitude of the image gradient transforms the first two image types into an inten-sity map similar to that given by a fluorescence marker on the surface, which constitutes the common basis for calculating contours.
corrected by translating the contour coordinates by an amount appropriate to the particular imaging system; these translation values can be determined visually using the in-cluded post-processing contour viewing software.
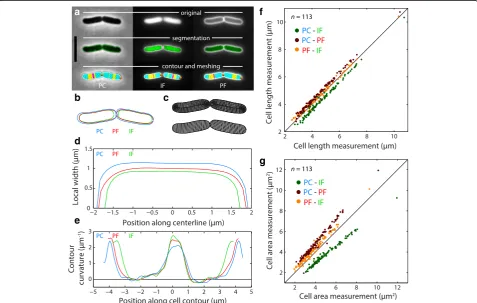
To illustrate the capabilities ofMorphometricsfor con-tour detection, we stained E. coli cells expressing cyto-plasmic GFP with the surface marker Alexa 594-conjugated Wheat Germ Agglutinin [3] and imaged the cells using phase contrast and epifluorescence micros-copy (Fig. 1a, top). Morphometrics successfully seg-mented isolated and dividing cells (Fig. 1a, middle) from all three imaging modalities (phase contrast (PC), inter-ior fluorescence (IF), and peripheral fluorescence (PF)), leading to three sets of contours, with the PF contour exterior to the IF contour as expected (Fig. 1b). The meshlines for these cells (Fig. 1c) define a cellular grid
that can be associated with regions of the contour or cell midline that show positive or negative curvature (Fig. 1a, bottom).
From these cells and their associated meshline grids, we measured width profiles along the midline, obtaining values that increased from 0 at the two poles to ~1 μm near the middle of the cell (Fig. 1d). As previously reported [39], there was little intracellu-lar variability in cell width along the midline away from the poles, and all three profiles showed similar variability (Fig. 1d). The contour measurements repre-sented an approximately cylindrical body with hemi-spherical endcaps (Fig. 1d), although all three contour measurements displayed slight variations in curvature (Fig. 1e) that were previously shown to correlate with MreB localization [3, 40].
a
b
d
c
f
g
e
Fig. 1Quantitation demonstrates consistency among contour measurements from different imaging modalities, despite small differences.aE. coli
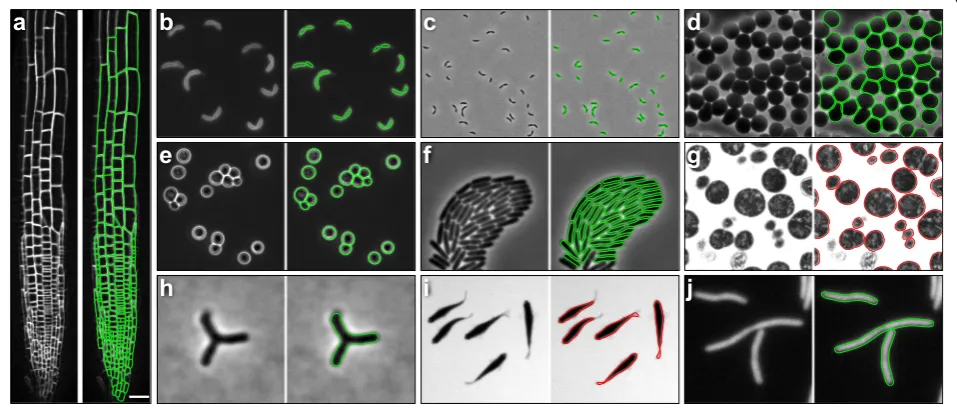
PC, IF, and PF images are expected to provide distinct positions of cell boundaries. Across many cells, there were strong correlations among length measurements from the three modalities; lengths from PC images were consistently larger than those from IF or PF images by ~400 nm (Fig. 1f). Similar comparative behavior was observed in cell width measurements (Additional file 1: Figure S1). The combined effects of shifts in width (Fig. 1d, Additional file 1: Figure S1) and length (Fig. 1f ) led to an increasing divergence in the area measurements of the three imaging modalities across many cells (Fig. 1g). Nonethe-less, all three imaging modalities were highly correlated, indicating a consistent picture of cellular dimensions that can be applied to wide variety of organisms. To demon-strate the utility ofMorphometrics for unbiased contour detection across a wide range of object shapes, we analyzed PF images of the root tissue of Arabidopsis thaliana plants (Fig. 2a), PF (Fig. 2b) and PC images (Fig. 2c) of curved rod-like Caulobacter crescentus, PC images of red blood cells (Fig. 2d), brightfield images of budding yeast Saccharomyces cerevisiae (Fig. 2e), PC images of dense Pseudomonas aeruginosa communities (Fig. 2f ), transmission electron microscopy images of
Neisseria gonorrhoeae (Fig. 2g), PC images of branched
Bifidobacterium breve DSM20213 (Fig. 2h), brightfield images of zebrafish (Fig. 2i), and IF images of filamentous
E. coli (Fig. 2j). In all cases, Morphometrics successfully segmented the cells or organisms, regardless of shape or imaging modality.
Simulated fluorescence microscopy for validation of quantitative analyses
Given the differences in cellular dimensions extracted from PC, IF, and PF data (Fig. 1), we wondered which modality accurately represented cell size. Other experimental meth-odologies with higher resolution such as electron micros-copy still do not provide a“true”measure of cell size, since sample preparation likely perturbs the cell, for example by disrupting turgor pressure. To identify a strategy for com-paring measurements with known geometric parameters, we developed BlurLab, a software package that generates simulated fluorescence images.BlurLabtakes as input a set of locations of fluorescent molecules and convolves these locations with a point spread function (PSF) to generate a simulated image. The PSF can be directly measured for a particular microscope and objective using sub-diffraction-limited particles such as quantum dots or fluorescent beads; alternatively,BlurLabcan generate a PSF for a given set of objective parameters (numerical aperture, wavelength, mag-nification, index of refraction, and pixel size). BlurLabcan also mimic camera noise, thermal noise, and shot noise, yielding simulated images that are more realistic for head-to-head comparison with experimental images. Additional
BlurLab functionalities include simulation of imaging at other focal planes for creatingz-stacks, modeling total in-ternal reflection fluorescence imaging, boxcar averaging of positions during simulated time-lapse imaging to account for particle motion during the exposure interval, simulating mean-field and stochastic photobleaching, and simulating
Fig. 2Morphometricsachieves unbiased contour extraction across a wide range of cell shapes and object types, including densely packed communities and tissues.aContours extracted from the root-tip cells of anA. thalianaplant expressing a YFP-fusion to the membrane protein LTI6B, showing that
fluorescence recovery after photobleaching. Detailed de-scriptions of these functionalities and examples can be found in theBlurLabmanual.
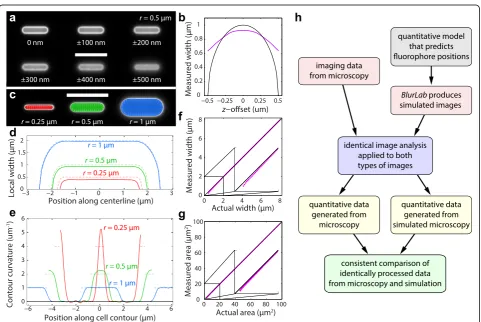
To validate cellular dimensions and morphological fea-tures ofE. coli cells, we usedBlurLab to generate sets of uniformly distributed molecules at high density on the sur-face of cylinders with hemispherical endcaps over a range of cell widths and lengths. For an in silico cell with width 1 μm, we also simulated images of the same cell at focal planes up to 500 nm above and below the cell midplane (Fig. 3a). As the cell goes out of focus, the image attributes used for contour fitting become blurred by the PSF. None-theless, a bright boundary, the signature of surface-bound fluorescence, was evident in each image (Fig. 3a). We then applied Morphometricsto each simulated image and suc-cessfully resolved a cell contour at eachz-offset. The width
measured from these cell contours peaked at the midplane and monotonically decreased as the offset from the cell midplane increased (Fig. 3b). These data illustrate the im-portance of midplane focus, and provide an estimate of the deviation in width measurement when using out-of-focus cells. Interestingly, these data also show that the measured cell width (magenta line in Fig. 3b) is more robust to changes in the focal plane than the actual cell width at a given focal plane (black line in Fig. 3b).
Next, we examined the contours extracted from simulated images of in silico cells with different widths (Fig. 3c). The error in the extracted contour was practically zero for widths greater than 2 μm, but increased as cell width decreased (Fig. 3d). The extracted contours were smaller than the true midplane contours because the cell curvature introduced light from out-of-focus planes in
which the cellular cross-section had a smaller width; for cell widths much larger than the wavelength of light used for imaging, this curvature became negligible (Fig. 3d). To de-termine the accuracy of other geometric measurements, we computed the curvature along the cell contour. The curva-ture along a 2-μm in silico cell was relatively accurate everywhere except in the transition region between the cy-linder and the hemispherical end caps (Fig. 3e), where the PSF blurred the step-function curvature into a smooth transition. For a 1-μm in silico cell, the curvature remained accurate along the cylindrical portions of the cell (where the measured curvature was close to zero), although there was a slight overestimate of the curvature at the ends of the cell (Fig. 3e); this error was exacerbated as the cell width was further narrowed (Fig. 3e). We note that these system-atic morphological errors with decreasing cell size result from the limitations of light imaging at wavelengths com-parable to the cell size, not from imprecision in fluores-cence simulation or contour detection.
To evaluate the overall bias, we usedBlurLabto compute the difference between the actual and measured widths and areas for in silico cells 400 nm to 8 μm in width and a range of cell lengths in the peripheral fluorescence modal-ity. The error in the width asymptotically approached zero, and was essentially undetectable in cells with width above ~1.5μm (Fig. 3f). Error in area behaved in a similar fashion, regardless of cell length (Fig. 3g), indicating that PF mea-surements provide an accurate measure of cell length with-out systematic bias. This application illustrates the intended purpose and power of BlurLab: to assess the accuracy of imaging data in the context of a particular model by con-sistently comparing analyses of both experimental and sim-ulated images (Fig. 3h).
Morphological analysis of a genomic library of nonessential gene deletions
To demonstrate the efficacy ofMorphometrics for rapid quantification of bacterial morphology, we analyzed ~14,000 images of the Keio collection, a collection of single knockouts of all non-essential genes in E. coli
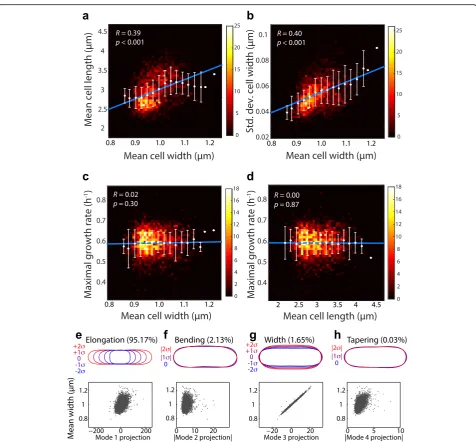
[25]. We obtained phase contrast images from the Na-tional BioResource Project and segmented isolated cells from each strain in an unbiased manner (Methods). Mean cell width varied from ~0.8 to 1.2 μm, and mean cell length varied from ~2.5 to 4μm (Fig. 4a, Additional file 2: Figure S2). Interestingly, mean cell width and length were strongly correlated with each other (R= 0.39, Student’s t-test: p< 0.001, Fig. 4a), as were mean cell width and length standard deviation (Additional file 3: Figure S3). From our data, we determined the distri-butions of morphological parameters such as mean width and length across the population of cells for each strain. Moreover, we utilized the meshing of each cell to
measure the local cell width (distance across the cell at each point along the contour), from which we calculated the mean variability in cell width within individual cells in the population. Both the standard deviation across the population (Fig. 4b) and the intracellular fractional width variability (Additional file 4: Figure S4) increased with mean cell width, indicating that cells are increasingly un-able to maintain cell width as they widen. Interestingly, although wild-type E. colicells increase in cell size with nutrient-induced increases in growth rate [6], we found no significant correlations between maximal growth rate (as determined by microplate growth curves in [41]) and cell width (Fig. 4c) or length (Fig. 4d). We note that these results are not contradictory; for example, a previ-ous study showed that cell size is not correlated with growth rate within a population of cells [14].
To identify other morphological correlations across the library or in particular strains, we aligned 150 cell contours from each strain of the Keio collection for which at least 150 contours were available in order to calculate an average cell shape, and performed PCA on the covariance matrix to identify significant shape varia-tions. The first two, three, and four PCA modes accounted for 97.3%, 99.0% and 99.3% of variation in cell shape, respectively (Fig. 4e–h), and by far the greatest amount of variation was accounted for by a mode that clearly captured elongation (Fig. 4e). This result, which is not surprising for rod-shaped growth, indicates that length changes are the most significant source of shape variation within the Keio library. Nonetheless, the next three modes representing cell bending, widening, and ta-pering, respectively (Fig. 4f–h), have potential for reveal-ing cells or strains that are shape outliers. Mean width strongly correlated with PCA mode 3 (width, R= 0.998, Student’st-test:p< 0.001) and with the projection from mode 1 (length, R= 0.43, Student’s t-test: p< 0.001) (Fig. 4e, bottom), as expected based on the correlation between length and width noted above (Fig. 4a). There was also a significant correlation between mean width and mode 4 (tapering, R= 0.49, Student’s t-test:
Identification of chemical sensitivities correlated with cellular dimensions
Given the range of cellular dimensions across the Keio library and the correlations between morphological observables, we wanted to systematically probe the physiological significance of cell size. We previously found that the MreBA53T mutation led to wider cells during growth in a variety of carbon sources; cells harboring this mutation had a large gain in fitness when competed
hypothesized that wider cells may be more sensitive to A22 than thinner cells, and more generally that morphological observables may be predictive of the severity of phenotypes in certain environments or chemical treatments.
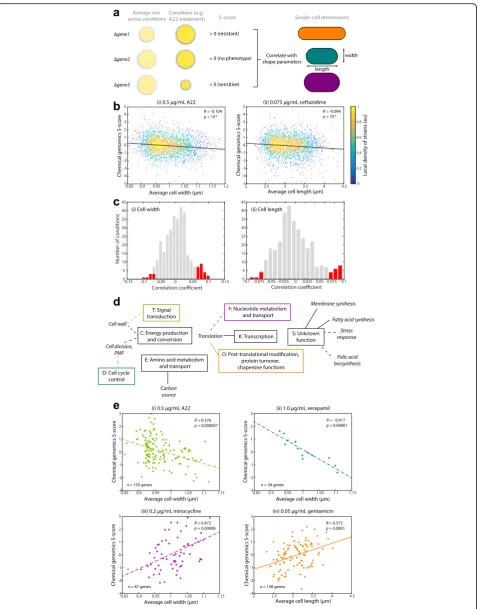
To test these hypotheses, we made use of an existing chemical genomics dataset [29] in which the Keio collec-tion was grown as colonies on agar plates in 324 condicollec-tions including media, drugs, dyes, detergents, metal stresses, and hormones. From the colony sizes, a statistic called an S-score was previously computed to represent the severity of the growth phenotype in each condition [29]; a positive/ negative S-score indicates more/less growth than expected based on the changes to wildtype in the condition of inter-est (Fig. 5a). We compared our quantification of cellular di-mensions with the previously reported S-scores from treatment with 0.5μg/mL A22 for each knockout, and de-tected a significant correlation between cell width and S-score (Fig. 5b, Pearson correlation coefficient R= −0.10, Student’s t-test: p< 10−6), consistent with our hypothesis. We then wondered whether other chemical or environ-mental perturbations were correlated with mean cell width or length. We calculated the correlation coefficients of these quantities with each of the 324 condition datasets (Fig. 5c) and determined statistical significance with a Bonferroni correction for multiple hypothesis testing (Methods). For cell width, A22 treatment was the most sig-nificant negative correlate; six other compounds (ignoring differences in concentration) also exhibited significant negative correlation (Additional file 6: Table S1) [29]. Of these compounds, three also targeted cell-wall synthesis (the β-lactam cefaclor, the peptide bacitracin, and the amino acid derivative D-cycloserine), possibly indicating hibitory effects similar to those of A22. The list also in-cluded compounds targeting the membrane or proton motive force (the Ca2+-channel inhibitor verapamil and the detergent taurocholate) and translation (50S inhibitor erthyromycin) (Fig. 5d), indicating potential links between cell-width control and other metabolic processes.
There were 15 unique conditions for which the knock-outs had S-scores with significant positive correlation with cell width (Additional file 6: Table S2) [29], indicating that wider cells were less sensitive. These conditions target a broader range of cellular processes, including DNA/RNA, stress, and fatty acid metabolism in addition to the ribo-some and cell-wall and membrane synthesis (Additional file 6: Table S2) [29]. Carbonyl cyanide m-chlorophenyl hydrazone, a proton ionophore that inhibits oxidative phosphorylation, was positively correlated at all tested concentrations (Additional file 6: Table S2) [29]; interest-ingly, we observed in a separate study that this ionophore increases bending rigidity, which is an expected outcome of increased cell width based on the mechanics of a thin cylindrical shell. There was also a compound (theophyl-line) with an unknown target that exhibited a significant
positive correlation with cell width (Additional file 6: Table S2) [29], indicating that cell-size profiling may be an effective tool for associating chemical exposure with the molecular pathways that control cell morphology.
We next considered correlations of S-scores with cell length. Six conditions were associated with significant nega-tive correlations (Fig. 5cii): high iron, treatment with the cell-wall inhibitor ceftazidime, and four carbon-source limi-tations, which may reflect the known coupling of cell size with nutrient-dependent growth rate [6]. Of the eight con-ditions positively correlated with length (Fig. 5cii), several involved ribosomal inhibitors (n= 3), inhibitors of fatty acid and membrane synthesis (n= 2), or DNA/RNA synthesis (n= 1). In some cases, correlations indicated differences in the underlying mode of drug action; for example, the ceph-alosporin cefaclor was positively correlated with cell length, while the structurally similar compound ceftazidime was negatively correlated with length.
with ribosomal inhibitor sensitivity (Fig. 5eiv). As with cell width, strains deleted for genes of unknown function had lengths both positively and negatively correlated with some treatments (Additional file 6: Table S4) [29], further supporting the importance of these genes to cell shape. Taken together, our correlation analyses based on the entire Keio collection and subdivided into Clusters of Orthologous Groups suggest that a variety of intracellular factors, beyond those controlling cell-wall synthesis or turgor, contribute to the cell’s determination of its size, and that responses to some extracellular perturbations have general connections with cell size (Fig. 5d). These correlations were revealed through precise and automated measurements of cellular dimensions that were enabled by our open-source software packagesMorphometricsandBlurLab.
Discussion and Conclusions
Quantifying subtle connections among environmental conditions, cellular morphology, and genetics is a crucial step in uncovering new biological roles for genes and their corresponding phenotypes. Microscopy is a powerful workhorse for establishing these connections, but the spatial constraints of light microscopy and our computa-tional assumptions limit the set of measurable morpho-logical perturbations. We developed Morphometrics and
BlurLabto expand the utility of multiple imaging modal-ities and to minimize the presence of bias in image-based analyses. Here, we applied our software to bacteria, which are a technically challenging class of organisms to explore with quantitative image processing due to their small size and strong connections among fitness, genotype, and morphology. We envision that combining the morpho-logical measurement techniques of Morphometrics with the unbiased hypothesis testing ofBlurLabwill enable the quantitative and automated characterization of libraries targeting cell morphology (such as libraries constructed through error-prone PCR mutagenesis of genes that affect cell morphology [5] and the set of Keio mutants with a
range of cell lengths and widths (Fig. 4)) as well as the growing collection of genomic libraries, including knock-out libraries of Salmonella typhimurium [44] and transposon-based libraries of the pathogen Pseudomonas aeruginosa [45] and the gut commensalBacteroides the-taiotaomicron [46]. The relationships we discovered among cell length, cell width, and width variability (Fig. 4) across the genomic-scale Keio collection suggest general links between cellular physiology and cell size [42]. Screens that used the Keio collection to reveal new pheno-types previously focused on growth [29] or envelope perme-ability [47], both of which naturally led to studies of cell shape. Since Morphometrics is sensitive to small morpho-logical variations and can rapidly analyze tens of thousands of images, it crucially enables forward genetic screens for genes or mutations that affect a morphological phenotype.
The relatively high throughput and unbiased morpho-logical characterization of Morphometrics make it well-suited to the study of morphological and functional connections in genomic libraries, to the screening of en-vironmental conditions like carbon sources, osmolytes, and antibiotics, and to analyses of dynamic cell-cycle data via time-lapse imaging [48]. Similarly, new rules of cellular homeostasis encoded by time-dependent morph-ology in many organisms [14–16, 49] will be accessible with our software, particularly when spatial resolution is limited. It remains to be seen to what extent detailed measurements of cell morphology will be sufficient to uncover relationships among genotypes, chemical treat-ments, and cell morphology (Fig. 5); in some cases, lack of shape variation or degeneracies in shape phenotypes may make identification of a morphological signature challenging. For instance, drug treatments and attendant mutations could lead to global changes in gene expres-sion such as a stress response that result in similar non-specific changes in cell morphology (e.g. filamentation).
While we have focused on bacteria, Morphometrics is amenable to morphological analysis of any organism for
(See figure on previous page.)
which high-contrast images can be obtained, especially walled organisms like plants (Fig. 2a) [50] and fungi (Fig. 2e) [51]. Morphometrics has relatively few parameters and makes no assumptions about object morphology, strengths that are important considerations when tuning algorithms to examine new organisms with poorly understood morph-ology and growth cycles and when developing custom scripts for post-processing, such as the detection of spatial and temporal morphological correlations [3], detailed localization studies [3], and testing of biophysical models [39]. The small size of bacteria leads to a smaller visual dy-namic range, which makes human observers more prone to apophenia (seeing meaningful patterns in random data).
BlurLabhas a wide array of potential applications in defin-ing null hypotheses about fluorescence imagdefin-ing data, such as the expected distribution of a uniform surface label at the poles versus the lateral walls of a rod-shaped cell, the integrated intensity of a homogeneous cytoplasmic label such as 4′,6-diamidino-2-phenylindole (DAPI) as a function of cell size (given that wider cells have a greater fraction of the cell volume at the edges of the focal plane), and the level of noise in cytoplasmic distributions as a function of molecule number for testing whether noise is spatially het-erogeneous. BlurLab can be coupled to any analysis plat-form, and should have growing utility given recent genome-scale screens of fluorescence localization [48, 52]. We note that evaluations of null hypotheses should also be important for eukaryotic cells, for which it is equally critical to connect molecular models to diffraction-limited fluores-cence images [53].
For large data sets, image processing must be efficient in terms of computational resources and speed. The data structures, algorithms, and graphical user interfaces of
Morphometrics andBlurlabare designed to exploit opti-mized image processing algorithms in MATLAB and to allow users to easily construct seamless custom scripts for data analysis [3]; these packages also take advantage of the large body of user-generated algorithms online (e.g. the MATLAB File Exchange). Additionally, high-level programming languages reduce the barrier to acquire coding skills and ensure that the varied and general needs of the quantitative imaging community for custom ana-lysis can be met. Speed limitations in MATLAB can be re-solved by recoding computationally intensive subroutines in C, as we did inMorphometrics. WhileMorphometrics
andBlurLabenable new levels of precision and quantita-tive morphological characterization, like any analysis soft-ware they have certain limitations. Ultimately, the precision of contours fromMorphometricsis limited by i) image quality, specifically spatial resolution, signal-to-noise, evenness of illumination, dynamic range of intensities, and degree of saturation; and ii) sample char-acteristics such as object contrast, the proximity of ob-jects and attendant overlap in the light fields, the degree
of blurring due to motion, and, where fine segmentation is desired, the number and degree of construction points in the image outline. As a general rule of thumb, images that are visually difficult to segment will be difficult for
Morphometricsto segment.BlurLabis a simulator for lin-ear optical microscopy, but specific nuances of an optical system or objective, atypical or time-dependent noise sources, camera chip-specific noise, and sample-dependent effects (e.g. absorption, quenching, or a sample’s index of refraction) all reduce the accuracy of simulation. Similar limitations will very likely apply to
anyimage analysis or simulation software.
The importance of quantitation in cell biology will con-tinue to increase, and the small size of bacteria and lack of organelles make both Morphometrics and BlurLab espe-cially important for identifying subtle localization and morphological phenotypes in these organisms. However, despite the breadth and versatility ofMorphometrics and
BlurLab, significant challenges for computational image processing remain, including reconstruction of three-dimensional morphology in both static and dynamic envi-ronments, segmentation and tracking of dense and/or highly dynamic groups of objects, and the development of algorithms to process different imaging modalities such as fluorescence recovery after photobleaching, total internal reflection fluorescence, and super-resolution imaging.
MorphometricsandBlurLabshould serve as a foundation for developing new software to address these challenges.
Precise quantification of cell morphology in bacteria and eukaryotes will undoubtedly be a valuable tool for mapping genotype-phenotype relationships. Extending the analysis of static images carried out here to the dynamic response of cells to perturbations, for instance in micro-fluidic chambers, can further reveal the physiological basis of a particular phenotype, such as the mechanism of cell death during entry into stationary phase in anE. coli mu-tant with disrupted lipid homeostasis [54]. Excitingly, cell morphology can even serve as a diagnostic tool for asses-sing cellular states in diseases such as cancer. To fully ex-ploit the information obtained through these studies, we must develop and implement computational tools with high levels of accuracy and precision and couple them to methods for validation and compelling visual display. As demonstrated here, Morphometrics and BlurLab consti-tute an important step toward meeting these goals.
Methods
Single-cell imaging
grown in lysogeny broth (LB) with shaking at 37 °C to ex-ponential phase (optical density at 620 nm∼0.5). One milli-liter of cells was washed with fresh LB via centrifugation (10,000 g) and resuspension in 1 mL of LB and subse-quently diluted 1:10 into 1 mL of fresh LB. Twenty-five mi-croliters of a once-frozen 1 mg/mL fluorescent Wheat Germ Agglutinin stock solution were added, and the sam-ple was briefly vortexed. Cells were incubated with the lec-tin for 20 min (approximately one cell cycle) with shaking at 37 °C in the dark. After incubation, cells were washed twice with fresh LB to remove excess lectin, and 5μL of la-beled cells were deposited onto a LB + 1% agarose pad, allowed to air dry on the pad, and promptly sealed with a #1.5 coverslip in a 125-μL FastWell (Grace BioLabs).
Labeled cells were imaged on a Nikon Eclipse Ti-E inverted fluorescence microscope with a 100X (NA 1.40) oil-immersion objective (Nikon Instruments). Images were collected using an Andor DU885 EMCCD camera (Andor Technology). Cells were maintained at 37 °C during imaging with an active-control environmental chamber (Haison-Tech). Images were collected usingμManager v. 1.3 [55].
Imaging of the Keio collection
Images were obtained from the NBRP. In brief, to obtain these images, strains from the Keio collection were inocu-lated in LB with 30 μg/mL kanamycin and grown over-night in 96-well plates at 30 °C. Cells were then diluted in LB plus 30μg/mL kanamycin and grown for 2 h at 37 °C. After reaching exponential phase, cells were harvested via centrifugation and resuspended in LB. These cells were mounted on poly-lysine-coated cover-slips, fixed with methanol, washed with water, and stained with (4′ ,6-dia-midino-2-phenylindole).
Analysis of Keio images
Keio collection images from the NBRP (1–3 per strain) were analyzed using Morphometrics. Cells with segmen-tation errors were filtered by only including contours with two identifiable points of high curvature (corre-sponding to the poles). This filtering eliminated segmen-tation errors, which we evaluated with manual curation (data not shown). Cell length and width were calculated according to a mesh representation of the cell contour computed by Morphometrics. Subsequent analyses only included strains for which 150 cells passed the above fil-tering step (2465/4353 strains).
PCA
Shape-variation modes were calculated from cell contours using PCA. Briefly, the center of mass and principal axes were calculated from the cell contour and the coordinates were shifted and rotated to a common alignment. Then, 300 equally spaced points were sampled from the cell con-tour using linear interpolation. A mean cell concon-tour was
subtracted from each contour and principal components were calculated using the eigenvalue decomposition of the covariance matrix between contour coordinates.
Statistical analyses
For comparing cell morphology to chemical sensitivity (Fig. 5), Pearson’s correlation coefficient between the mean cell width or length against the S-score across all strains was calculated for each chemical condition. The statistical significance of each correlation was calculated with a Stu-dent’st-distribution, Bonferroni-corrected with the number of conditions.
Additional files
Additional file 1: Figure S1.Width measurements were similarly consistent as length and area across imaging modalities, despite small differences. (A) Differences in width measurements among imaging modalities displayed the same behaviors as length (Fig. 1f) and area (Fig. 1g) across a wide range of cell widths. In the legend, the first and second modality for each color correspond to the measurements along they- andx-axes, respectively. Black line isy=x. (B) Histograms of cell widths in (A) as measured by each imaging modality. (PDF 132 kb)
Additional file 2: Figure S2.For all strains used for PCA, the analyzed population had a broad distribution of cell lengths. (PDF 412 kb)
Additional file 3: Figure S3.Morphological analysis of the Keio collection reveals correlations between cell width and length standard deviation. Contours from cells from each Keio deletion strain were extracted from images acquired from the NBRP repository and used to compute the length and mean width along the cell midline for each cell. The standard deviation of cell length for each strain represents the natural variation in length due to progression through the cell cycle. As expected based on the correlation of mean width and length (Fig. 4a), mean width was correlated with length standard deviation. White circles and error bars were obtained by binning strains by mean width; blue lines are the fit to binned averages.Ris Pearson’s correlation coefficient;
p-value was computed with Student’st-test. (PDF 112 kb)
Additional file 4: Figure S4.Morphological analysis of the Keio collection reveals correlations between cell width and intracellular width variability. Contours from cells from each Keio deletion strain were extracted from images acquired from the NBRP repository and used to compute the mean width and width profile across each cell. For each cell, we then computed the standard deviation of the width profile divided by the mean width to obtain the intracellular width variability. White circles and error bars were obtained by binning strains by mean width; blue lines are the fit to binned averages.Ris Pearson’s correlation coefficient;p-value was computed with Student’st-test. (PDF 111 kb)
Additional file 5: Figure S5.Scaled PCA avoids emphasis on large cell length variation. PCA of the correlation matrix attributes greater variation to width, bending, and tapering modes than unscaled PCA (Fig. 4e–h). (A) Representations of the PCA modes around the mean shape. Mode 1 represents tip morphology. Modes 2–4 represent bending, widening, and tapering, respectively. (B) Scatter plots of the proportion of modes 1–4 and mean cell width of each strain demonstrate that width is correlated with variation represented by each of modes 1–4. (PDF 685 kb)
Additional file 6: Table S1.Conditions in chemical genomics screen from [29] that exhibit negative correlation between mean cell width and S-score withp-value less than 0.000154 (Bonferroni multiple-hypothesis correction top< 0.05 across 324 conditions; see Methods).Table S2.
mean cell width and S-scores withp-value less than 0.000154 (Bonferroni multiple-hypothesis correction top< 0.05 across 324 conditions; see Methods). *: description from [29] and generously provided by Athanasios Typas.Table S4.Pairs of COGs and conditions in chemical genomics screen from [29] that exhibit correlations between mean cell length and S-scores withp-value less than 0.000154 (Bonferroni multiple-hypothesis correction top< 0.05 across 324 conditions; see Methods). *: description from [29] and generously provided by Athanasios Typas. (DOCX 101 kb)
Acknowledgments
The authors thank Nassos Typas and the Huang lab for helpful discussions. We also thank members of the Shaevitz, Gitai, and Garner laboratories for software alpha testing and feedback. Images used in Fig. 2 were kindly provided by David Quint (Fig. 2a), Leigh Harris (Fig. 2b,c), Wikipedia under the Creative Commons License (Fig. 2d), Liam Holt (Fig. 2e), Cynthia Whitchurch (Fig. 2f), Joseph Dillard (Fig. 2g), Anthony Shiver (Fig. 2h), Tristan Ursell (Fig. 2i), and Handuo Shi (Fig. 2j).
Funding
This work was supported by a Bio-X Postdoctoral Fellowship and University of Oregon seed funds (to T.S.U.), a Stanford Interdisciplinary Graduate Fellowship (to C.T.), a Siebel Scholars Graduate Fellowship (to T.K.L.), support from a National Institutes of Health (NIH) Biotechnology Training Grant (to T.K.L.), an Agilent Fellowship and a Stanford Interdisciplinary Graduate Fellowship (to H.S.), a Bio-X Senior Postdoctoral Fellowship (to R.D.M.), a Stanford Graduate Fellowship and a Gerald J. Lieberman Fellowship (to A.C.), a National Science Foundation Graduate Research Fellowship (to G.B.), National Institutes of Health Director’s New Innovator Award DP2OD006466 (to K.C.H.), National Science Foundation CAREER award MCB-1149328 (to K.C.H.), and a Bio-X Interdisciplinary Initiatives Program seed grant (to K.C.H.). The funders had no role in the design of the study, nor in the collection, analysis, or interpretation of data or writing of the manuscript.
Availability of data and materials
Morphometrics, an associated manual, and the images used in Fig. 2 can be downloaded at https://simtk.org/projects/morphometrics.BlurLaband an associated manual can be downloaded at https://simtk.org/projects/blurlab. All data generated or analysed during this study are included in this published article and its supplementary information files, or are available upon request.
Authors’contributions
TU, TKL, and KCH conceived the project. TU was the major developer of both
MorphometricsandBlurLab, and carried out experimental measurements and simulations to measure cell size through different modalities. Keio collection images were generated by DS and HN, and TKL analyzed the images and performed PCA. HS, CT, RDM, AC, and GB contributed toMorphometrics
development. IBG contributed toMorphometricsvalidation. CT contributed to
BlurLabvalidation. MB contributed the PSF generation algorithm inBlurLab. BEH provided input on statistics. The paper was written by TU, TKL, and KCH. All authors read and approved the final manuscript.
Competing interests
The authors declare that they have no competing interests.
Consent for publication
Not applicable.
Ethics approval and consent to participate
Not applicable.
Author details
1Department of Bioengineering, Stanford University, Stanford, CA 94305, USA. 2
Department of Physics, University of Oregon, Eugene, OR 97403, USA. 3Biophysics Program, Stanford University School of Medicine, Stanford, CA
94305, USA.4National Institute of Genetics, Shizuoka, Japan.5Current address: Department of Life Science, Rikkyo University, Tokyo, Japan.6Department of Physics, Stanford University, Stanford, CA 94305, USA.7Department of Computer Science, Stanford University, Stanford, CA 94305, USA.8Janssen Research and Development, Menlo Park, CA 94025, USA.9Department of Microbiology and Immunology, Stanford University School of Medicine,
Stanford, CA 94305, USA.10Current address: Synthetic Genomics Inc., La Jolla, CA 92037, USA.
Received: 18 August 2016 Accepted: 6 January 2017
References
1. Young KD. The selective value of bacterial shape. Microbiol Mol Biol Rev. 2006;70(3):660–703.
2. Holtje JV. Growth of the stress-bearing and shape-maintaining murein sacculus ofEscherichia coli. Microbiol Mol Biol Rev. 1998;62(1):181–203. 3. Ursell TS, Nguyen J, Monds RD, Colavin A, Billings G, Ouzounov N, et al.
Rod-like bacterial shape is maintained by feedback between cell curvature and cytoskeletal localization. Proc Natl Acad Sci U S A. 2014;111(11):E1025–34. 4. Salje J, van den Ent F, de Boer P, Lowe J. Direct Membrane Binding by
Bacterial Actin MreB. Mol Cell. 2011;43(3):478–87.
5. Monds RD, Lee TK, Colavin A, Ursell T, Quan S, Cooper TF, et al. Systematic perturbation of cytoskeletal function reveals a linear scaling relationship between cell geometry and fitness. Cell Rep. 2014;9(4):1528–37. 6. Schaechter M, Maaloe O, Kjeldgaard NO. Dependency on medium
and temperature of cell size and chemical composition during balanced grown ofSalmonella typhimurium. J Gen Microbiol. 1958; 19(3):592–606.
7. Lenski RE, Travisano M. Dynamics of adaptation and diversification: a 10,000-generation experiment with bacterial populations. Proc Natl Acad Sci. 1994; 91(15):6808–14.
8. Young JW, Locke JC, Altinok A, Rosenfeld N, Bacarian T, Swain PS, et al. Measuring single-cell gene expression dynamics in bacteria using fluorescence time-lapse microscopy. Nat Protoc. 2012;7(1):80–8.
9. Guberman JM, Fay A, Dworkin J, Wingreen NS, Gitai Z. PSICIC: noise and asymmetry in bacterial division revealed by computational image analysis at sub-pixel resolution. PLoS Comput Biol. 2008;4(11):e1000233.
10. Syvertsson S, Vischer NO, Gao Y, Hamoen LW. When Phase Contrast Fails: ChainTracer and NucTracer, Two ImageJ Methods for Semi-Automated Single Cell Analysis Using Membrane or DNA Staining. PLoS One. 2016; 11(3):e0151267.
11. Vischer NOE, Verheul J, Postma M, van den Berg van Saparoea B, Galli E, Natale P, Gerdes K, Luirink J, Vollmer W, Vicente M, den Blaauwen T. Cell age dependent concentration ofEscherichia colidivisome proteins analyzed with ImageJ and ObjectJ. Front Microbiol. 2015;6:586.
12. Sliusarenko O, Cabeen MT, Wolgemuth CW, Jacobs-Wagner C, Emonet T. Processivity of peptidoglycan synthesis provides a built-in mechanism for the robustness of straight-rod cell morphology. Proc Natl Acad Sci U S A. 2010;107(22):10086–91.
13. Paintdakhi A, Parry B, Campos M, Irnov I, Elf J, Surovtsev I, et al. Oufti: an integrated software package for high-accuracy, high-throughput quantitative microscopy analysis. Mol Microbiol. 2016;99(4):767–77.
14. Taheri-Araghi S, Bradde S, Sauls JT, Hill NS, Levin PA, Paulsson J, et al. Cell-size control and homeostasis in bacteria. Curr Biol. 2015;25(3):385–91.
15. Campos M, Surovtsev IV, Kato S, Paintdakhi A, Beltran B, Ebmeier SE, et al. A constant size extension drives bacterial cell size homeostasis. Cell. 2014;159(6): 1433–46.
16. Iyer-Biswas S, Wright CS, Henry JT, Lo K, Burov S, Lin Y, et al. Scaling laws governing stochastic growth and division of single bacterial cells. Proc Natl Acad Sci U S A. 2014;111(45):15912–7.
17. Grover NB, Zaritsky A, Woldringh CL, Rosenberger RF. Dimensional rearrangement of rod-shaped bacteria following nutritional shift-up. I. Theory. J Theor Biol. 1980; 86(3):421–39.
18. Woldringh CL, Grover NB, Rosenberger RF, Zaritsky A. Dimensional rearrangement of rod-shaped bacteria following nutritional shift-up. II. Experiments withEscherichia coliB/r. J Theor Biol. 1980;86(3):441–54. 19. Philippe N, Alcaraz JP, Coursange E, Geiselmann J, Schneider D.
Improvement of pCVD442, a suicide plasmid for gene allele exchange in bacteria. Plasmid. 2004;51(3):246–55.
20. Tropini C, Lee TK, Hsin J, Desmarais SM, Ursell T, Monds RD, et al. Principles of bacterial cell-size determination revealed by cell-wall synthesis perturbations. Cell Rep. 2014;9(4):1520–7.
21. Rojas E, Theriot JA, Huang KC. Response ofEscherichia coligrowth rate to osmotic shock. Proc Natl Acad Sci U S A. 2014;111(21):7807–12. 22. Ducret A, Quardokus EM, Brun YV. MicrobeJ, a tool for high throughput
23. Alberge F, Espinosa L, Seduk F, Sylvi L, Toci R, Walburger A, et al. Dynamic subcellular localization of a respiratory complex controls bacterial respiration. eLife. 2015;4:e05357.
24. Jiang C, Brown PJ, Ducret A, Brun YV. Sequential evolution of bacterial morphology by co-option of a developmental regulator. Nature. 2014; 506(7489):489–93.
25. Baba T, Ara T, Hasegawa M, Takai Y, Okumura Y, Baba M, et al. Construction ofEscherichia coliK-12 in-frame, single-gene knockout mutants: the Keio collection. Mol Syst Biol. 2006;2:2006 0008.
26. Shiomi D, Sakai M, Niki H. Determination of bacterial rod shape by a novel cytoskeletal membrane protein. EMBO J. 2008;27(23):3081–91.
27. Alyahya SA, Alexander R, Costa T, Henriques AO, Emonet T, Jacobs-Wagner C. RodZ, a component of the bacterial core morphogenic apparatus. Proc Natl Acad Sci U S A. 2009;106(4):1239–44.
28. Bendezu FO, Hale CA, Bernhardt TG, de Boer PA. RodZ (YfgA) is required for proper assembly of the MreB actin cytoskeleton and cell shape inE. coli. EMBO J. 2009;28(3):193–204.
29. Nichols RJ, Sen S, Choo YJ, Beltrao P, Zietek M, Chaba R, et al. Phenotypic landscape of a bacterial cell. Cell. 2011;144(1):143–56.
30. Typas A, Banzhaf M, van den Berg van Saparoea B, Verheul J, Biboy J, Nichols RJ, et al. Regulation of peptidoglycan synthesis by outer-membrane proteins. Cell. 2010;143(7):1097–109.
31. Huang KC. Applications of imaging for bacterial systems biology. Curr Opin Microbiol. 2015;27:114–20.
32. Pincus Z, Theriot JA. Comparison of quantitative methods for cell-shape analysis. J Microsc. 2007;227(Pt 2):140–56.
33. Keren K, Pincus Z, Allen GM, Barnhart EL, Marriott G, Mogilner A, et al. Mechanism of shape determination in motile cells. Nature. 2008;453(7194):475–80. 34. Dye NA, Pincus Z, Fisher IC, Shapiro L, Theriot JA. Mutations in the
nucleotide binding pocket of MreB can alter cell curvature and polar morphology inCaulobacter. Mol Microbiol. 2011;81(2):368–94. 35. Peters JM, Colavin A, Shi H, Czarny TL, Larson MH, Wong S, et al. A
Comprehensive, CRISPR-based Functional Analysis of Essential Genes in Bacteria. Cell. 2016;165(6):1493–506.
36. Ursell T, Huang K. Resolution limits of optical microscopy and the mind. Biomed Comput Rev. 2011;7:27–9.
37. Gardner MK, Odde DJ, Bloom K. Hypothesis testing via integrated computer modeling and digital fluorescence microscopy. Methods. 2007;41(2):232–7.
38. Ursell TS, Trepagnier EH, Huang KC, Theriot JA. Analysis of surface protein expression reveals the growth pattern of the Gram-negative outer membrane. PLoS Comput Biol. 2012;8(9):e1002680.
39. Furchtgott L, Wingreen NS, Huang KC. Mechanisms for maintaining cell shape in rod-shaped Gram-negative bacteria. Mol Microbiol. 2011;81(2):340–53. 40. Billings G, Ouzounov N, Ursell T, Desmarais SM, Shaevitz J, Gitai Z, et al.De
novomorphogenesis in L-forms via geometric control of cell growth. Mol Microbiol. 2014;93(5):883–96.
41. Auer GK, Lee TK, Rajendram M, Cesar S, Miguel A, Huang KC, et al. Mechanical genomics: high-throughput identification of bacterial cell-stiffness modulators. Cell Syst. 2016;2:402–11.
42. Harris LK, Theriot JA. Relative Rates of Surface and Volume Synthesis Set Bacterial Cell Size. Cell. 2016;165(6):1479–92.
43. Galperin MY, Makarova KS, Wolf YI, Koonin EV. Expanded microbial genome coverage and improved protein family annotation in the COG database. Nucleic Acids Res. 2015;43(Database issue):D261–9.
44. Porwollik S, Santiviago CA, Cheng P, Long F, Desai P, Fredlund J, et al. Defined single-gene and multi-gene deletion mutant collections inSalmonella enterica
sv Typhimurium. PLoS One. 2014;9(7):e99820.
45. Lee SA, Gallagher LA, Thongdee M, Staudinger BJ, Lippman S, Singh PK, et al. General and condition-specific essential functions ofPseudomonas aeruginosa. Proc Natl Acad Sci U S A. 2015;112(16):5189–94.
46. Cullen TW, Schofield WB, Barry NA, Putnam EE, Rundell EA, Trent MS, et al. Gut microbiota. Antimicrobial peptide resistance mediates resilience of prominent gut commensals during inflammation. Science. 2015;347(6218):170–5. 47. Paradis-Bleau C, Kritikos G, Orlova K, Typas A, Bernhardt TG. A genome-wide
screen for bacterial envelope biogenesis mutants identifies a novel factor involved in cell wall precursor metabolism. PLoS Genet. 2014;10(1): e1004056.
48. Kuwada NJ, Traxler B, Wiggins PA. Genome-scale quantitative characterization of bacterial protein localization dynamics throughout the cell cycle. Mol Microbiol. 2015;95(1):64–79.
49. Brown PJ, de Pedro MA, Kysela DT, Van der Henst C, Kim J, De Bolle X, et al. Polar growth in the Alphaproteobacterial order Rhizobiales. Proc Natl Acad Sci U S A. 2012;109(5):1697–701.
50. Huang KC, Ehrhardt DW, Shaevitz JW. The molecular origins of chiral growth in walled cells. Curr Opin Microbiol. 2012;15(6):707–14.
51. Zhou Z, Munteanu EL, He J, Ursell T, Bathe M, Huang KC, et al. The contractile ring coordinates curvature-dependent septum assembly during fission yeast cytokinesis. Mol Biol Cell. 2015;26(1):78–90.
52. Werner JN, Chen EY, Guberman JM, Zippilli AR, Irgon JJ, Gitai Z. Quantitative genome-scale analysis of protein localization in an asymmetric bacterium. Proc Natl Acad Sci U S A. 2009;106(19):7858–63.
53. Rafelski SM, Viana MP, Zhang Y, Chan YH, Thorn KS, Yam P, et al. Mitochondrial network size scaling in budding yeast. Science. 2012;338(6108):822–4. 54. Sutterlin HA, Shi H, May KL, Miguel A, Khare S, Huang KC, et al. Disruption of
lipid homeostasis in the Gram-negative cell envelope activates a novel cell death pathway. Proc Natl Acad Sci U S A. 2016;113: E1565–74.
55. Edelstein A, Amodaj N, Hoover K, Vale R, Stuurman N. Computer control of microscopes using µManager. Current protocols in molecular biology/ edited by Frederick M Ausubel [et al.]. 2010; Chapter 14: Unit14 20.
• We accept pre-submission inquiries
• Our selector tool helps you to find the most relevant journal
• We provide round the clock customer support
• Convenient online submission
• Thorough peer review
• Inclusion in PubMed and all major indexing services
• Maximum visibility for your research
Submit your manuscript at www.biomedcentral.com/submit