Open Access
Research article
A comprehensive functional analysis of tissue specificity of human
gene expression
Zoltán Dezső*
†1, Yuri Nikolsky
†1, Evgeny Sviridov
2, Weiwei Shi
1,
Tatiana Serebriyskaya
2, Damir Dosymbekov
2, Andrej Bugrim
1,
Eugene Rakhmatulin
1, Richard J Brennan
1, Alexey Guryanov
2, Kelly Li
3,
Julie Blake
3, Raymond R Samaha
3and Tatiana Nikolskaya
2Address: 1GeneGo, Inc. Renaissance Drive, St. Joseph, MI 49085, USA, 2Vavilov Institute of General Genetics, Russian Academy of Sciences,
Gubkina Str, Moscow, Russia and 3Applied Biosystems, Inc, Lincoln Center Drive, Foster City, CA 94404, USA
Email: Zoltán Dezső* - [email protected]; Yuri Nikolsky - [email protected]; Evgeny Sviridov - [email protected]; Weiwei Shi - [email protected]; Tatiana Serebriyskaya - [email protected]; Damir Dosymbekov - [email protected]; Andrej Bugrim - [email protected]; Eugene Rakhmatulin - [email protected]; Richard J Brennan - [email protected];
Alexey Guryanov - [email protected]; Kelly Li - [email protected]; Julie Blake - [email protected]; Raymond R Samaha - [email protected]; Tatiana Nikolskaya - [email protected]
* Corresponding author †Equal contributors
Abstract
Background: In recent years, the maturation of microarray technology has allowed the genome-wide analysis of gene expression patterns to identify tissue-specific and ubiquitously expressed ('housekeeping') genes. We have performed a functional and topological analysis of housekeeping and tissue-specific networks to identify universally necessary biological processes, and those unique to or characteristic of particular tissues.
Results: We measured whole genome expression in 31 human tissues, identifying 2374
housekeeping genes expressed in all tissues, and genes uniquely expressed in each tissue. Comprehensive functional analysis showed that the housekeeping set is substantially larger than previously thought, and is enriched with vital processes such as oxidative phosphorylation, ubiquitin-dependent proteolysis, translation and energy metabolism. Network topology of the housekeeping network was characterized by higher connectivity and shorter paths between the proteins than the global network. Ontology enrichment scoring and network topology of tissue-specific genes were consistent with each tissue's function and expression patterns clustered together in accordance with tissue origin. Tissue-specific genes were twice as likely as housekeeping genes to be drug targets, allowing the identification of tissue 'signature networks' that will facilitate the discovery of new therapeutic targets and biomarkers of tissue-targeted diseases. Conclusion: A comprehensive functional analysis of housekeeping and tissue-specific genes showed that the biological function of housekeeping and tissue-specific genes was consistent with tissue origin. Network analysis revealed that tissue-specific networks have distinct network properties related to each tissue's function. Tissue 'signature networks' promise to be a rich source of targets and biomarkers for disease treatment and diagnosis.
Published: 12 November 2008
BMC Biology 2008, 6:49 doi:10.1186/1741-7007-6-49
Received: 29 October 2008 Accepted: 12 November 2008
This article is available from: http://www.biomedcentral.com/1741-7007/6/49
© 2008 Dezső et al; licensee BioMed Central Ltd.
Background
The issue of tissue and cell-type specificity of gene expres-sion is central to human biology and biomedicine. It impacts such fundamental problems as tissue ontogene-sis, evolution and carcinogenesis. It is generally believed that the most relevant disease biomarkers and drug targets predominantly are found among proteins specific for the tissue the disease affects. In 1965 Watson et al. described genes universally expressed to maintain cellular functions as 'housekeeping' (HK) genes [1]. Comprehensive experi-mentation in this area was, however, limited until, in the 1990s, microarrays enabled 'genome-wide' snapshots of gene expression. Numerous studies on tissue-specific expression have since been published [2-8], identifying between 451 and 1789 genes [4] as a HK core on different microarray platforms. There is no standard method for assigning a gene as HK, and no comprehensive functional analysis of HK and tissue-specific genes has previously been done.
Here we report the identification of 2374 HK genes, based on a novel study of gene expression in 31 human tissues on a whole-genome ABI array. We set up a definitive 'HK baseline' for gene expression across tissues, and compared previously published HK data sets with ours. We also identified gene sets uniquely expressed in individual tis-sues and groups of tistis-sues, and generated tissue-specific merged metabolic/signaling 'signature networks'. Both HK and tissue-specific genes were subjected to a compre-hensive, three-phase functional analysis, including gene set enrichment across four ontologies, network topology analysis and tissue-specific network analysis. We clustered tissues into groups according to expression patterns and network parameters, and revealed associations between HK and tissue-specific genes with human diseases and drug targets.
Results
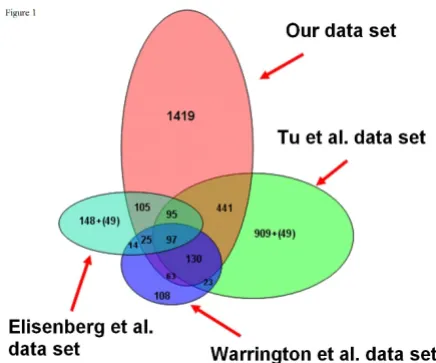
Definition of housekeeping and tissue-specific genes Whole-genome gene expression was analyzed in 31 human tissues using an ABI human genome array with probe sets for 27,868 individual human genes. A relatively conservative ten-fold 'signal-to-noise' ratio (SN10) across all three replicate arrays for each tissue was applied to identify the transcripts present in all tissues (HK set, see Methods). The SN10 HK set comprised 2374 genes (Addi-tional file 1). We compared this set with four sets of HK genes published previously: a set of 535 genes from 11 tis-sues on a Affymetrix HuGeneFL array [3]; 1789 genes from 79 tissues on custom 33,698 gene array [4]; 574 genes from 47 tissues on a 7500 gene Affymtrix U95A array [2] and 451 genes from 19 tissues on Affymetrix HuGeneFL arrays [5]. Our HK set overlapped with between 42 and 82% of these sets, although only 97 genes were common between the four larger sets. Furthermore,
there was 80% overlap between our set and the intersec-tion of the previous studies (Figure 1). Our set contained 1419 additional HK genes not previously identified.
Genes uniquely expressed in only one of the 31 tissues (at the SN10 cut-off) were defined as tissue specific. Tissue-specific sets varied in size from four genes for thymus to 484 genes for testis, with an average size of 43.8 genes, or 30.9 genes for somatic tissues only (excluding testis) (Table 1, Additional file 2). The gene set uniquely expressed in testis was substantially larger than those for somatic tissues, and highly enriched in meiosis-specific genes, confirming recent findings [9,10]. Around 40% of a recently published human testis specific gene set [11] overlapped with our SN10 set.
An alternative method, using the Student's t-test, was also applied to identify tissue-specific genes. Functional analy-sis showed striking similarities in the biological processes encompassed in the genes specific to each tissue between the t-test and the threshold-based methods (description of method and results in Additional file 3).
Ontological analysis of housekeeping and tissue-specific genes
We conducted enrichment analysis of HK and tissue-spe-cific sets across four functional ontologies: canonical pathway maps, gene ontology (GO) processes, GeneGo (GG) process networks, and diseases, using the
hypergeo-Comparison between housekeeping gene sets Figure 1
Comparison between housekeeping gene sets. The
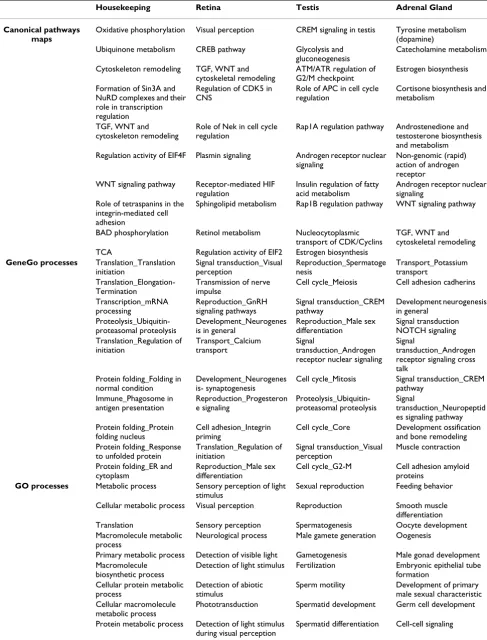
metric distribution [12] and Gene Set Enrichment Analy-sis (GSEA) algorithms [13] to determine enrichment. The hypergeometric p-values for the ten top-scored entities in each ontology for the HK set are shown in Table 2 and Additional file 4. 'Oxidative phosphorylation' was the highest scored canonical pathway map (p < 10–77). This vital, ATP-yielding pathway is the terminal part of cellular respiration, in which electrons are transferred through the electron transport chain (ETC). Almost all subunits of the ETC protein complexes were expressed in the HK set (Fig-ure 2(I)). The second-highest scored map depicts another essential process in the mitochondrial respiratory chain, ubiquinone metbolism (p < 10–40). Ubiquitin-proteaso-mal proteolysis was among the highest scored GG process networks (p < 10–26), with virtually all essential proteins included in the HK gene set (Figure 2(II)). GG process ontology is a set of 120 networks covering most critical cellular processes. Each GG process comprises 100 to 350 functionally related proteins. Unlike GO terms, where proteins are not necessarily connected, the proteins in GG
processes are linked via physical interactions, and can be visualized as networks. They therefore represent the signal flow and metabolic flux within each process. Translation initiation was another high-scored GG process (Figure 2(III)), with many translation initiation factors repre-sented in the HK set. In GO biological processes, cellular metabolism, translation and RNA processing were among the top ten scoring categories. Neoplasm by site (p < 10– 16) and breast neoplasm (p < 10–14) were the top-scored diseases (Table 2). Additionally, enrichment analysis of canonical pathway maps showed that nine out of the top ten maps are directly connected to 'growth' and 'viability' (Additional file 5).
Using the GSEA procedure [13] across the same ontolo-gies produced similar distributions (data not shown). Importantly, HK sets from the previously published stud-ies were generally enriched in similar categorstud-ies to our own HK set across all four ontologies. For example, oxida-tive phosphorylation, cytoskeleton remodeling, transla-tion and macromolecule biosynthetic process were among the top-scoring maps and processes for all HK sets (Additional file 4). Functional analysis of the unique parts of HK sets showed differences among top-scoring proc-esses and maps. Our unique (not yet identified) HK genes showed enrichment with metabolic, translation and cell-cycle processes, validating the part of the HK set which was not identified by previous studies. Unique parts of some of the other sets, however, showed enrichment of more specific processes such as immune, inflammatory and cardiac-specific processes (Additional file 6).
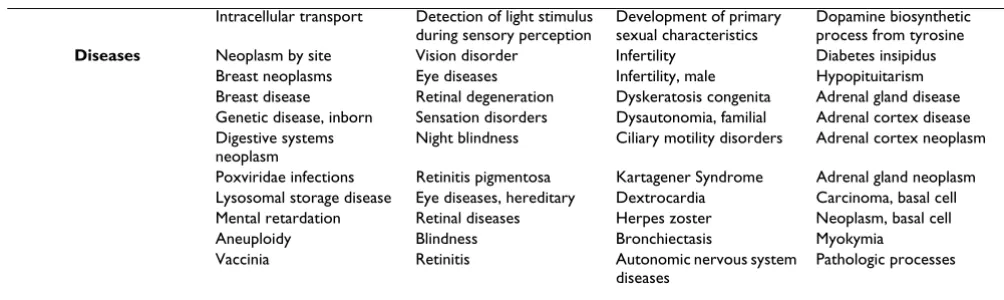
All 31 tissue-specific gene lists were subjected to the same enrichment procedures as the HK set (Additional file 7). In most cases, p-value distributions of top-scored path-ways, processes and diseases were strikingly consistent with the tissue of origin. For instance, 190 retina-specific genes were enriched for eye-specific categories in all four ontologies (Table 2). Visual perception (Figure 3(I)) and retinoid metabolism, both highly specific for retina tissue, were among the top ten scored pathways maps. The top-scored GG process network was Signal transduction_Visual perception (Table 2). All ten top-scored GO processes were related to vision, including sen-sory perception of light stimuli, visual perception and detection of visible light. All ten top-scored diseases were eye diseases, including retinal degradation, night blind-ness and retinitis pigmentosa. Adrenal gland genes were enriched in disease categories including diabetes insip-idus, adrenal gland diseases and adrenal cortex diseases (Table 2). The testis-specific set was highly enriched in cell cycle (meiosis), DNA exchange and cell division in all three process ontologies (canonical pathways, GO proc-esses and GG procproc-esses). The top-scored diseases included male infertility, dyskeratosis congenita and familial
dys-Table 1: Number of housekeeping and tissue-specific genes
Tissues SN10
Housekeeping 2374
Liver 22
Skeletal muscle 37
Fetal liver 16
Testis 484
Placenta 38
Bone marrow 63
Skin 75
Adrenal gland 13
Prostate 14
Trachea 16
Small intestine 35
Peripheral blood lymphocytes 49
Mammary gland 16
Tonsil 24
Thymus 4
Spleen 14
Fetal kidney 5
Thyroid 7
Brain 34
Heart 26
Lung 16
Salivary gland 17
Ovary 15
Pancreas 20
Fetal thymus 8
Colon 9
Spinal cord 24
Retina 190
Kidney 17
Uterus 12
Fetal brain 61
Average 43.8
Table 2: Enrichment analysis of housekeeping and three selected tissue-specific gene sets.
Housekeeping Retina Testis Adrenal Gland
Canonical pathways maps
Oxidative phosphorylation Visual perception CREM signaling in testis Tyrosine metabolism (dopamine)
Ubiquinone metabolism CREB pathway Glycolysis and gluconeogenesis
Catecholamine metabolism
Cytoskeleton remodeling TGF, WNT and cytoskeletal remodeling
ATM/ATR regulation of G2/M checkpoint
Estrogen biosynthesis
Formation of Sin3A and NuRD complexes and their role in transcription regulation
Regulation of CDK5 in CNS
Role of APC in cell cycle regulation
Cortisone biosynthesis and metabolism
TGF, WNT and cytoskeleton remodeling
Role of Nek in cell cycle regulation
Rap1A regulation pathway Androstenedione and testosterone biosynthesis and metabolism
Regulation activity of EIF4F Plasmin signaling Androgen receptor nuclear signaling
Non-genomic (rapid) action of androgen receptor
WNT signaling pathway Receptor-mediated HIF regulation
Insulin regulation of fatty acid metabolism
Androgen receptor nuclear signaling
Role of tetraspanins in the integrin-mediated cell adhesion
Sphingolipid metabolism Rap1B regulation pathway WNT signaling pathway
BAD phosphorylation Retinol metabolism Nucleocytoplasmic transport of CDK/Cyclins
TGF, WNT and cytoskeletal remodeling TCA Regulation activity of EIF2 Estrogen biosynthesis
GeneGo processes Translation_Translation initiation Signal transduction_Visual perception Reproduction_Spermatoge nesis Transport_Potassium transport Translation_Elongation-Termination
Transmission of nerve impulse
Cell cycle_Meiosis Cell adhesion cadherins
Transcription_mRNA processing Reproduction_GnRH signaling pathways Signal transduction_CREM pathway Development neurogenesis in general Proteolysis_Ubiquitin-proteasomal proteolysis Development_Neurogenes is in general
Reproduction_Male sex differentiation Signal transduction NOTCH signaling Translation_Regulation of initiation Transport_Calcium transport Signal transduction_Androgen receptor nuclear signaling
Signal
transduction_Androgen receptor signaling cross talk
Protein folding_Folding in normal condition
Development_Neurogenes is- synaptogenesis
Cell cycle_Mitosis Signal transduction_CREM pathway Immune_Phagosome in antigen presentation Reproduction_Progesteron e signaling Proteolysis_Ubiquitin-proteasomal proteolysis Signal transduction_Neuropeptid es signaling pathway Protein folding_Protein
folding nucleus
Cell adhesion_Integrin priming
Cell cycle_Core Development ossification and bone remodeling Protein folding_Response
to unfolded protein
Translation_Regulation of initiation
Signal transduction_Visual perception
Muscle contraction
Protein folding_ER and cytoplasm
Reproduction_Male sex differentiation
Cell cycle_G2-M Cell adhesion amyloid proteins
GO processes Metabolic process Sensory perception of light stimulus
Sexual reproduction Feeding behavior
Cellular metabolic process Visual perception Reproduction Smooth muscle differentiation Translation Sensory perception Spermatogenesis Oocyte development Macromolecule metabolic
process
Neurological process Male gamete generation Oogenesis
Primary metabolic process Detection of visible light Gametogenesis Male gonad development Macromolecule
biosynthetic process
Detection of light stimulus Fertilization Embryonic epithelial tube formation
Cellular protein metabolic process
Detection of abiotic stimulus
Sperm motility Development of primary male sexual characteristic Cellular macromolecule
metabolic process
Phototransduction Spermatid development Germ cell development
Protein metabolic process Detection of light stimulus during visual perception
autonomia (Table 2). Brain-specific genes yielded GO processes such as transmission of nerve impulse and syn-aptic transmission. Disease enrichment for the brain set included epilepsy, seizures and mental disorders (Addi-tional file 7). Using the GSEA procedure [13] across the same ontologies produced similar distributions (Addi-tional file 8).
Network properties and interactome analysis of HK and tissue-specific genes
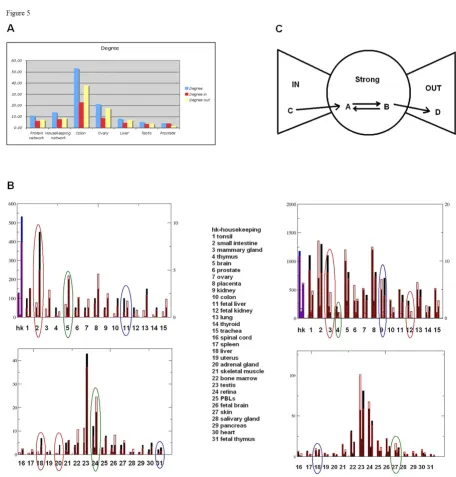
We analyzed the 'interaction space' of the protein prod-ucts of HK and tissue-specific genes in three steps. First, we calculated topological properties of the 'interactomes', such as degree of connectivity, average shortest path and clustering coefficient [14]. Second, we evaluated the inter-actome structure by parsing the interactions into three components (IN, OUT and giant strong component, GSC) using the 'bow-tie' classification of Broder et al. [15]. Third, we divided HK and tissue proteins into protein classes and calculated relative enrichment across particu-lar classes. For topological analysis, we used the direc-tional protein-protein interaction content in MetaCore™ (GeneGo Inc.). We also analyzed, for reference, four pre-viously published HK gene sets.
All five HK sets shared similar network topology features: higher connectivity, a somewhat lower clustering coeffi-cient, and shorter paths than the global human interac-tome (Figure 4A, Additional file 9). The tissue-specific networks varied substantially in their degree of connectiv-ity, with colon and ovary-specific proteins the most inter-connected, and prostate and salivary gland the least (Figure 4A, Additional file 10).
Network topology parameters were also used for tissue clustering. The topological distances between all possible tissue pairs were calculated as the ratio of the average shortest paths between proteins belonging to different tis-sues to the average shortest paths between proteins from the same tissue. Standard hierarchical clustering [16] was
applied to generate the tissue tree. Interestingly, some of the functionally related tissues such as brain, fetal brain, retina and spinal cord were grouped together and charac-terized by very similar average shortest paths (Additional file 10).
An interactome can be divided into three structural parts, or 'components' [15]. The GSC is the most densely con-nected part of the network, characterized by the property that any two nodes can be connected through directed paths in both directions. Directed paths from the GSC lead out to the OUT component and paths from the IN component go in to the GSC (Figure 4C, upper panel). In order to facilitate interpretation, the interactions were divided by 16 mechanisms (Additional file 11). The IN component is enriched with 'outgoing' interactions such as ligand-receptor binding interactions, which occur five times more frequently in IN than in GSC, and ten times more frequently than in the OUT component. Interac-tions between IN and GSC components also have five times more ligand-receptor interactions than between GSC and OUT. The GSC component predominantly fea-tures 'transcriptional regulation' interactions, which appear ten times more often in the GSC than the OUT, and six times more often than the IN components. The OUT component is enriched with 'incoming' interactions such as transcription factor target. Indeed, 48% of interac-tions between the GSC and OUT are transcription regula-tion compared with 4% of interacregula-tion between IN and GSC being transcription regulation. The GSC encom-passed around 50% of the HK network. Overall, the frac-tion of HK genes was larger in the GSC (p < 10-5) and slightly lower in the IN and OUT component than a ran-dom gene set of the same size (Figure 4C). This suggests that HK proteins comprise a significant proportion of sig-nal transduction interactions. Mammary gland and tonsil were enriched in GSC (p < 0.08 and p < 0.14); intestine and adult kidney in OUT component (p < 0.03 and p < 0.07), and skin (p < 0.1) in IN component (Figure 4C, Additional file 12).
Intracellular transport Detection of light stimulus during sensory perception
Development of primary sexual characteristics
Dopamine biosynthetic process from tyrosine Diseases Neoplasm by site Vision disorder Infertility Diabetes insipidus
Breast neoplasms Eye diseases Infertility, male Hypopituitarism Breast disease Retinal degeneration Dyskeratosis congenita Adrenal gland disease Genetic disease, inborn Sensation disorders Dysautonomia, familial Adrenal cortex disease Digestive systems
neoplasm
Night blindness Ciliary motility disorders Adrenal cortex neoplasm
Poxviridae infections Retinitis pigmentosa Kartagener Syndrome Adrenal gland neoplasm Lysosomal storage disease Eye diseases, hereditary Dextrocardia Carcinoma, basal cell Mental retardation Retinal diseases Herpes zoster Neoplasm, basal cell Aneuploidy Blindness Bronchiectasis Myokymia Vaccinia Retinitis Autonomic nervous system
diseases
Pathologic processes
Gene set enrichment with canonical maps, GeneGo processes, gene ontology processes and diseases was performed.
Figure 2
Next, all HK and tissue-specific sets were divided into pro-tein classes according to the MetaCore propro-tein classifica-tion schema (Addiclassifica-tional file 13). Enrichment in proteins of a certain class was then calculated from the hypergeo-metric distribution. The distribution of protein classes in the global interactome was used as a reference (Methods). HK proteins were enriched in enzymes (p < 10-8). Intes-tine, liver and adrenal gland featured the highest fraction of enzymes. Fetal tissues were highly enriched in tran-scription factors, and retina and brain in membrane receptors (Figure 4B). Such distributions make intuitive biological sense, and both network structure and protein class enrichment were consistent with each other.
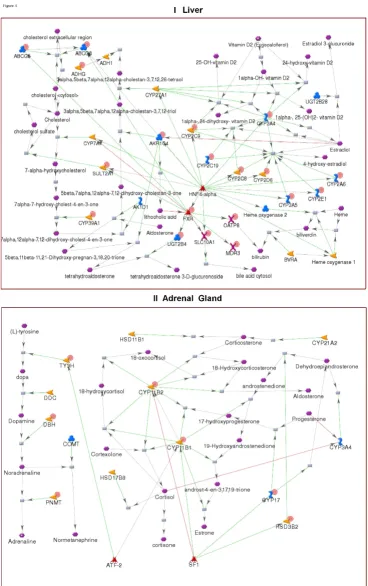
Tissue-specific networks
We generated tissue-specific networks for nine tissues using the Analyze Networks (AN) network algorithm in MetaCore. AN is a version of the 'shortest path' algorithm, optimized for larger data sets. AN generates overlapping sub-networks of up to 50 nodes and calculates enrich-ment of the networks with input data and canonical path-ways [17,18]. Unlike pre-built GG process networks, AN networks are built from input lists of network objects using the manually curated interaction database in Meta-Core. The networks comprise metabolic reactions, signal-ing interactions and canonical pathways. The tissue-specific networks for liver and adrenal gland are shown in Figure 5. The liver network is enriched with cholesterol metabolism, as well as with enzymes involved in aldoster-one, estradiol and heme metabolism. The adrenal net-work reflects the hormonal function of that organ. It is comprised of reactions and enzymes taking part in adren-aline, noradrenaline and corticosteroid synthesis.
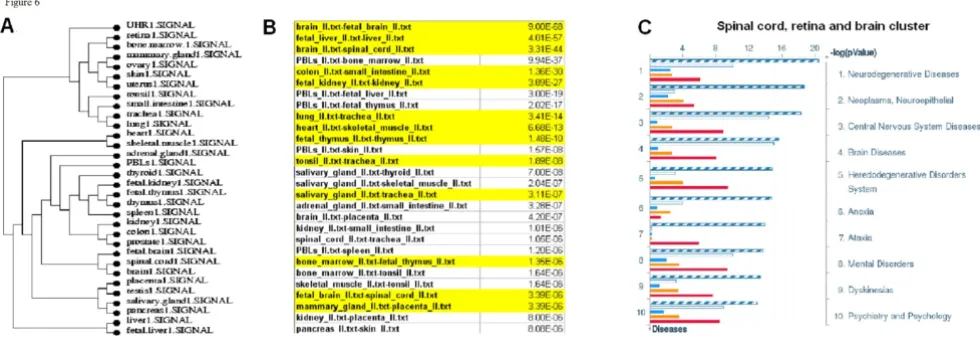
Clustering tissues based on gene expression patterns Tissue gene expression patterns were clustered by Eucli-dean distance across the average normalized probe inten-sities of the replicate hybridizations for each tissue [18] (Figure 6A). Most tissue clusters display evolutionary and functional relatedness. Fetal tissues clustered closest to their adult counterparts (brain-fetal brain, liver-fetal liver, thymus-fetal thymus, Figure 6A). Tissues of the same developmental origin (ectodermal, mesodermal or endo-dermal) tended to cluster together; for instance, heart and skeletal muscle are both derived from mesoderm, pan-creas and salivary gland are part of the gastrointestinal sys-tem. Almost all of the most closely correlated tissue pairs were evolutionary or functionally related. Some genes were uniquely expressed in pairs of tissue (Figure 6B), rather than individual tissues (for instance, in brain and fetal brain) or in triplets and quadruplets of tissues (brain, fetal brain and spinal cord) (Additional file 14). Often, these proteins were specific for a group of diseases. For instance, proteins uniquely present in spinal cord, retina
and brain are involved in central nervous system and neu-rodegenerative diseases (Figure 6C).
Drug target distribution between housekeeping and tissue-specific genes
We compared the distribution of drug targets between HK and tissue-specific protein sets. Two sets of drug targets were compiled: 'therapeutic targets' – a set of 104 direct protein targets of commercially available drugs, and 'xenobiotic targets' – 518 proteins known to interact with xenobiotics. Therapeutic drugs are defined as key proteins or genes directly affected by a marketed or withdrawn drug from the market. Xenobiotic targets are proteins and genes known for physical interactions with a large set of bioactive compounds including drugs, drug candidates and lead compounds.
On average, therapeutic targets were twice as prevalent among tissue-specific proteins than HK proteins (3.3% and 1.5% of all proteins, correspondingly) (Additional file 15). Therapeutic targets comprised as much as 25% of mammary gland and thymus-specific proteins. The distri-bution of xenobiotic targets was not essentially different between HK and the sum of tissue-specific proteins, with some 1.7% of HK proteins and 2.3% of tissue-specific pro-teins being xenobiotic targets. Some tissues, however, were highly enriched with xenobiotic targets. For instance, over 10% of proteins specific for mammary gland, ovary, retina, small intestine and spinal cord were identified as xenobiotic targets (Additional file 15).
Discussion
The definition of a 'housekeeping' or 'universally-expressed' gene is not settled. Suggested approaches vary from an estimated 10% of all genes [4] to transcript copy number [3] to using 'present' calls [5]. Elisenberg and Levanon [2] assumed that HK genes are highly expressed 'by nature' and, therefore, must be selected for shorter introns. We followed the original 'common-sense' pro-posal of Watson et al. [1] to define 2374 genes as HK because their transcripts were detected in all 31 human tissues tested, at a signal-to-noise ratio ≥ 10, which we believe to be a relatively stringent cut-off (technical anal-ysis of platform sensitivity at ABI has indicated that a
sig-nal-to-noise ratio of ≥ 3 is sufficient to determine
'presence' of a transcript with a confidence of 99.9%. This set constitutes 8.2% of human genes based on the latest National Center for Biotechnology Information genome release http://www.ncbi.nlm.nih.gov/mapview/stats/ BuildStats.cgi?taxid=9606&build=36&ver=2.
Top-scored canonical maps for tissue-specific genesets Figure 3
Network analysis and protein class enrichment of housekeeping and tissue-specific genes Figure 4
Tissue-specific networks Figure 5
distribution is represented by a bimodal distribution with two peaks at 1 and 31 corresponding to tissue-specific and HK genes (Additional file 16). Interestingly, the female reproductive organ, ovary, expressed many fewer unique genes, probably due to the fact that ovary consists mainly of diploid tissue compared with the haploid-rich testis, as ovary produces far fewer eggs than testis does sperm.
There is continuing debate in gene expression analysis over how to best identify genes differentially expressed between treatment conditions, disease states and so on. Arbitrarily applied cut-offs in relative magnitude of expression (fold-change) and statistical measures such as
ANOVA and t-test are commonly used [19,20]. Renewed
debate was sparked recently [21,22] following publication of the results of the Microarray Quality Control Consor-tium research efforts [23]. It was shown that a combina-tion of non-stringent statistical cut-offs and fold-change ranking of gene lists resulted in improved concordance between measurements made using different expression analysis technologies, an approach likely therefore to give the most accurate biological 'answer'.
We applied both signal level (signal-to-noise) and statisti-cal (t-test) methods to determine tissue specificity of gene expression. Although the resulting datasets did not over-lap well in gene content (6% on average), they were highly similar by functional analysis. Importantly, the intersections between distributions of entities within functional ontologies for SN10 and t-test sets were sub-stantially larger than between genes (Additional file 3), suggesting that the two methods both select biologically relevant genes, which can be interconnected on pathways
and networks. Further, despite incomplete overlap between our HK set and four other previously published HK sets, all gave very similar results in ontological enrich-ment analyses. These observations support the use of functional descriptors (pathways, networks, ontological categories and so on) as tools for quantitative characteri-zation of conditional gene expression [24].
HK and tissue-specific gene sets were subjected to compre-hensive functional analysis in three steps: enrichment analysis across functional ontologies using hypergeomet-ric distribution [12] and GSEA methods [13]; local inter-actome analysis; generation of signaling/metabolic networks using HK and tissue-specific gene content as input nodes. We used multiple functional ontologies for enrichment analysis: GO processes, GG processes, disease categories and canonical pathway maps. Each ontology is established using different criteria and reveals a different aspect of cellular functionality. Canonical pathways are experimentally confirmed multi-step chains of reactions. GO and GG processes differ, as connectivity is established at the level of functional association (GO processes) or binary interactions (GG processes). Diseases and disease network ontologies represent pathways involved in path-ological processes, largely derived from literature data linking network objects (genes, proteins, metabolites) to disease.
Ontology enrichment showed that HK genes, indeed, were enriched in vital cellular functions such as oxidative phosphorylation, ubiquitin-proteasomal proteolysis, translation and major pathways of endogenous metabo-lism. Importantly, many essential processes involve a Clustering tissues into groups based on expression patterns
Figure 6
large number of interconnected proteins (typically several hundred), and many of these genes belong to our HK set, confirming the functional integrity and completeness of the HK set.
Recently it was shown in line with our results that the number of HK genes is larger than previously reported [4,25]. Our findings are complementary to the high-reso-lution study based on expressed sequence tag (EST) profil-ing reported by Zhu et al. [25]. Indeed, both methods have advantages and drawbacks, EST data although have potentially higher resolution, suffers from poor annota-tion and low sampling depth [25]. Our results are very consistent throughout the 31 tissues and are well con-firmed by enrichment analysis in multiple functional ontologies. We expect that higher resolution data would not alter the main conclusions of the enrichment and net-work analysis.
Ontology enrichment in tissue-specific genes was strik-ingly different from HK genes, and in most cases strikstrik-ingly consistent with the tissue's function. Retina genes were enriched with such processes as visual perception, detec-tion of visible light, detecdetec-tion of light stimulus and eye disease-related genes, and testis genes scored highest for reproductive processes, cell cycle, cell division and male reproductive diseases, for example. Importantly, almost all tissues featured a high level of consistency between the highest-scored categories in different ontologies. Further,
consistency was observed whether hypergeometric p
-val-ues or GSEA analyses were employed. This important observation adds confidence to the conclusions drawn from the analysis of tissue-specific gene expression, and can be applied similarly to other studies of differentially expressed genes and proteins. It also will facilitate the development of a comprehensive set of 'meta-ontologies' derived from an understanding of the interplay and cross-over between the different types of ontological categories available, leading to improved understanding of biologi-cal systems, and the identification of biologibiologi-cally mean-ingful biomarkers and new therapeutic targets.
Network analysis [15] showed that a large part of HK genes belonged to the most interconnected GSC core of the global interactome, with equal representation of 'in' and 'out' interactions. On the other hand, tissue-specific genes varied greatly in network component composition. Skin and fetal brain were enriched with 'IN' component, consistent with a larger proportion of ligand-receptor interactions in these tissues. Not surprisingly, these tissues featured a large fraction of receptors in the protein class enrichment test. In comparison, 'effector' organs such as intestine, liver and kidney, were enriched with 'OUT' interactions and enzymes. A transcription factor-enzyme pair represents a typical directed 'out' interaction – a final
step in delivering a signal from stimulus to core 'effectors' such as endogenous metabolic pathways. These findings are in line with the 'bow-tie' structure of metabolic net-works, which ensures robustness of major biological func-tions [26], and is needed for coordinated response to stimuli and perturbation [27].
'Multi-dimensional' functional analysis of gene expres-sion data adds to the ongoing debate on proper statistical procedures for gene set selection. A 'rule of thumb' opin-ion is that only gene sets and distributopin-ions with low p -val-ues (typically, p < 0.01) should be considered valid,
although such ad hoc cut-offs may eliminate many
condi-tion-relevant genes from analysis. Functional analysis provides a different level of validation for such datasets by consideration of functional biological units. For instance, the retina-specific gene set is enriched in vision-related pathways, GO and GG ontologies, and diseases. The same set is enriched with OUT network component, and the protein class 'receptors'. Self-assembling retina-specific networks reconstruct rhodopsin-stimulated signal trans-duction and key steps in the metabolism of rhodopsin and its co-factors. Although the retina gene set is too small to achieve p-values < 0.01 in most of these analyses, the combination of independent functional evidence builds a strong case for its relevance and importance as a highly likely source of specific biomarkers for eye conditions and ophthalmic drug response. The comprehensive biological interaction data in MetaCore allows multiple 'high-con-tent' data types to be mapped onto networks. Gene expression data, proteomic, single nucleotide polymor-phism and metabolomic data all can be addressed, visual-ized and used in network construction and analysis, independently or in concert [28], making it a universal tool for studies on eye and other diseases.
Tissue-specific gene sets (and, therefore, networks) were twice as enriched in drug targets as the HK set. 'Therapeu-tic' targets comprised up to 25% of mammary gland and thymus-specific proteins. Most of the identified tissue-specific drug target genes are targets to drugs whose mech-anism are consistent with the tissues. For example, three brain-specific proteins identified to have at least one drug target are GABA-A receptor beta-2 subunit, Na (V) I alpha and SCN10A. GABA-A receptor beta-2 subunit is a target for clomethiazole (sedative and anticonvulsant), Na (V) I alpha is a target for drugs such as levetiracetam (epilepsy), tetrodotoxin (anesthetics), toprimate (anticonsulvant) and SCN10A is target for bupivacaine racemic (anesthet-ics) and lidocaine (anesthet(anesthet-ics).
detectable in blood and other readily accessible body liq-uids makes tissue-specific networks exceptionally attrac-tive for the identification of putaattrac-tive biomarkers of tissue-specific disease, drug-response or toxicity.
Methods
Data description
RNA from 31 normal human tissue RNAs (Table 1) was purchased from Clontech (Palo Alto, CA) while RNA from UHR (Universal Human Reference) was purchased from Strategene (San Diego, CA). All RNA samples were ana-lyzed on the Agilent 2100 Bioanalyzer for RNA quality control. Three technical replicates were included for each of the tissue sample.
The Applied Biosystems Human Genome Survey Microar-ray (P/N 4337467) contains 31,700 60-mer oligonucle-otide probes representing 27,868 individual human genes. Digoxigenin-UTP labeled cRNA was generated and
amplified from 1 μg of total RNA from each sample using
Applied Biosystems Chemiluminescent RT-IVT Labeling Kit v 1. 0 (P/N 4340472) according to the manufacturer's protocol (P/N 4339629). Fifteen micrograms of DIG-labeled cRNA was hybridized for 16 hrs at 55°C and chemiluminescence detection, image acquisition and analysis were performed using Applied Biosystems Chemiluminescence Detection Kit (P/N 4342142) and Applied Biosystems 1700 Chemiluminescent Microarray Analyzer (P/N 4338036) following the manufacturer's protocol (P/N 4339629). Images were auto-gridded and the chemiluminescent signals were quantified, back-ground subtracted, and finally, spot- and spatially-nor-malized using the Applied Biosystems 1700 Chemiluminescent Microarray Analyzer software v 1. 1 (P/N 4336391). Probe signals were normalized using the Limma method [29]. The gene expression data is publicly available at GEO public repository website. (GSE7905).
Identification of HK and tissue-specific genes
A 'stringent' set of HK genes expressed in each of the 31 tis-sues was identified by applying cut-off to the ABI-calcu-lated signal-to-noise (S/N) for each probe. The S/N is a metric that captures the confidence of the measurement 'detectability' above all known sources of noise. S/N is commonly used to bin genes or probes as 'Present' or 'Absent' at a desired level of confidence. Since the S/N expresses the number of standard deviations, the associ-ated confidence can be looked up from a probability table for a normal distribution. For example, signals with S/N ≥ 3 have > 99.9% confidence in the measurement. For our purposes in determining whether a gene was expressed in a given tissue, we additionally took into account the inflection points where the slope of the S/N curve signifi-cantly changes. We applied the threshold across all three replicate hybridizations on a probe-by-probe basis to
identify the genes expressed in each tissue with a high level of confidence. The overlap between all 31 sets, that is, genes consistently expressed in all tissues, defines the HK set (more details in Additional file 17). Tissue-specific genes were defined as those uniquely expressed in a single
given tissue at a S/N ≥ 10. Genes expressed in highly
related tissue pairs were also defined as tissue specific for some analyses.
Topological measures
Degree of nodes
The number of links connected to a node gives the node's degree. Since many real networks are directed, nodes are characterized by in and out-degree, giving the number of incoming and outgoing interactions.
Average shortest path
The shortest distance between two nodes is the number of links along the shortest path. The average shortest path is the average over the shortest paths for all node pairs in the network. When we calculate the shortest paths for a subset of nodes in the network we consider also paths crossing through nodes that are not part of the subset.
Average clustering coefficient
The clustering coefficient is a measure that captures to what degree node's neighbors are connected. It is defined as:
where ni is the number of links among the ki neighbors of node i. As ki(ki-1)/2 is the maximum number of such links, the clustering coefficient is a number between 0 and 1. The average clustering coefficient is obtained by averag-ing over the clusteraverag-ing coefficient of individual nodes. A network with high clustering coefficient is characterized by highly connected sub-graphs.
P-value calculation
The enrichment levels of the HK genes and tissue-specific genes in the different parts of the network (IN, OUT, GSC) and in different protein classes were calculated using the hyper-geometric distribution:
We calculated the p-value corresponding to the
enrich-ment-level according to
C ni
ki ki
i= −
2 1
( )
which gives the probability of having k or more marked elements in a sample of size n by random selection.
Competing interests
The authors declare that they have no competing interests.
Authors' contributions
TN, YN and ZD conceived the study and designed research. ZD drafted and YN wrote the final manuscript. RJB contributed to writing and editing of the manuscript. ZD, WS and ES performed the statistical analysis of the data. TS, DD, AB, AG, ES, ZD and YN performed research. ER contributed with making the figures in the manuscript. KL, JB, RRS designed and carried out the experiment
Additional material
Additional file 1
List of all housekeeping genes Click here for file
[http://www.biomedcentral.com/content/supplementary/1741-7007-6-49-S1.xls]
Additional file 2
List of all tissue-specific genes Click here for file
[http://www.biomedcentral.com/content/supplementary/1741-7007-6-49-S2.xls]
Additional file 3
Table for intersection between genes, ontologies Click here for file
[http://www.biomedcentral.com/content/supplementary/1741-7007-6-49-S3.xls]
Additional file 4
Complete enrichment analysis for all housekeeping sets Click here for file
[http://www.biomedcentral.com/content/supplementary/1741-7007-6-49-S4.xls]
Additional file 5
Canonical pathway maps and GeneGo networks essential for growth and viability
Click here for file
[http://www.biomedcentral.com/content/supplementary/1741-7007-6-49-S5.xls]
Additional file 6
Enrichment analysis of the unique parts of the housekeeping gene sets Click here for file
[http://www.biomedcentral.com/content/supplementary/1741-7007-6-49-S6.doc]
p k P i D n N
i k D
( )= ( , , , )
=
∑
Additional file 7
Complete enrichment analysis of all tissues in all four ontologiesClick here for file
[http://www.biomedcentral.com/content/supplementary/1741-7007-6-49-S7.xls]
Additional file 8
Gene Set Enrichment Analysis for selected tissues, ontologies Click here for file
[http://www.biomedcentral.com/content/supplementary/1741-7007-6-49-S8.xls]
Additional file 9
Network topological properties of all housekeeping sets Click here for file
[http://www.biomedcentral.com/content/supplementary/1741-7007-6-49-S9.xls]
Additional file 10
Tissue-specific connectivity Click here for file
[http://www.biomedcentral.com/content/supplementary/1741-7007-6-49-S10.doc]
Additional file 11
Table for interactions mechanisms Click here for file
[http://www.biomedcentral.com/content/supplementary/1741-7007-6-49-S11.xls]
Additional file 12
Table for component analysis, protein class analysis for all tissues Click here for file
[http://www.biomedcentral.com/content/supplementary/1741-7007-6-49-S12.xls]
Additional file 13
MC legend with protein classes Click here for file
[http://www.biomedcentral.com/content/supplementary/1741-7007-6-49-S13.doc]
Additional file 14
List of genes specific for tissue pairs and triplets Click here for file
[http://www.biomedcentral.com/content/supplementary/1741-7007-6-49-S14.xls]
Additional file 15
Drug targets Click here for file
[http://www.biomedcentral.com/content/supplementary/1741-7007-6-49-S15.xls]
Additional file 16
Tissue-specificity distribution of all genes Click here for file
Publish with BioMed Central and every scientist can read your work free of charge
"BioMed Central will be the most significant development for disseminating the results of biomedical researc h in our lifetime."
Sir Paul Nurse, Cancer Research UK
Your research papers will be:
available free of charge to the entire biomedical community
peer reviewed and published immediately upon acceptance
cited in PubMed and archived on PubMed Central
yours — you keep the copyright
Submit your manuscript here:
http://www.biomedcentral.com/info/publishing_adv.asp
BioMedcentral
References
1. Watson JD, Hopkins NH, Roberts JW, Steitz JA, Weiner AM: Molec-ular Biology of the GeneVolume 1. 2nd edition. Benjamin/Cummings; 1987:704.
2. Eisenberg E, Levanon EY: Human housekeeping genes are com-pact. Trends Genet 2003, 19(7):362-365.
3. Warrington JA, Nair A, Mahadevappa M, Tsyganskaya M: Compari-son of human adult and fetal expression and identification of 535 housekeeping/maintenance genes. Physiol Genomics 2000,
2:143-147.
4. Tu Z, Wang L, Xu M, Zhou X, Chen T, Sun F: Further understand-ing human disease genes by comparunderstand-ing with housekeepunderstand-ing genes and other genes. BMC Genomics 2006, 7:31.
5. Hsiao LL, Dangond F, Yoshida T, Hong R, Jensen RV, Misra J, Dillon W, Lee KF, Clark KE, Haverty P, Weng Z, Mutter GI, Frosch MP, MacDonald ME, Milford EL, Crum CP, Bueno R, Pratt RE, Mahadevappa M, Warrington JA, Stephanopoulos G, Stephanopoulos G, Gullans SR: A compendium of gene expression in normal human tissues. Physiol Genomics 2001, 7:97-104.
6. Smith AD, Sumazin P, Zhang MQ: Tissue-specific regulatory ele-ments in mammalian promoters. Mol Syst Biol 2007, 3:73. 7. Kouadjo KE, Nishida Y, Cadrin-Girard JF, Yoshioka M, St-Amand J:
Housekeeping and tissue-specific genes in mouse tissues.
BMC Genomics 2007, 8:127.
8. Lee S, Jo M, Koh SS, Kim S: Identification of novel universal housekeeping genes by statistical analysis of microarray data. J Biochem Mol Biol 2007, 40:226-231.
9. Kadota K, Nishimura SI, Bono H, Nakamura S, Hayashizaki Y, Okazaki Y, Takahashi K: Detection of genes with tissue-specific expres-sion patterns using Akaike's information criterion proce-dure. Physiol Genomics 2003, 12:251-259.
10. Schultz N, Hamra FK, Garbers DL: A multiple of genes expressed solely in meiotic or postmeiotic spermatogenic cells offers a myriad of conservative targets. Proc Natl Acad Sci USA 2003,
100:12201-12206.
11. Chalmel F, Rolland AD, Niederhauser-Wiederkehr C, Chung CSW, Demougin P, Gattiker A, Moore J, Patard JJ, Wolgemuth DJ, Jégou B, Primig M: The conserved transcriptome in human and rodent male gametogenesis. Proc Natl Acad Sci USA 2007, 104:8346-8351. 12. Feller W: The Hypergeometric Series. In An Introduction to Prob-ability Theory and its ApplicationsVolume 1. 3rd edition. New York: Wiley; 1968:41-45.
13. Subramanian A, Tamayo P, Mootha VK, Mukherjee S, Ebert BL, Gil-lette MA, Paulovich A, Pomeroy SL, Golub TR, Lander ES, Mesirov JP:
Gene set enrichment analysis: A knowledge-based approach for interpreting genome-wide expression profiles. Proc Natl Acad Sci USA 2005, 102:15545-15550.
14. Barabasi AL, Oltvai Z: Network Biology: Understanding the cell's functional organization. Nat Rev Genet 2004, 5:101-113. 15. Broder A, Kumar R, Maghoul F, Raghavan P, Rajagopalan S, Stata R,
Tomkins A, Wiener J: Graph structure in the web. Computer Net-works 2000, 33:309-320.
16. Eisen MB, Spellman PT, Brown PO, Botstein D: Cluster analysis and display of genome-wide expression patterns. Proc Natl Acad Sci USA 1998, 95:14863-14868.
17. Ekins S, Nikolsky Y, Bugrim A, Kirillov E, Nikolskaya T: Pathway mapping tools for analysis of high content data. In Methods Mol BiolVolume 356. Humana Press; 2007:319-350.
18. Shipitsin M, Campbell LL, Argani P, Weremowitz S, Bloushtain-Qim-ron N, Yao J, Nikolskaya T, Serebryiskaya T, Berouhim T, Hu M, Halushka MK, Sukumar S, Parker LM, Anderson KS, Harris LN, Gar-ber JE, Richardson AL, Schnitt SJ, Nikolsky Y, Gelman RS, Polyak K:
Molecular definition of breast tumor heterogeneity. Cancer Cell 2007, 11:259-273.
19. Schena M, Shalon D, Davis RW, Brown PO: Quantitative Monitor-ing of Gene Expression Patterns with a Complementary DNA Microarray. Science 1995, 270:467-470.
20. Callow MJ, Dudoit S, Gong EL, Speed TP, Rubin EM: Microarray expression profiling identifies genes with altered expression in HDL-deficient mice. Genome Res 2000, 10:2022-2029. 21. Perket JM: Six things you won't find in the MAQC. Scientist
2006, 20:68-72.
22. Klebanov L, Qiu X, Welle S, Yakovlev A: Statistical methods and microarray data. Nat Biotechnol 2007, 25:25-26.
23. MAQC Consortium: The MicroArray Quality Control (MAQC) project shows inter- and intraplatform reproducibility of gene expression measurements. Nat Biotechnol 2006,
24:1151-1169.
24. Nikolsky Y, Ekins S, Nikolskaya T, Bugrim A: A novel method for generation of signature networks as biomarkers from com-plex high-throughput data. Toxicol Lett 2005, 158(1):20-29. 25. Zhu J, He F, Song S, Wang J, Yu J: How many human genes can
be defined as housekeeping with current expression data?
BMC Genomics 2008, 9:172.
26. Kitano H: Biological robustness. Nat Rev Genet 2004, 5:826-837. 27. Csete M, Doyle J: Bow ties, metabolism and disease. Trends
Bio-technol 2004, 22:446-450.
28. Adler AS, Lin M, Horlings H, Nuyten DSA, Vijver MJ van de, Chnag HY: Genetic regulators of large-scale transcriptional signa-tures in cancer. Nat Genet 2006, 38:421-430.
29. Smyth GK: Limma: Linear models for microarray data. In Bio-informatics and Computational Biology Solutions using R and Bioconductor Edited by: Gentleman R, Carey V, Dudoit S, Irizarry R, Huber W. New York: Springer; 2005:397-420.
Additional file 17
Definition of tissue specific and housekeeping genes Click here for file